-
Paper Information
- Next Paper
- Previous Paper
- Paper Submission
-
Journal Information
- About This Journal
- Editorial Board
- Current Issue
- Archive
- Author Guidelines
- Contact Us
Physical Chemistry
p-ISSN: 2167-7042 e-ISSN: 2167-7069
2012; 2(6): 109-115
doi: 10.5923/j.pc.20120206.05
Effect of γ-Radiation on Electrical and Magnetic Properties of Manganite Materials with Spinel Structures
 Abstract
 Reference
 Full-Text PDF
 Full-Text HTML
M. Khairy, M. A. Mousa
Chemistry Department, Faculty of Science, Benha University, Benha, Egypt
Correspondence to: M. Khairy, Chemistry Department, Faculty of Science, Benha University, Benha, Egypt.
| Email: |  |
Copyright © 2012 Scientific & Academic Publishing. All Rights Reserved.
Nano Co0.1Zn0.9Mn2O4 samples were prepared by hydrothermal method in absence and presence of surfactants. The samples were characterized using XRD, SEM and TEM. Magnetic and electrical properties (DC- and AC-conductivity) were studied. Influences of gamma radiation on the properties studied were investigated. All samples showed tetragonal spinel crystal structure with morphologies and crystallites sizes depending on the preparation method and lay in the range of 11- 72 nm. The conductivity results showed semiconducting behavior for the samples investigated and were explained by hopping mechanism in which the conduction occurred via electron exchange amongst transition metal ions situated on octahedral sites in spinel lattice. Room temperature magnetic properties using VSM were studied. The physical properties studied were found to be dependent on the type of surfactants used.
Keywords: Nano-Manganate, Surfactants, Γ-Irradiation, Magnetic Properties , Electrical Conductivity
Cite this paper: M. Khairy, M. A. Mousa, "Effect of γ-Radiation on Electrical and Magnetic Properties of Manganite Materials with Spinel Structures", Physical Chemistry, Vol. 2 No. 6, 2012, pp. 109-115. doi: 10.5923/j.pc.20120206.05.
Article Outline
1. Introduction
- Nanomaterials are structures with dimensions characteristically between 1 and 100 nm; when engineered appropriately, these materials exhibit a variety of unique and tunable chemical and physical properties compared to those of bulk. They are revolutionizing a wide range of fields and applications by allowing control of materials structure at the molecular scale and they have become a symbol of the new and fast developing research area of nanotechnology. The field of nanoscience has undergone unprecedented growth during the last few years and has received a great deal of attention. Significant enhancement of optical, mechanical, electrical, structural, and magnetic properties are commonly found through the use of novel nanomaterials[1].Among various nanomaterials, magnetic nanoparticles mainly spinel mixed transition metal oxides nanoparticles, are of special interest for their attractive scientific and technological aspects in different fields such as electronic[2], magnetic recording[3], solid batteries[4], catalyst[5], photocatalyst[6], drug delivery[7], pigments[8], ferrofluids[9], magnetic resonance imaging(MRI)[10]…….etc. These materials crystallize in the spinel structure, that is a cubic close packing of oxygen anions in which the cations are located on the tetrahedral sites (A) and the octahedral sites (B)[11].There are many methods for the preparation of nanocrystalline spinels, like sol–gel method[12], thermal decomposition[13], solid state reaction[14], microwave heating[15] , coprecipitation[16]or mechanical milling and mixing of respective oxides[17]. General approaches for shape control and production of anisotropic nanostructures rely on the availability of surfactants, which preferentially absorb on specific crystallographic faces. With ever increasing energy costs, the hydrothermal method may be better used for fine powder preparation because of the low temperature involved, crystal size and the morphology of the powders can be controlled by reaction conditions[18].Complex manganese oxides have recently evoked strong interest in various structures with different Mn valence states and Mn coordination for example in perovskites, or spinels. The manganites display a vast range of fascinating catalytic, electrical and magnetic properties, which often come about due to the mixed valence states of manganese[19-21]. As a part of our program to prepare and study physical properties of nano pure and doped ZnMn2O4; this work was designed to prepare nanosized Co0.1Zn0.9Mn2O4 which is a member of mixed transition-metal oxides by hydrothermal method in absence and in presence of different surfactants. The materials obtained were characterized by X-ray diffraction (XRD), scanning electron microscopy (SEM) and transmission electron microscopy (TEM). Electrical conductivity as well as magnetic properties of the produced materials were studied. The effects of -irradiation on the studied properties were also investigated.
2. Experimental
2.1. Materials
- All the chemical reagents used in the experiment were A.R. grade and used without further purification and treatment. The surfactants used in the preparation method were divided into three different groups: (a) Cationic surfactants: cetyltrimethyl ammonium bromide monohydrate (CTAB){CH3(CH2)15N(CH3)3Br} (98%) provided from Aldrich; (b) Anionic surfactants: dodecylbenzene sulphonic acid (Sulph) {CH3(CH2)11C6H4SO3H} provided from chemicals and dyes company, Kafr El Doar and (c) Nonionic surfactants: triton X-100 (TX) {C14H22O(C2H4O)n} provided from Arsamco.
2.2. Sample Preparation
- A mixed solution of 1 ml H2O2 (3%) and 6 ml NaOH (0.6 M) was poured slowly into a Teflon-lined stainless-steel autoclave filled with 3 ml Mn(NO3)2 (0.3 M) while stirring vigorously, and the reaction solution was continually stirred and kept for 20 min. at the room temperature. Suitable amounts Zn(NO3)2·6H2O (GFS Chemicals) were mixed to Co(NO3)2·6H2O (Carlo Erba) in 250 ml of distilled water. Then, metal of zinc and cobalt (II) in the Co/Co+Zn molar ratio of 0.1was added with the surfactant into the reaction solution. After this the reaction solutions were hydrothermally heated at 200℃ for four days. The samples prepared hydrothermally were cooled to room temperature, then the precipitates were filtered and washed with distilled water several times until pH=7, and finally dried in an oven at 90℃.Half of the prepared samples was irradiated by γ-ray source using a 60Co gamma cell ( 60Co gamma cell 2000 Ci with a dose rate of 1.5 Gy/s (150 rad/s) at a temperature of 30℃. Each samples was subjected to a total final dose of 1x10⁵ Gy (10 Mrad).The prepared samples are denoted as Z, ZCTAB , ZTX, and Zsulph for the samples prepared without surfactant and by using CTAB, TX, and sulph surfactants, respectively. The
 - irradiated samples will be denoted by *.
2.3. Techniques
- X-ray diffraction were performed on the investigated samples using a Philips X’Pert Pro Super diffractometer with Cu Kα radiation (λ = 1.54 Å) in the range of 2
 = 10 - 800. The density was determined by both the immersion Archimedes method and X- ray diffraction. Electron microscopes analysis using SEM and TEM were taken by an electron microscope model JEM-5200 Joel and Joel 2010, respectively. For electrical measurements, the powder samples were pressed uniaxially into a pellet of thickness 1–2 mm and of diameter 7 mm by applying pressure of ~ 0.3 Gpa for 3 min. Both faces of the pellets were coated with fine quality silver paint for good electrical contacts. DC conductivity was measured in the temperature range 300-400 K by the four terminal technique. The temperature was limited to 400 K to prevent grain growth and to ensure that the main particle size remained the same in the entire temperature range. AC-conductivity was measured by the two-probe method using Fluke PM 6306 programmable automatic (RCL) bridge at frequencies from 102–106 Hz over the same temperature range used in dc-measurements.
3. Results and Discussion
3.1. X-Ray Diffraction
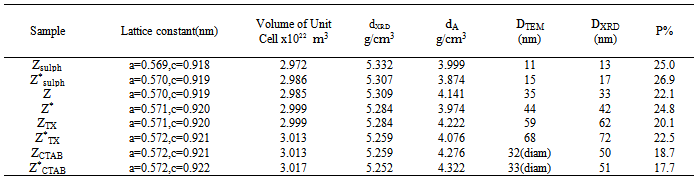
- X-ray diffraction patterns of the investigated samples are presented in Fig. 1. For all samples the same patterns were observed with well developed (h k l) reflections, which can be well indexed on the basis of the tetragonal spinel structure with the space group of Fd-3m[22]. No trace of impurity phases of starting materials is observed in the present patterns, indicating the formation of single – phase tetragonal spinel compounds. The parent component of ZnMn2O4 show spinel lattice consist of O2− anions form a close-packed tetragonal lattice in which the Zn2+ are located in tetrahedral sites (labeled as A sites) and Mn3+ cations are located in octahedral sites (labeled as B sites)[23]. The Co0.1Zn0.9Mn2O4 samples crystallize also as spinel with a unit cell (~299.00 A3) smaller than that of ZnMn2O4 (301.22 A3)[24]. This indicates that Co3+ ions partially replacing the Mn3+ ions in the octahedral sites[22].
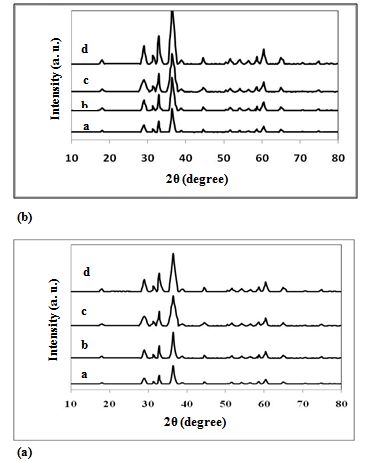 | Figure 1. (a) XRD patterns for unirradiated samples: a) Zsulph, b) Z, c)ZTX, d)ZCTAB (b) XRD patterns for γ-irradiated samples: a) Z*sulph, b) Z*, c)Z*TX, d)Z*CTAB |
|
 | (1) |
 is the wavelength of X-ray;
  is the full width at half maximum and
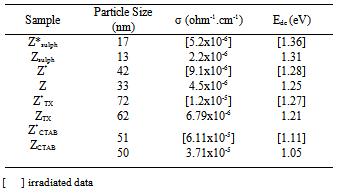
  is the Bragg’s diffraction angle. The crystallites sizes of the samples under investigation are presented in Table 1.The X-ray density of all the compositions was calculated using the formula:
 | (2) |
 | (3) |
3.2. SEM and TEM
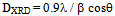
- The morphology and the particle size of the powdered samples are investigated using scanning electron micrographs (SEM) and transmission electron images (TEM). The analysis of images obtained (Fig. 2) reveals that the morphology of the prepared particles depends to a large extent on the type of surfactant used in the preparation method. Where, the micrographs of the sample prepared in absence of surfactant (Z) showed large grains with particles do not have a well-defined morphology. On the other hand, the samples prepared using CTAB surfactant (ZCTAB) showed the formation of nano rods particles. CTAB has been worked here as a morphology directing agent. CTAB has been also successfully used as the morphology-directing agent for the synthesis of one-dimensional nanostructures, such as CuO, PbO2, Pb3O4 and Co3O4 nanorods[28-29].
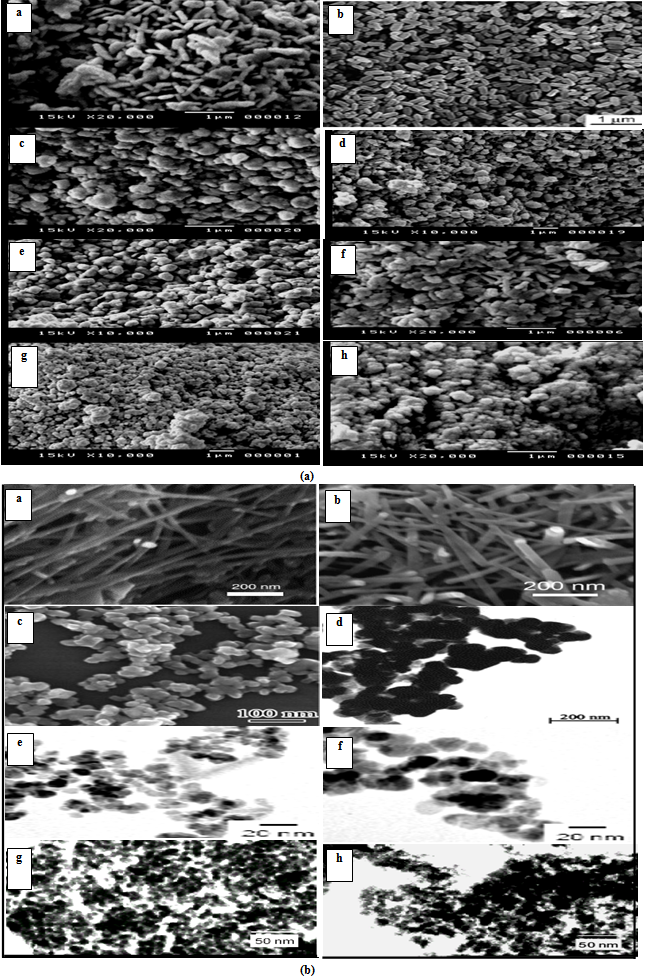 | Figure 2. (a) SEM: a) ZCTAB, b) Z*CTAB, c) ZTX, d) Z*TX, e) Zsulph, f) Z*sulph, g) Z, h) Z*. (b) TEM: a) ZCTAB, b) Z*CTAB, c) ZTX, d) Z*TX, e) Zsulph, f) Z*sulph, g) Z, h) Z* |
3.3. Electrical Properties
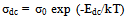
- The dc-conductivity (σdc) of the Co0.1Zn0.9Mn2O4 samples are evaluated using the relation
 | (4) |
 | (5) |
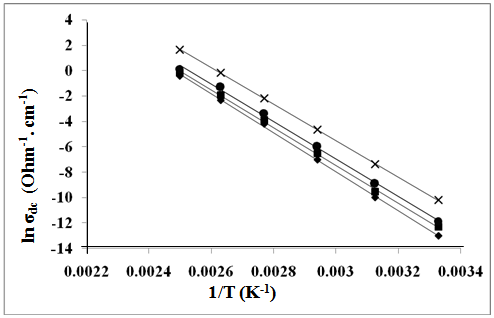 | Figure 3. The temperature dependence of DC-conductivity for: (♦), ZSulph; (■). Z; (●), ZTX; (×), ZCTAB |
|
 | (6) |
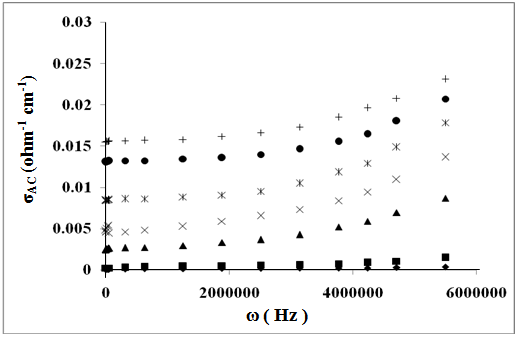 | Figure 4. The frequency dependence of AC-conductivity for: (♦), Z(Sulph); (■), Z; (▲), ZTX; (x), ZCTAB(300K);  , ZCTAB(340K); (●), ZCTAB(380K); (+), ZCTAB(400K) , ZCTAB(340K); (●), ZCTAB(380K); (+), ZCTAB(400K) |
 | (7) |
3.4. Magnetic Properties
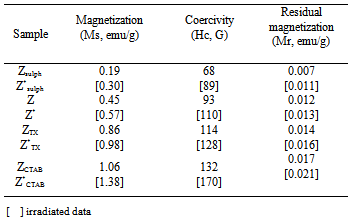
- Vibrating sample magnetometer (VSM) was used to investigate the magnetic properties of γ-irradiated and unirradiated Co0.1Zn0.9Mn2O4 at room temperature. All samples showed narrow hysteresis loops, indicating their slight ferromagnetism. Typical plot is shown in Fig. 5. The irradiated ones showed the same behavior. The saturation magnetizations Ms of the samples were obtained by extrapolating M vs. 1/H plot to 1/H=0. The variation trend of Ms, Hc and Mr was illustrated in Table 3. From which it can be seen that magnetization (Ms) values for irradiated are higher than unirradiated ones and increase in the following order: ZCTAB > ZTX > Z > Zsulph. The ferromagnetic properties of studied samples were attributed to the simultaneous presence of different valence states of Mn ions. They give rise to ferromagnetism via the double-exchange mechanism. Zinc ions act as the retardant of the magnetic interaction between the manganese ions. The increase in ferromagnetic character of the samples by irradiation, Table 3, may be attributed to the change occurring in the ratio of oxidizing and reducing amount of Mn- and Co-ions comparable with that present in unirradiated ones, as mentioned above. The nanorod sample SCTAB exhibit saturation magnetization (Ms) value, which is higher than that of other samples. This increase in magnetic properties may be strongly dependent on the growth direction of[110] which is one of the easiest magnetization in the spinel system[36]. Similar results were also found with Fe2O3 nanowires[37].The increase observed in saturation magnetization with the increase in particle size, Table 3, is attributed to the nature of ultrafine particles, including the surface disorder and surface spin canting due to large surface to volume ratio for nano particular system[38, 39]. This may be also attributed to different mechanisms, such as the existence of a magnetically dead layer on the particles surface, the existence of canted spin or the existence of a spin glass like behavior of the surface spins[36],[38-40].
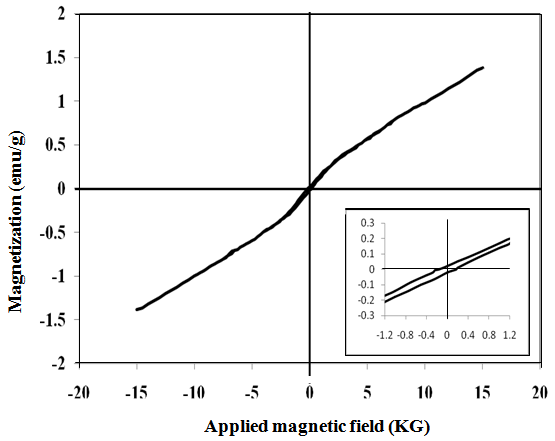 | Figure 5. Room temperature magnetic hysteresis loop of Z sample. The inset is the enlargements of the center part of the curves |
|
4. Conclusions
- Nanocrystalline Co0.1Zn0.9Mn2O4 were prepared in the range of 11-72 nm using hydrothermal method in presence and absence of surfactants. XRD showed a tetragonal spinel structure for the γ- irradiated and unirradiated samples. The size of the prepared particles has been confirmed through X-ray diffraction and TEM techniques. SEM and TEM images showed surface and particle morphology depends on each of the type of surfactants used and irradiation process. The porosity became also smaller after γ-irradiation process. Both ac- and dc- conductivity follows Arrhenius-type thermally activated conduction over temperature range investigated and referring to a semiconducting behavior for the γ- irradiated and unirradiated nano Cu0.1Zn0.9Mn2O4 samples. The irradiation process causes an increase in the conductivity values. Hopping mechanism between different oxidation states of Mn-ions in the Zn0.92+Co0.1-3y2+[Co2y3+Mn2(1-2x)3+Mn3x+4]O4- samples is used to explain the conducting behavior. All studied samples showed ferromagnetic behavior which increases with increasing each of the particle size and irradiation process. The relation between morphology (nanorod) and each of electrical and magnetic performance is observed.