-
Paper Information
- Next Paper
- Previous Paper
- Paper Submission
-
Journal Information
- About This Journal
- Editorial Board
- Current Issue
- Archive
- Author Guidelines
- Contact Us
Physical Chemistry
p-ISSN: 2167-7042 e-ISSN: 2167-7069
2012; 2(6): 103-108
doi: 10.5923/j.pc.20120206.04
Development and Validation of the Quantitative Analysis of Ampicillin Sodium in Powder for Injection by Fourier-transform Infrared Spectroscopy (FT-IR)
 Abstract
 Reference
 Full-Text PDF
 Full-Text HTML
Eliane Gandolpho Tótoli, Hérida Regina Nunes Salgado
Department of Drugs and Medicines, School of Pharmaceutical Sciences, UNESP – Univ Estadual Paulista, Araraquara, 14801-902, Brazil
Correspondence to: Hérida Regina Nunes Salgado, Department of Drugs and Medicines, School of Pharmaceutical Sciences, UNESP – Univ Estadual Paulista, Araraquara, 14801-902, Brazil.
| Email: |  |
Copyright © 2012 Scientific & Academic Publishing. All Rights Reserved.
This paper describes the validation of an innovative analytical method for ampicillin sodium in powder for injection quantification, using Fourier-transform infrared (FT-IR) transmission spectroscopy. This technique does not use organic solvents, which is one great advantage over the most common analytical methods. This fact contributes to minimize the generation of organic solvent waste by the industry and thereby reduces the impact of its activities on the environment. The method involved absorbance measurements of the band corresponding to one of the carbonyl groups in the molecule, centered in the region between 1800 and 1700 cm-1. The method was validated according to ICH guidelines, showing to be linear (r = 0.9993), precise, accurate and robust, over a concentration range from 1.0 to 3.0 mg. The validated method is able to quantify ampicillin sodium in powder for injection preparation and can be used as an environmentally friendly alternative for the routine analysis in quality control.
Keywords: Ampicillin Sodium, Analytical Methods, Quality Control, Spectroscopy, Quantitative, Validation
Cite this paper: Eliane Gandolpho Tótoli, Hérida Regina Nunes Salgado, "Development and Validation of the Quantitative Analysis of Ampicillin Sodium in Powder for Injection by Fourier-transform Infrared Spectroscopy (FT-IR)", Physical Chemistry, Vol. 2 No. 6, 2012, pp. 103-108. doi: 10.5923/j.pc.20120206.04.
Article Outline
1. Introduction
- Ampicillin is a semi-synthetic penicillin with a broad spectrum of action, which was produced in 1961 from the addition of different side chains to the penicillin nucleus[1,2]. It was the first semi-synthetic penicillin that showed activity against Gram-negative bacilli, opening the field of broad spectrum penicillins[3]. Thus, ampicillin preserves the penicillin antibacterial spectrum against Gram-positive microorganisms and it is even more active against Gram-negative, due to its increased ability to penetrate the outer membrane of these bacteria. However, it is inactivated by β-lactamases[1, 4-5]. Ampicillin sodium (AMP) (Figure 1) has the same action and use of ampicillin, considering that the sodium form is used for intramuscular and intravenous administrations[6].There are several analytical procedures available in the literature for the analysis of ampicillin, such as high performance liquid chromatography (HPLC)[3, 7-11], fluorimetry[12], spectrophotometry[13-14] andchemiluminescence[15]. However, most of them involve the use of organic solvents, which contributes to the generation of this kind of waste by the pharmaceutical industry.Special attention to the environmental preservation gained strength since the ´70s and today has a great impact on society. Thus, the trend is that the industries look for ways to reduce the impacts of their activities on the environment. In this way, they can adopt the posture of reduction, prevention or elimination of process waste. In this regard, there are some steps may be taken, including the replacement of analytical methodologies that employ organic solvents for others that do not use, the substitution of a synthesis process by another cleaner or “green” and the exchange of raw materials and supplies by other less toxic[16-17].
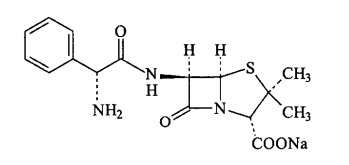 | Figure 1. Chemical structure of ampicillin sodium (CAS 69-52-3) |
2. Material and Methods
2.1. Chemicals
- Ampicillin sodium reference standard (AMP RS) (assigned purity 97.23%) was kindly donated by União Química® (Brazil), as well the ampicillin sodium in powder for injection solution (Uni Ampicilin®, União Química®, Brazil), containing 1000 mg of the active component. It has no excipients. Potassium bromide (KBr) used for the pellets preparation was analytical grade. Before use, the KBr was dried at 120oC until constant weight.
2.2. Instrumentation and Analytical Conditions
2.2.1. Equipment
- The FT-IR spectrometer used was a Shimadzu® (Kyoto, Japan), model IR Prestige-21, which allows spectral digitalization for obtaining electronic files of the analysis. The region comprised in the spectral analysis was from 4000 to 500 cm-1 at 2 cm-1 intervals. After obtaining the IR spectrum and with the assistance of the IR Solution software, quantitative analysis was carried out in the spectral region between 1800 and 1700 cm-1, related to a carbonyl band of the ampicillin sodium molecule, and this band had its height analyzed in terms of absorbance.
2.2.2. Obtaining of Analytical Curve
- Equivalent amounts of 1.0, 1.5, 2.0, 2.5 and 3.0 mg of AMP RS (previously diluted in potassium bromide 1:10, w/w) were taken and diluted with sufficient amounts of potassium bromide to obtain 150 mg pellets. The powders were mixed and ground until obtaining a homogeneous mixture. Thus, this mixture was compressed in a mechanical die press for 15 minutes to obtain translucent pellets, through which the beam of the spectrometer can pass.
2.2.3. Determination of AMP in the Pharmaceutical Dosage Form
2.2.3.1. Preparation of AMP RS Pellets
- Amounts of powder equivalent to 2.0 mg of ampicillin sodium (20.0 mg of the 1:10 dilution in potassium bromide) were taken and homogenized with 130 mg of potassium bromide, making the total pellet weight of 150 mg. The determinations were performed in triplicate.
2.2.3.2. Preparation of AMP Sample Pellets
- The contents of twenty vials of ampicillin sodium in powder for injection solution were mixed. From this mixture, amounts of 2.0 mg of ampicillin sodium (20.0 mg of the 1:10 dilution in potassium bromide) were taken and well homogenized with 130 mg of potassium bromide, comprising the total pellet weight of 150 mg. The determinations were performed in triplicate.
2.2.3.3. Calculation of Ampicillin Sodium Content in the Sample
- The ampicillin sodium concentration in the sample was calculated by Equation 1 and its percentage content was calculated by Equation 2.
 | (1) |
 | (2) |
2.2.4. Method Validation
- The method was validated by determining the following parameters: linearity, precision, accuracy, robustness, and detection and quantification limits, according to the literature recommendation[26].
2.2.4.1. Linearity
- With the intention of validate the method, five doses of AMP RS (1.0, 1.5, 2.0, 2.5 and 3.0 mg) were used. They were carried out in three different days. Linearity was evaluated by linear regression analysis, which was calculated by the least square method, and the statistical analysis was performed by ANOVA.
2.2.4.2. Precision
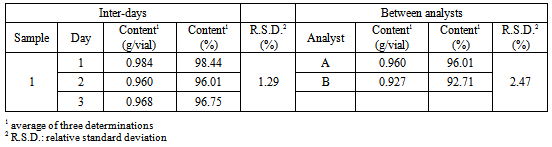
- The precision of the method was evaluated in two requisites: repeatability and intermediate precision. Repeatability (intra-assay) was studied by the performance of seven determinations of the sample in a concentration of 2.0 mg/pellet, all in the same day and identical working conditions. Intermediate precision (inter-assay) was assessed by performing the assay for a second analyst and also in three different days under the same experimental conditions. At the end of test, the relative standard deviation percentage (R.S.D.) values of the determinations were analysed[26].
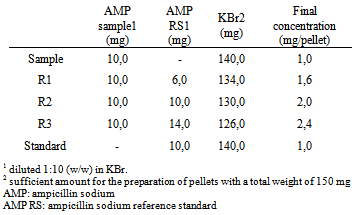
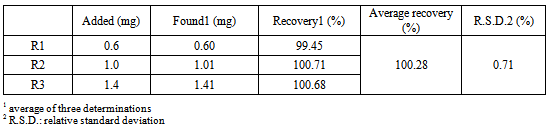
2.2.4.3. Accuracy
- Accuracy was attained via the recovery assay, in which known quantity of AMP RS was added to known quantity of the sample[26]. The recovery was performed in the 3 levels, R1, R2 and R3, and the pellets were prepared according to the Table 1, in triplicate.
|
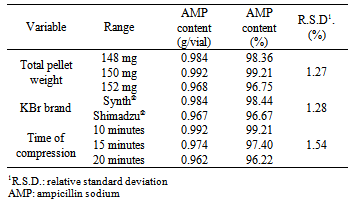
2.2.4.4. Robustness
- The robustness of the method was evaluated with the purpose of showing the reliability of the analysis concerning small variations in its working parameters. In other words, it shows that the validity of the method is maintained even with small variations in its working conditions. The following parameters were individually varied: total pellet weight, brand of potassium bromide and time compression. The obtained responses were evaluated according to the R.S.D. among the dosages.
2.2.4.5. Detection and Quantification Limits
- The detection (LOD) and quantification (LOQ) limits were calculated based on the intercept standard deviation and the curve slope, as described in the literature[26]. Three different curves were performed for the obtainment of the necessary data for the calculation. The values were calculated by the equations 3 and 4.
 | (3) |
 | (4) |
3. Results and Discussion
- Quality Control is a very important step in the process of drug manufacturing, as it ensures its safety and efficacy. Thus, research on quality control of pharmaceutical products to identify the content of active and the study of physical and chemical characteristics of the drug are essential to ensure the quality of the final product.In order to reduce environmental impacts of their activities on the environment, industries must seek alternatives to reduce, prevent or eliminate chemical residues in their routine processes. Thus, the replacement of analytical methods that employ organic solvents for others that do not employ them is an action may be taken for this purpose[16]. In that context, the infrared spectroscopy is a good option because it is a method that does not use organic solvents and also allows the quantification of compounds.Infrared spectroscopy is based on the fact that when molecules absorb energy, undergo a transition to a state of higher energy or excited state, and only vibrational energy transitions occur in the mid-infrared region. The vibrations induced by infrared radiation include strains and tensions of inter-atomic bonds and changes of bonds angles[28]. Considering that the molecule absorbs only selected frequencies in the infrared radiation, it will only absorb those that correspond to its natural vibrational frequency, which causes an increase in the amplitude of vibrational motion of its chemical bonds. Thus, the vibration frequency can be associated with a particular bond type[23].
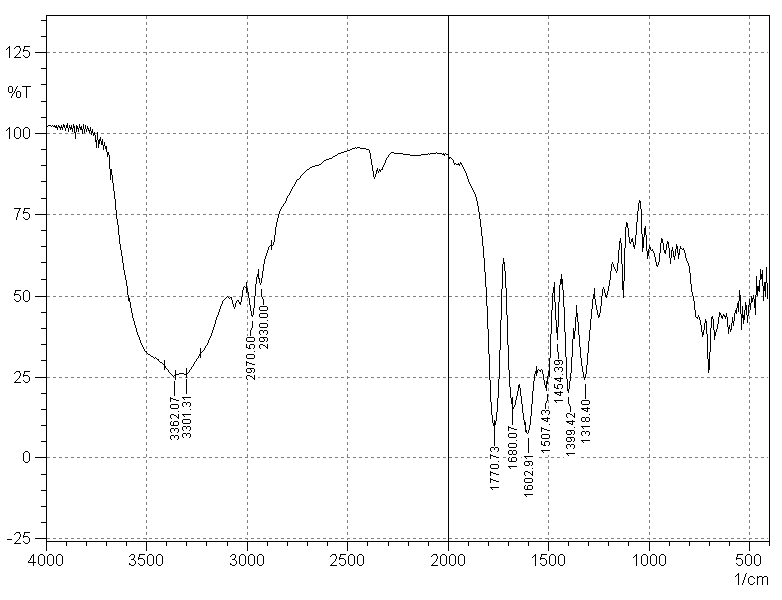 | Figure 2. Infrared spectrum of AMP RS (concentration of 2 mg/pellet) |
3.1. Method Validation
3.1.1. Linearity
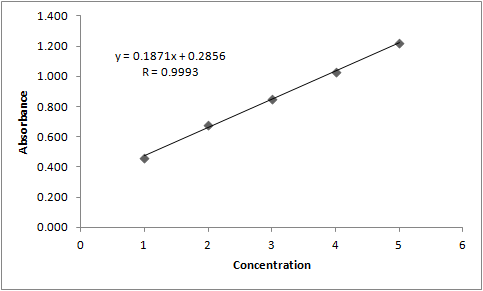 | Figure 3. Graphical representation of the ampicillin sodium analytical curve by FT-IR spectroscopy |
3.1.2. Precision
- The precision of the method was evaluated by three parameters: intra-day or repeatability, inter-days or intermediate precision, and between analysts. The results were expressed based on the R.S.D. The intra-assay precision provided the R.S.D. value of 1.70%. The R.S.D. values presented by the inter-assay and between-analysts were lower than 2.47%, and are represented in the Table 2. The data show a good precision of the method, since the R.S.D. values are close to 2% and below 5%.
3.1.3. Accuracy
- The accuracy of the method was determined by the recovery assay, which was done in three concentration levels and the results are presented in the Table 3. The data shows that the method has the adequate accuracy, meaning that the experimental concentration values are very close to the real values, since in the range of 80% - 120%, the recovery rates were close to 100%.
3.1.4. Robustness
- The robustness was evaluated by small modifications, individually, in the following method parameters: total pellet weight, brand of potassium bromide and time compression. The results are represented in the Table 4. The R.S.D. values shown are smaller than 2%, showing the robustness of the analytical method for the analysis of the AMP by FT-IR spectroscopy.
|
|
|
3.1.5. Detection and Quantification Limits
- The detection and quantification limits were calculated in order to determine the sensibility of the method. The calculated value for the detection limit was of 0.13 mg, and the quantification limit was of 0.4 mg. The values obtained indicate the reliability of the method to detect and quantify the AMP powder for injectable preparation.
4. Conclusions
- The results showed that the infrared method for the ampicillin sodium in powder for injection preparation quantitation presented good linearity, precision, accuracy and robustness in the range of concentrations from 1.0 to 3.0 mg/pellet. Therefore, it is a method interchangeable with other methods already described for the same purpose and can be used in routine tests for quality control of a pharmaceutical industry. Furthermore, it has some advantages over other methods described in the literature for ampicillin sodium, and the main one is that do not use organic solvents, which contributes to the non-generation of this type of residue, contributing to minimize the environmental impact of pharmaceutical industries. In addition, this study opens the possibility of applying the FT-IR spectroscopy to the quantification of other drugs.
ACKNOWLEDGEMENTS
- This work was supported by PACD-FCFAr-UNESP (Araraquara, Brazil), FAPESP (São Paulo, Brazil), FUNDUNESP (São Paulo, Brazil) and CNPq (Brasília, Brazil). E.G. Tótoli was funded by FAPESP (São Paulo, Brazil) and H.R.N. Salgado was funded by CNPq (Brasília, Brazil).