A. Zubow 1, K. Zubow 2, V. A. Zubow 2
1Dept. of Computer Science, Humboldt University Berlin, Johann von Neumann Haus, D-12489 Berlin, Germany
2A IST Handels- und Consulting GmbH, dept. R&D, D-17192 Groß Gievitz, Germany
Correspondence to: V. A. Zubow , A IST Handels- und Consulting GmbH, dept. R&D, D-17192 Groß Gievitz, Germany.
| Email: |  |
Copyright © 2012 Scientific & Academic Publishing. All Rights Reserved.
Abstract
The long-range order (LRO) at molecular cluster level in the river Peene and the See in is investigated by gravitational mass spectroscopy (GMS). LRO formation is recorded in natural waters, it depends on the water dynamics, light, depth, time of day, solar radiation and the position of the Earth to other celestial bodies. It was found that LRO of water in the lake at a depth of 1 m is sensitive to celestial bodies. It has been analyzed, how the base cluster (H2O)11±1 and its accompanying clusters consisting of 45, 100 and 280 water molecules behave.
Keywords:
Natural Waters, Molecular Clusters, Celestial Bodies
Cite this paper:
A. Zubow , K. Zubow , V. A. Zubow , "Molecular Water Clusters in River and and Their Dynamics. Celestial Bodies Influence", Physical Chemistry, Vol. 2 No. 5, 2012, pp. 56-66. doi: 10.5923/j.pc.20120205.01.
1. Introduction
To investigate the cluster formation in natural waters e. g. rivers, lakes, rain, springs, glaciers, underground waters, water in biomatrices as well as in seas and oceans is of high interest. There are some water cluster structures with a minimal potential energy that are modelled by computer programs they are in the expanded or collapsed forms[1]. Earlier it was concluded by the authors that in water solutions of salts, alcohols and acids form water clusters first and then SCIPs and assembles with organics[2],[3],[4]. Furthermore, the item “ideal solution” is argued to be incorrect and the structure of such liquids has to be understood rather as a nano-emulsion of solvent clusters or as nano-suspension of SCIPs. This statistical cluster ensemble built in liquids is characterized by a long-range order – a compelled distribution of mass concetrations (clusters) under the influence of white gravitation noises. Here the stable long-range order is in a balance with different destructive influences: heat/mechanical flows, resonance fields of surrounding cluster analogues, gravitation radiation from celestial bodies and tectonic deformations. Hence, a changed long-range order in natural waters should influence hydrochemical, hydrological, technological, climatic processes as well as communication processes of living organisms.Dependencies are found to exist between the long-range order in natural water and seasons, time of day, temperature, sun radiation, water flows’ depth and velocity as well ascelestial bodies’ constellation[5]where the Sun and water flows’ velocity are of the highest relevance.In the fluid flow structure of long-range order varies depending on the structure of the vortex, its duration and intensity of turbulence. In strong turbulence in the river, there are new signals of clusters, which typically are in harmonious balance of collapsed-expanded in a laminar flow or in their absence (stagnant water). Depth has an effect on long-range order in river water, but it is still primarily determined by the structure of the flow [4] and the structure of the sun rays penetrating into the deeper layers of water. In all cases, the sun greatly affects the cluster structure of water in the surface layer (20…30 m). It should be noted that the planets exert a significant influence on the distribution of clusters in the surface waters.The aim of present work is the investigation of the long-range order in the lake, emerged from rain water and in the river flowing out of this lake.
2. Material and Methods
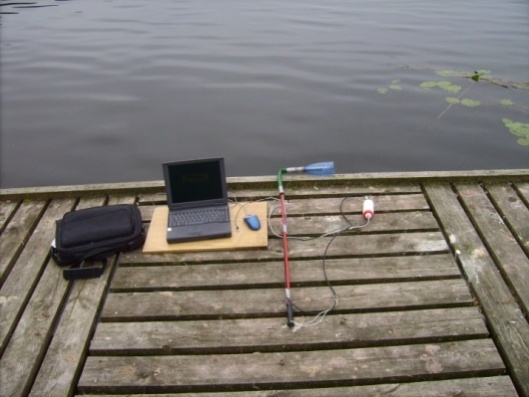 | Figure 1. Mobile GMS spectrometer (1) and GMS sensor (2) used for the analysis of the long-range order in natural waters |
The method how LRO in the lake will be measured with GMS is shown in Figure 1 where the method itself is described in [2],[3].Photo of GMS spectrometer and sensor applied to analyze the long-range order in natural waters (Figure 1). The analysis procedure of the long-range order in the field is simple and involves direct sampling of the gravitational noise at the place of measurement. With the same measurement cell were first measured the noises in the air and then in water (usually 3 times for 30 seconds) followed by signals’ cleaning and subtracting air signals from those in water. It is measured from 800 to 1000 in the morning at a location with the geographical coordinates 53° 38´ n., 12° 35´ e. Materials for this work, we chose from our archive for a small river, creek, located in the interaction with the lake of origin of rain. The river flows out of lake. Both river and lake most clearly highlight the essence of the problem with a simple example: a lake-river. Similar studies for the larger rivers because of the multi-factor influences, lose a clear correlation between the events, so we have intentionally omitted. MGMS – average molecular mass of all clusters in Dalton (Dalton), MGMS=Σ│f│·m), m – cluster mass (Dalton), f – energetical part of a cluster in ensemble of clusters, -f part of collapsed clusters, Дc – sum of all collapsed clusters, F95% - part of skeletal clusters and N – number of cluster kinds in ensemble, p – shock wave pressure.
3. Results and Discussion
3.1. River
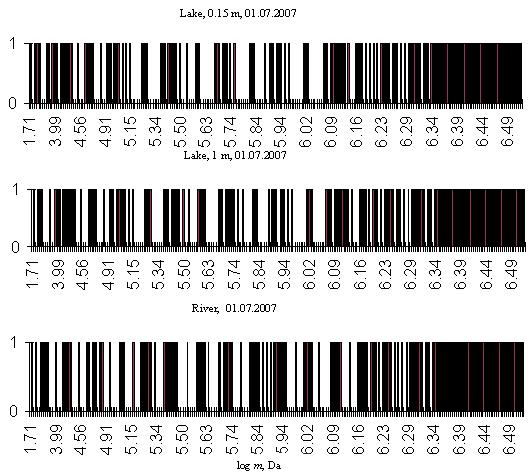
Figure 2 presented an overview of GMS spectrum of clusters in the water of the river Peene, filmed in mid-summer 2007. The appearance of weak signals from a cluster containing 45 ± 1 water molecules found in the turbulent parts of the river and could be a consequence of forced destruction of cluster structure of water flow. In this figure, the broad signal of the simplest water base cluster ((H2O)12) [6] is to be understood as the overlap of three water cluster signals consisting of 10, 11 and 12 molecules ((H2O)11±1). Note that clusters of 45, 100, 178, 280, etc. interact resonantly with the gravitational fields of the celestial bodies and can be used as a new generation of gravitational sensors. Thus, the signals’ instability of the Mercury cluster (H2O)45 in the river and the lake changes adequately approximation of Mercury to the Earth, and signals (H2O)11±1 satisfactorily correlated with the full Moon. A correlation between the signals detected from the Venus, Mars, Jupiter and Saturn clusters and the position of the planets is observed. In [5],[7], we tried to find an explanation for this phenomenon. It should be noted that the energy balance of the clusters in the river water varies seasonally and even during the day as well as in dependency on weather conditions, which we attached to a number of factors.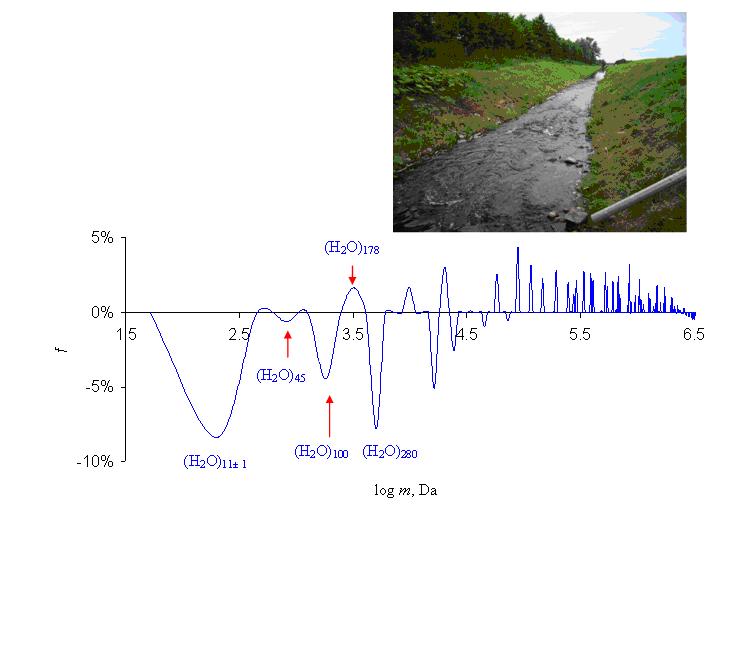 | Figure 2. Overview GMS spectrum of water in the river Peene (Peene, ), depth 0.15 m, 290 K. Cloudy, rain. July 1st, 2007, 11:00. 30 min. MGMS =519,885 Da, Дc = 34%, F95% = 31%, N = 162, p <1N/m2. The average results of 3 measurements of 30 seconds. The river flows out of the lake “Torgelower See” of rain origin. Location of sampling 300 meters from the lake (53.08 ° n and 12.75° e), pictures in the right corner. GMS-sensor was placed directly in the river water |
For water in the river, the cluster composition is not identically it depends on the flow velocity and turbulence. In strong turbulence a number of new clusters appear, which are not present in the calm water of the lake, these are the clusters of 60, 137, 242 water molecules. It also changes strongly the structure of the large clusters. This charming section of physical chemistry of natural waters is just beginning to take shape. There appears to hydrologist’s lot of interesting work.The bar code GMS spectra enables to identify the super cluster structure of water in the river some clusters are observed that occur in the lake water too though with some differences. The clusters in the river are more like those in the surface layers of the lake as those in the layers near the ground (Figures 3 and 6), apparently, the forced mixing of the river water flow and the wind exposure of the lake surface layers causes this.The integral cluster distribution in water of the river and the lake is different (Figure 4). Differences can be seen in the small-and medium-mass interval, apparently due to destruction of large water clusters by turbulence.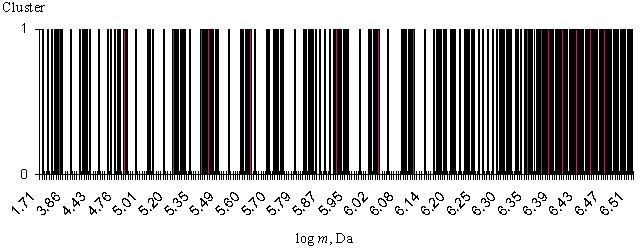 | Figure 3. GMS of water in the river Peene in a bar code (see Figure 2) |
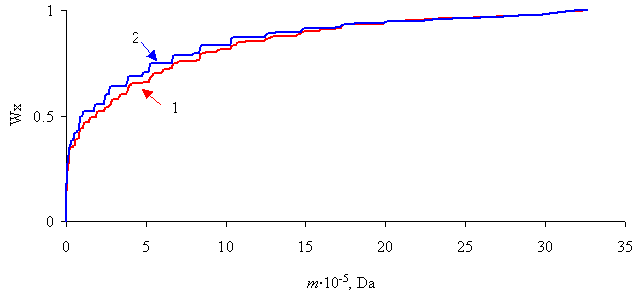 | Figure 4. Integral distribution of cluster fractions in water of river (1) (see Figure 3) and lake (of 1 m depth, 2). July 2007 |
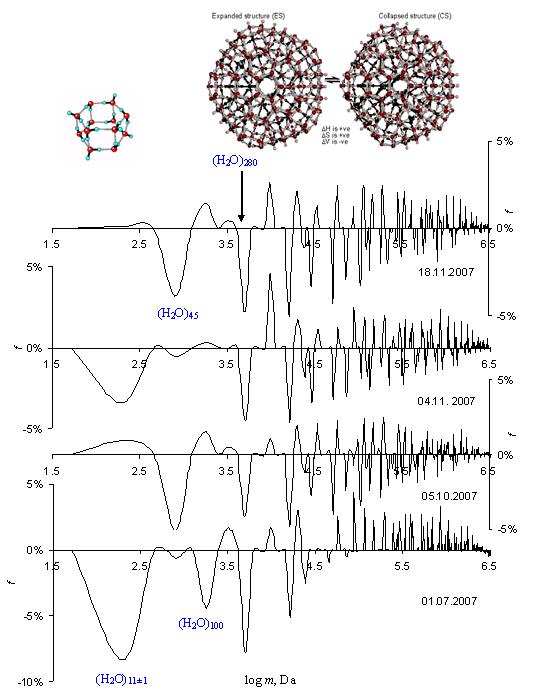 | Figure 5. GMS spectra of water in the river Peene (Peene, north ), depth 0.15 m, all three measurements made on a cloudy day: 01.07.2007: 11:30 CET, 290K, MGMS = 519,885 Da, Дc = 34 %, F95% = 31%, N = 162, p <1N/m2. October 5th, 2007: 08:12 CET, 286 K, MGMS = 439,683 Da, Дc = 58%, N = 135, p <1N/m2. 04.11.2007: 09:18 CET, 282K, MGMS = 510,303 Da, Дc = 53 %, N = 135, p < 1N/m2. 18.11.2007: 08:06 CET, 279 K, MGMS = 474,033 Da, Дc = 55 %, N = 129, p <1N/m2, Zubow constant taken equal to 6.4 · 10-15 N/m [7]. The model of the base water cluster is kindly made available by professor Lenz [1] and that one of (H2O)280 by professor Chaplin [1] |
GMS spectra of river water are not constant, they vary as seasonally. Figure 5 shows a sequence of GMS spectra of river water in the place shown in the photo in Figure 2. As visible the cluster structure of the river varies considerably only in the summer-autumn period. The most stable is the signal of the cluster consisting of 280 water molecules, the collapsed-expanded clusters’ balance in the other small clusters changes in different ways. For large clusters (log m > 4.5) changes have occurred as early as October 5th. It should be noted that the background noise of the river murmur remained constant, but the structure of the noises changed adequately to the decreasing of the water temperature. With decreasing temperature in the river the part of collapsed clusters (seed crystals) increases while the number of cluster kinds decreases. The average mass of clusters remains almost constant.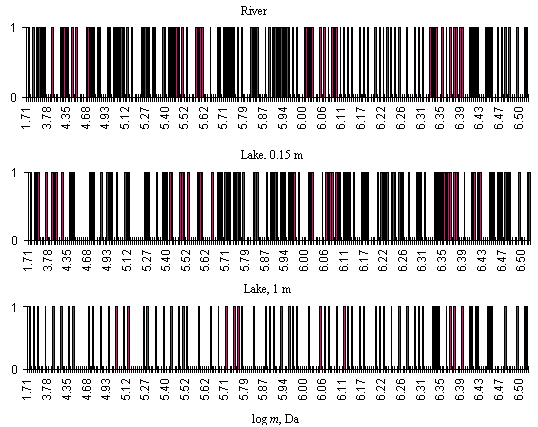 | Figure 6. GMS spectra of water in the lake in the form of bar code (different depths) and river. 2008-02-17. 8:00 CET (central European time). Water temperature: 275 K (lake), 276 K (river). Zubow constant 6.4 · 10-15 N/m, p <1N/m2. Cloudy |
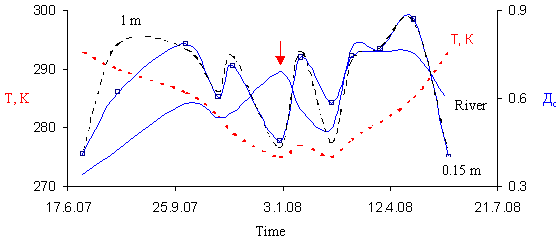 | Figure 7. Part of collapsed clusters (Дc) in river and lake water at different depths. All measurements were performed on a cloudy day from 8:00 to 10:00 in the morning. A mass range up to 2 million is taken. GMS sensor was placed directly into water |
It is interesting to trace the distribution of water clusters in the lake water in dependency on depth and to compare it with that one in the river flowing from the lake. In the Figure 6, the GMS spectra in the bar code for these waters on February 2008 are represented, the lake surface was covered with a thin layer of ice but the water in the river didn't freeze due to strong flow. One can see the difference in the distribution of the clusters. The long-range order in river water is characterized by a higher variety of signals compared with that one in the surface layer of the lake. The lowest number of cluster kinds is found in the bottom water of the lake.The Figure 7 shows how Дc changed during one year of observation. A clear correlation with the change in the water temperature is seen. The part of collapsed clusters in the surface waters varies adequate temperature. Only on 31.12.2007 (indicated by an arrow) a disharmony in the water long-range order both of the river and lake is found. Since the value of Дc is an integral characteristic of the whole cluster ensemble, it gives only a general idea of the distribution of the collapsed clusters. At the level of individual clusters, the situation is more complicated, during the year the individual clusters can repeatedly change their density, but it may remain relatively constant for several hours or even days. Water of rivers consists of molecular clusters, which form a long-range order. The natural flow of the river destroys the cluster structure of water connected with the formation of several clusters, which are absent in calm water. Temperature has a strong influence on the cluster formation in natural water as well as on the energy hierarchy of individual clusters in the ensemble. Individual water clusters react differently to a weak energy field. The long-range order in water of rivers is concluded to be caused by white gravitation noises.
3.2. Lakes
The cluster structure of water in lakes is highly dependent on the origin of the lake (water coming into it), water dynamics, time of day and year, temperature, depth, water reservoirs, as well as the influence of the sun. Below is material to study the formation of a water cluster in the lake of origin of rain (second rank according to the German classification). The Torgelower See is located in and is surrounded by agricultural lands. The maximum depth is 6-8 m and 80-90 % of it is about 1-1.5 m. Figure 8 presents overview GMS spectra of the lake water at different depths recorded in a selected point. The procedure for obtaining the data is seen from the following figure (Figure 8).These spectra were recorded in mid-summer 2007, in cloudy weather and in the absence of the sun, which is the strongest factor affecting the building of a super cluster structure in natural waters. During this time, the water in the lake is clear and not burdened with the flowering process, which usually dominates in the second half of summer. Figure 8 shows the presence of the basic, small water clusters in the freshwater lake. Attention is drawn to the absence of signals from the cluster consisting of 178 water molecules, which is present in the expanded form in the river flowing from the lake. The easiest clusters (up to 280 water molecules) are present in the collapsed form, but their signals are much stronger than in the river. This is an indication of a stronger individuality in the calm water of the lake. Since the salt content in the lake water is very small, in the GMS spectrum the signals of SCIPs (solvate clusters of ion pairs of salts) are overlaped by those of water clusters and their influence can be neglected.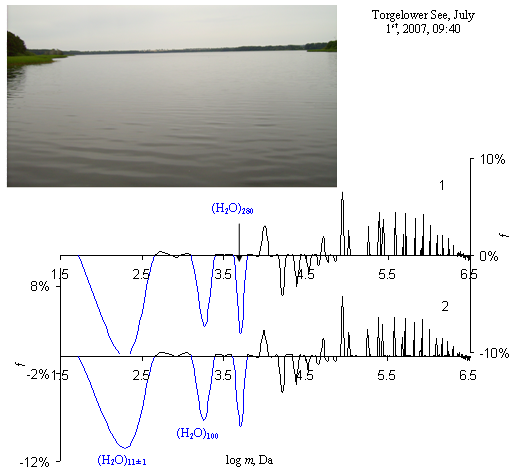 | Figure 8. Overview GMS spectra of water in the lake Torgelower See (engine – free area), Northern Germany, depth 0.15 m (1) and 1m (2), 290 K, 9:40 am. 1 – MGMS = 472,529 Da, Дc = 41%, F95% = 37 %, N = 159, 2 - MGMS = 468,886 Da, Дc = 41%, F95% = 23 %, N = 163. The average results of 3 measurements of 30 seconds, p <1N/m2 |
The analysis of the super cluster structure in the surface waters and deep layers of the lake did not reveal significant differences (Figure 9) in the warm season however, in winter there are differences (Figure 11). The differences are clearly visible when the spectra are set in relation to each other, for example, by the one spectrum is divided by the second, Figure 10.The cluster with the mass of 337,611 Da (Figure 10) has been detected at 1m depth, in the surface layers however, its signal intensity decreases strongly (more than 160 times). On the other hand, we find it again in the river flow, where its signal intensity is about 8000 times higher than in the surface layers of the lake. Hence its presence in some way is connected with the river flow.It is interesting to study during the day the long-range order changes in lake water. Figure 11 shows the results of such research in the surface layers of the Torgelower See. It is visible that in the lake during the day, there are strong changes in the long-range order. So MGMS achieves its maximum value at 11:00 am and in the afternoon it monotonically decreases by almost 2 times. The part of collapsed clusters reduced already from 6:00 am, but rises again at 15:00 pm, when the sensor is shaded by the tree crowns. Consequently, the sun radiation has a destroying effect on the water cluster structure in the lake. MGMS growth in the first half of the day is due to the loosening of the cluster structure and the individualization of the clusters, the weakening to the cluster interaction with the surroundings (an increase of the absolute values of f) under the influence of sun energy. In the afternoon, this process continued, but at the level of destruction of the clusters.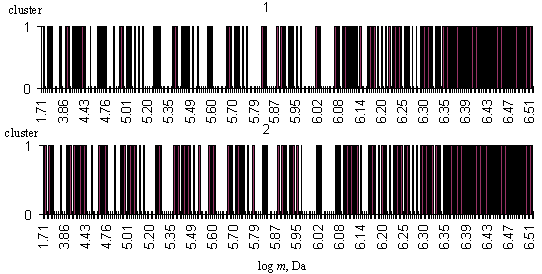 | Figure 9. GMS spectra of water in the lake in the form of bar code (see Figure 8) for depths of: 1 - 0.15 m and 2 - 1m |
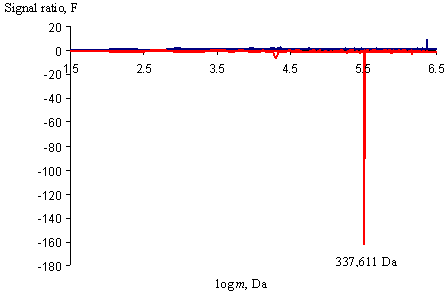 | Figure 10. GMS spectrum of signal ratios (F) of clusters in the surface water area (0.15 m) to those in the deep zone (1 m) of the lake, the positive quadrant means the formation of new clusters. The inverse ratio - cluster signals in the deep zone to the signals in surface layers (negative quadrant) - the disappearance of clusters |
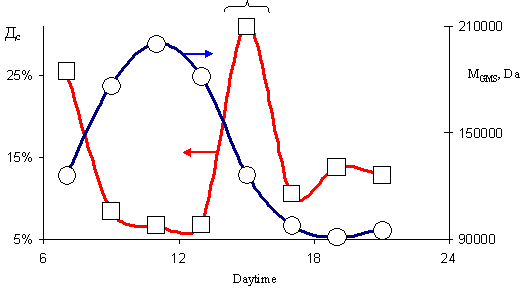 | Figure 11. Change in average cluster mass (MGMS) and the part of collapsed clusters (Дc) in the surface layers (0.15 m) of the See during July 7th, 2003. With a horizontal bracket the time interval is marked in which the GMS sensor was in the shade of the trees. 295 ± 2 K. Sunny cloudless weather |
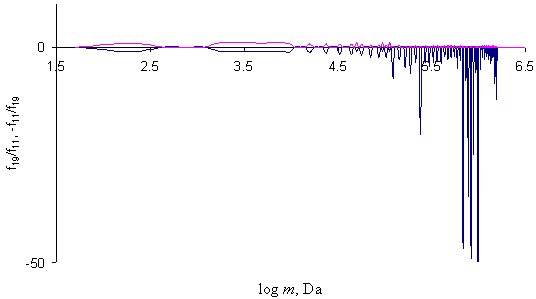 | Figure 12. GMS spectra of signal ratios (ratio of signals at 19:00 to those at 11:00 (f19/f11)). The positive quadrant shows new clusters appearing (agenda line), and the negative one is for vanishing clusters - an inverse ratio (-f11 / f19) |
| Table 1. Analysis results of GMS spectra of lake water. Depth 0.15 m. Slightly cloudy weather, p> 1 N/m2, cluster ensemble up to 3 million |
| | Daytime | MGMS, Da | Mmax, Da | Дc, % | Dexp, % | Temperature, К | Number of cluster kinds, N | Note | | 7:00 | 130051 | 2131459 | 26 | 74 | 292.7 | 61 | shadow | | 9:00 | 182747 | 1813045 | 8 | 92 | 292.8 | 57 | sun | | 11:00 | 206909 | 1738082 | 7 | 93 | 293.5 | 56 | sun | | 13:00 | 187997 | 1813045 | 7 | 93 | 296 | 57 | sun | | 15:00 | 130835 | 2131459 | 31 | 69 | 297 | 54 | shadow | | 17:00 | 100990 | 1591327 | 11 | 89 | 297.5 | 54 | sun | | 19:00 | 94487 | 1591327 | 14 | 86 | 297.1 | 54 | sun | | 21:00 | 98293 | 1591327 | 13 | 87 | 296 | 54 | sun |
|
|
It is visible from Figure 12 that at 19:00 in the lake there is no noticeable appearance of new clusters instead, the disappearance of a group of large clusters. It should be remembered that about a balance between collapsed and expanded forms can only be discussed when the cluster mass is less than 5,000 though, for large clusters, one should rather speak of cluster formation or decomposition. Therefore, the group of signals with log m > 5 shows the disappearance of large oscillators in the surface layers of the lake.Table 1 summarizes the main characteristics of the long-range order in the lake water during 2005-06-22.It is visible from table 1 how the temperature influences the average cluster mass. The MGMS varies inversely with temperature that means its increase leads to a decrease of MGMS. On the other hand, solar radiation affects the MGMS and has an even greater impact on the maximum of the detected mass cluster (Mmax) in this ensemble. The shading of the GMS sensor through the trees by 15 clock leads to a strong increase of Mmax as well as of the part of collapsed clusters by 23%. Thus clusters are concluded to storage solar energy, which accumulates in the structures of collapsed and very large clusters.It is remarkable that the part of expanded clusters is very high (Dexp, %, 74…93%) in the lake water being is several times greater than that of collapsed ones (Дc, %). So there are very little energy carriers at the cluster level, and thus the lake water is poor in energy. Comparison of the data given for lake and rainwater shows a striking difference in the long-range order of rain and lake water. Average, the number of cluster kinds in the lake water is by 8 to 10 % higher than in rain water (melt water).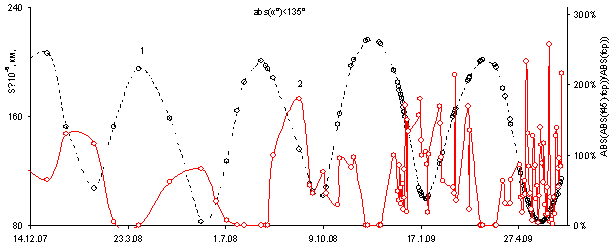 | Figure 13. The distance (S) between Earth and Mercury (1) versus the signal instability of the Mercury water cluster in the lake at a depth of 1m (curve 2, the deviation from the average value). The analysis is done for a small cluster ensemble of up to 2.3 million and for the angle Mercury-Sun-Earth | α | <135 º. The distance data to Mercury were taken from the program "ZET 8" (www.astrozet.net), p < 1 N/m2 |
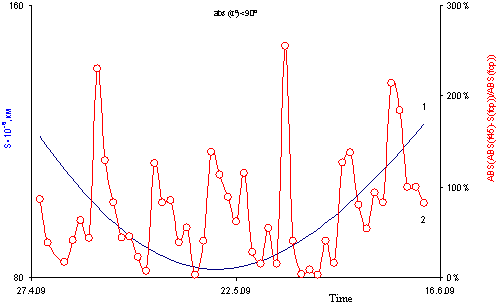 | Figure 14. Fragment of Figure 13 for more frequent sampling of gravitation noise in the See at approaching of planets. Legend, see Figure 13 |
 | Figure 15. GMS spectra of natural waters during summer and winter as bar codes. Summer 291 K, winter 275 K, p <1N/m2, Zubow constant amounts to 6.4 · 10-15N/m |
In the period from June 2007 to July 2009, periodic changes in the interaction between the mercury cluster ((H2O)45, [7]) and its surroundings at a depth of 1m are recorded (Figure 13).From the Figures 13 and 14 can be seen that the signal instability of the mercury water cluster changes periodically (88 days).When approaching Mercury to the Earth the signal instability of the mercury water cluster increases by several orders of magnitude however when it is removing from the Earth the signal instability is dramatically reduced. The cyclical nature of the instability agrees with the periodicity of the Mercury orbiting around the Sun being equally 88 days. The mercury cluster belongs to the whole ensemble of water clusters in the lake it will be influenced by both the four moon clusters (H2O)11±1 [7] and larger ones of the ensemble. All this makes it difficult to interpret the signals correctly and requires a complex mathematical processing.Increasing the number of analysis at the moment of Mercury approach to the Earth, a periodicity of the instability signals can also be found. The authors believe this to explain by the fact that Mercury crosses the gravitation power lines between the Sun and the Earth. This crossing has a shielding effect on the energy flow to the lake and to its biocenosis.Figure 15 shows the spectra of the super cluster structure (as bar code) in the river and lake during summer and winter. As can be seen, the distribution of clusters in natural waters varies seasonally. Here in summer, a harmonization of water cluster ensembles in the river and lake takes place whereas in winter it is broken. The cluster distribution in the surface layer of the lake that is excited by waves (ripple), and in the river are similarly but very different from that one in the lake at a depth of 1 m. Consequently, temperature and mechanical agitation of the water structure affect its long-range order.
4. Conclusions
White gravitation noises permeating the Earth, have an organizing influence on the molecular structure of natural waters. Destabilizing factors are energy flows from the Sun and forced movements of water. The long-range order in natural waters is constant in small clusters, but varies depending on the temperature at interaction of clusters with their surroundings. Celestial objects influence the stability of cluster ensembles in the lake; they can therefore affect its biocenosis by changing biochemical processes in which water clusters are involved. Natural water reservoirs are found to be applied as a new sensor for the analysis of events occurring in space.
References
| [1] | Online Available: http://www.lsbu.ac.uk/water/index.html |
| [2] | Zubow Kr. V., Zubow A.V., Zubow V.A. “Cluster structure of liquid alcohols, water and n-Hexane”, Springer Verlag, Journal of Applied Spectroscopy, vol. 72, no. 3, pp. 321-328, 2005. |
| [3] | Zubowa, K. V., Zubow, A. V., Zubow, V. A. “Oscillation spectra of seed NaCl crystals in aqueous solutions”, Springer Verlag, Journal of Applied Spectroscopy, vol. 72, no.6, pp. 840-847, 2005. |
| [4] | Zubow K., Zubow A.V., Zubow V.A. “Molecular Cluster Distribution in Sea Water Near the Wall. Antifouling aspect”, Springer Verlag, Journalof Cluster, vol. 22, no. 4, pp. 603-619, 2011. |
| [5] | Zubow K.V., Zubow A.V., Zubow V.A. “Ensemble of Clusters – New Form of Molecular Matter, Risks and Сhances. Zubow Equations”, in Advances in Chemistry Research, vol. 5, pp. 107-145, 2010. |
| [6] | Bogdanov E.V., Manturova G.M. “Equiclaster model of water”, Radioelektronika, Biomedicinskaja Radioelektronika, vol. 7, pp.19-28, 2000 (in Russian). |
| [7] | Zubow K., Zubow A.V., Zubow V.A. “Water Clusters in Plants. Fast Channel of Plant Communications. Planet Influence”, Science Research, Journal of Biophysics Chemistry, vol.1, no. 1, pp. 1-11, 2010. |
| [8] | Lenz A., Ojamäe L. “On the stability of dence versus cage-shaped water clusters: Quantum-chemical investigations of zero-point energies, free energies, basis-set effects and IR spectra of (H2O)12 and (H2O)20”, Elsevier, Chemical Physics Letters, vol. 418, pp. 361-367, 2006. |
 Abstract
 Reference
 Full-Text PDF
 Full-Text HTML