Physical Chemistry

2012;  2(2): 1-8

doi: 10.5923/j.pc.20120202.01

Surface Properties of Vitally Important Ions: Sessile Desiccated Drop Studies

Tatiana А. Yakhno

Department of Radio-Physical Methods in Medicine, Institute of Applied Physics RAS, Nizhny Novgorod, 603950, Russia

Correspondence to: Tatiana А. Yakhno , Department of Radio-Physical Methods in Medicine, Institute of Applied Physics RAS, Nizhny Novgorod, 603950, Russia.

Email:

Copyright © 2012 Scientific & Academic Publishing. All Rights Reserved.

Abstract

Surface properties of ions in a liquid media are the most important and interesting topic of physical-chemical research. Complex approaches with using a lot of modern equipment are used for study this problem. Here we demonstrate a distinctive method, which is based on self-organizing processes in sessile desiccative drops of water salt solutions. The features of crystallization of aqueous solutions of KCl, NaCl, CaCl2 and MgCl2, as well as of their mixtures drying in the form of drops (3 ul) on glass have been studied by optical microscopy and acoustic impedancemetry. “Dynamic portraits” of crystallization kinetics (KCl, NaCl and their mixture) or of saline condensation (CaCl2 and MgCl2) in the course of drop drying have been obtained for each sample. The phenomenon of drop fragmentation of a mixture of potassium-containing solutions of various chlorides and formation of individual 3D structures on the glass has been revealed. The mechanisms of formation of such structures associated with different surface activity of the studied ions are considered. It is demonstrated that the used approaches are promising for obtaining additional information about complex behavior of ions in aqueous media.

Keywords: Desiccated Drops, Self-Organization, Kinetics of Salt Crystallization, Pattern Formation, Acoustic Impedancemetry, Inorganic Chlorides

1. Introduction

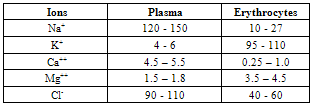
Potassium, natrium, calcium, magnesium and chlorine ions are vitally important electrolytes that are part of all living creatures on Earth. Their content, distribution and functions are different in the organism. For instance, Na+, Ca2+ and Cl- ions predominate in extracellular fluids, while K+ and Mg2+ ions are inside cells (Table 1)[1].
Table 1. Inorganic Component Distribution between Plasma and Erythrocytes (milliequivalent/l)
     
What physicochemical features of cations are responsible for this distribution? To disclose the mechanism of electrolyte impact on biological functions it is necessary to study their interaction with water, proteins and with each other in liquid media. This problem has been intensively studied and discussed for more than 120 years[2-12]. At the beginning of this paper, I would like to consider in breath some basic achievements, which are helpful for understanding water-ion-interface interactions during drying of sessile drops. This broad area includes ion-ion and ion-water interactions in bulk, and near hydrophilic and hydrophobic surfaces. Then, a “drop drying phenomenon” will be used for study surface preferences of vitally important chlorides by means of microscopic and acoustical impedansemetry methods.
An important milestone in water-ions-proteins interaction studies was the work by F. Hofmeister[2] who was the first to classify ions in order of their ability to salt out of proteins (Hofmeister series or lyotropic series). By an increasing ability to absorb from aqueous solutions and a decreasing ability to salt out and coagulate cations may be represented[13],[14] in the following order:
(1)
With a change in the solvent composition, hydrogen ion concentration or temperature, ion order in lyotropic series may change up to complete reversal[13].
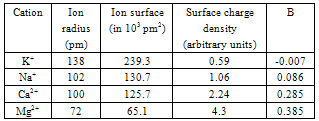
By the character of their interaction with water moleculesin aqueous solutions ions are usually classified into cosmotrops and chaotrops[7]. Small-size ions (cosmotrops) have higher surface charge density and bind hydrated water stronger than water molecules in a solution interact with each other. Consequently, they are referred to as pattern-forming ions. As compared to cosmotrops, chaotrops have larger size and smaller surface charge density. Electrostatic attraction between chaotropic ions and water dipoles in an aqueous medium is less than between water molecules. Therefore they are called destructors of intrinsic water structure. B coefficient (Jones-Dole viscosity coefficient[4]) is the measure of ion-water interaction. This coefficient is positive in cosmotropic ions and negative in chaotropic ones (Table 2).
Table 2. Parameters of Saline Cations Used in the Experiment (by data of the work[7])
     
В coefficient for a chlorine ion, like for a potassium ion, is -0.007[7]. Thus, both these ions are weak chaotrops. Natrium is a weak cosmotrop, whereas calcium and magnesium are strong cosmotrops. High density of magnesium cation surface charges leads to partial ionization of water molecules and to subsequent partial covalence of cation interaction with water medium[7]. This results in a decrease of charge density on the surface of magnesium in the Mg[H2O]62+ complex down to 1.18[15].
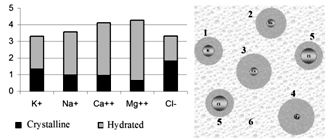
According to the electrostatic model[3], the electric field produced by an ion charge propagates long distances, attracting the surrounding water molecules. Therefore the size of hydrated ions greatly differs from that of crystalline ions (Fig. 1)[5],[16].
Figure 1. The size (1x10⁻¹⁰ m) of crystalline and hydrated ions (left) and their size distribution in water (right). 1 – K+, 2 - Na+, 3 – Ca2+, 4 – Mg2+, 5 - Cl-, 6 bulk water (the diagram is based on the data presented in the work[16]).
It is worthy of notice that, according to the data of neutron and X-ray scattering[6], as well as of gel-chromatography[8], univalent ions attract only one layer of hydrated water molecules, and bivalent ions two layers. Thus, existence of multilayer hydrated shells due to electrostatic attraction forces is doubted by some authors[10]. Of particular importance are studies of ion distribution in aqueous phase and their interaction with different surfaces, specifically with the surface at the water-air interface. This is usually done using photoelectric emission, vibrational sum-frequency spectroscopy, Raman and IR studies ([17-22] and literature therein). Detailed description of the state-of-the-art of these problems may be found in the review[23]. In addition to the experimental techniques, theoretical molecular dynamics simulations[24-27] are also broadly employed for obtaining information about ion distribution in liquids. Despite definite controversy in the data obtained using different methods, the majority of the researchers tend to believe that the water surface layer has a negative charge[23],[28]. Nevertheless, analysis of solvation energy[29], degree of polarizability and ion size[19],[20],[29] shows that halogen anions Cl-, Br- and I- have highest affinity to water surface, whereas alkali metals cations tend to avoid the surface layer by virtue of enthalpy.
For obtaining additional information about the interaction of ions with surfaces and with each other in a water medium, experiments with sessile saline drops drying on a wettable solid surface were carried out. The unique properties of a drop as a physical object were described by Ya.E. Geguzin[30]. The number of publications devoted to investigation, mathematical simulation, and practical applications of the “drying drop phenomenon” is increasing every year both in Russia and abroad[31-47]. More than 360 papers per year were published in 2010 and 2011. The number of citations approached to 4000 when “droplet evaporation” keyword was used to search the subject in expanded-SCI indexes[48]. As applied to the research problems specified above, the process of salt crystallization in desiccated sessile drops may be visualized. Crystallization kinetics may be also recorded and evaluated by means of acoustic impedancemetry[49-53]. The shape of a drop freely evaporating on a wettable substrate creates different thermodynamic conditions for the liquid in the central and periphery zones, as well as at the liquid-air and liquid-substrate interfaces. As a result, thermocapillary flows leading to centrally symmetric zonal distribution of liquid components according to their physicochemical properties (self- organization proсesses) arise in the drop[31-33]. These processes are well reproducible within the range of natural temperature, humidity and pressure fluctuations in laboratory conditions, which allows using them, in particular, for drying drops of biological liquids for medical diagnosis[46],[47],[53-55]. Dynamic processes accompanying drying of multicomponent liquid drops, such as aggregation, coacervation, flocculation, sedimentation, and crystallization are critical to the composition and structure of liquid[49-53].
The goal of the work was investigation of informativity of the drying drop model for determining preferred interaction of vitally important chlorides with water and with phase interfaces, as well as of crystallization kinetics of these salts from two- and multicomponent saline solutions.

2. Materials and Methods

KCl and NaCl chemically pure salts (Reaktiv, Inc., Russia), as well as CaCl2 x 6H2O and MgCl2 x 6H2O salts were used in the experiments. A 3% (w) solution of each salt was prepared with deionized water. At least a day before the experiment the prepared saline solutions were mixed in different combinations in a 1:1 ratio by volume, agitated thoroughly, and kept in closed test tubes. During the experiment the mixtures were agitated by turning the tube upside-down; then drops of mixture (3 ul each) were placed by a micropipet on clean degreased glass slides, 6 to 8 drops on one slide, and were left to dry in a horizontal position under laboratory conditions (Т = 19-21℃, Н = 67-70%.). The dried saline drops were studied by the MBC-10 microscope on the day of the experiment. Microphotographs were taken by a digital camera “Cannon” with х 28 microscope magnification.
Another part of the same solutions was investigated on a device that allows recording dynamics of phase transitions in drying drops by means of acoustic impedancemetry. Detailed description of the method and the device is given in[49-53]. The method is based on registering complex electrical conductivity of a quartz resonator loaded with a 3 ul drop of liquid under consideration in the regime of shear waves (Fig. 2).
Figure 2. Block-diagram of the device: 1 liquid drop; 2 quartz resonator; 3 generator; 4 bridge circuit; 5 - amplitude detector; 6 - ADC; 7 PC; 8 - signal map program; 9 - signal processing program.
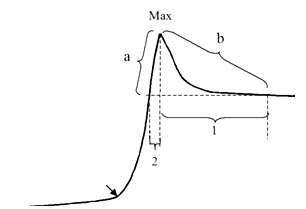
Figure 3. Schematic of AMI curve of phase transition stages in a drying saline drop (AMI vs. time). The arrow denotes beginning of crystallization (crystal deposition on sensor surface). Мах – completion of crystallization. The sloping down part of the curve (b) depicts decreasing drop mass in the course of evaporation of remaining water. SI-3 was calculated by total derivative of section «a», length of section 2, Max value, and steady-state level; SI-6 was calculated by total derivative of section «b», length of section 1, Max value, and steady-state level.
The resonator vibration frequency during measurements is sustained at a resonance frequency (60 kHz) of unloaded resonator. During measurements the signal is automatically recalculated to acoustomechanical impedance (AMI) and the result is displayed in real time in the form of a curve. AMI includes integrally physical characteristics of the object, such as viscosity, elasticity, friction, and mass with different degree of adhesion to the substrate[52-54]. As the drop is drying, the solution viscosity increase, which is indicated by a smooth increase of the AMI signal level during the first minutes of recording (Fig. 3). Initiation of crystallization wave is accompanied by a sharper signal enhancement caused by the crystal mass growing on the surface of the sensor, which is confirmed by parallel visual observation. The growth rate may be described by the total derivative of the corresponding portion of the curve. The maximum point of the curve denotes completion of crystallization, and the subsequent dip of the curve to the steady-state level designates evaporation of remaining water. Thus, kinetics of salt crystallization from a drying drop of solution may be assessed quantitatively. The shape of the AMI curve may be parametrized by calculating Shape Indices (SIs) and represented on the plane of features as a definite number.
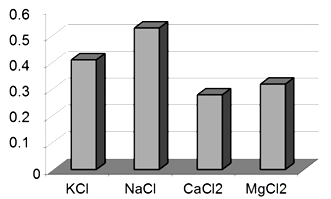
Under identical experimental conditions, this parameter may also be used for quantitative comparison of crystallization dynamics in different salt solutions. Sis and statistical indices were calculated automatically by means of software. This allowed quantitative comparison of dynamic processes during drying of drops of various liquids. AMI curves of the compared liquids were obtained on the same day. Each salt solution was investigated at least 10 times during the experiment. Total 4 experimental runs were made. The used approach implies comparison of kinetics of salt crystallization from aqueous solutions, given equality of their weight concentrations. Molar concentrations of the used saline solutions are presented in Fig. 4.
Figure 4. Molar concentrations of 3%(w) salts used in the experiment.

3. Results and Discussions

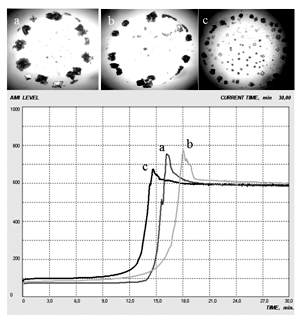
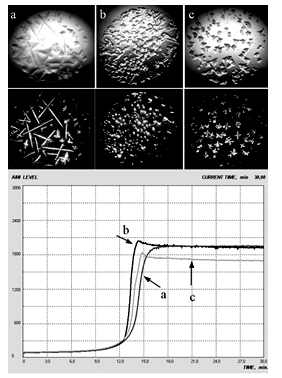
During drying of drops of KCl, NaCl solutions as well as drops of their mixture, despite some individual variations from drop to drop, we observed regular differences between them, both in topological arrangement of crystals on glass and in the AMI dynamics (Fig. 5). In pure KCl and NaCl solutions, for example, large crystals were arranged at the drop periphery, whereas in a mixed solution the central area of the drop was also filled with regularly ordered well-formed crystals.
Figure 5. Morphological and dynamic features of drying drop crystallization from 3% (w) solutions of KCl, NaCl and their 1:1 mixture: a – KCl, b – NaCl, c – KCl + NaCl. At the bottom: raw experimental curves in AMI reference frame (arbitrary units) vs. time (min).
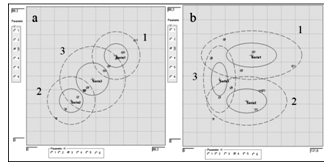
According to data of acoustic impedancementry, the highest rate of crystal formation during drop drying is for KCl solution, and the lowest for NaCl solution. Statistical differences in crystallization kinetics of KCl, NaCl solutions and their mixture are shown in Fig. 6 (a, b).
Figure 6. Statistical difference between crystallization kinetics of 3% (w) aqueous solutions of KCl, NaCl salts and their 1:1 mixture (v): a – SI-3 frame of reference; b – SI-3 reference frame vs. SI-6 (M±2σ). 1 - KCl, 2 - NaCl, 3 - KCl + NaCl.
Figure 7. Schematic representation of the beginning of saline drop drying. Formation of primary crystals and development of a centrifugal flow of capillary origin.
By this parameter the mixture of the above solutions has an intermediate position on the plane of features in the SIs frame of reference. These results agree with the Hofmeister series (1) in increasing ability of salts to adsorb from aqueous solutions. At the beginning of saline drop drying, evaporation occurs uniformly over all drop surface (Fig. 7). Microcrystals first deposit at the drop edge, as drying is faster here than in the center[31-33]. This results in formation of a centrifugal flow of capillary origin and most intense evaporation across the three-phase boundary, thus providing fast crystal growth at the drop periphery.
At the beginning of drying, free water is evaporated, resulting in insignificant increase of solution viscosity, which becomes apparent in a small initial increase of AMI signal (Fig. 5). Then, there arises a crystallization wave caused by loss of hydration water by ions and crystal deposition on the sensor. This period is accompanied by a sharp increase of the AMI signal, with the drop dome getting flat, and the area of its foundation remaining unchanged.
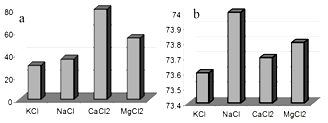
KCl is known to have a relatively smaller solubility under conditions close to those in our experiment (Fig. 8, а).
Figure 8. Physicochemical properties of salt solution: а – water solubility (g/100 g) at 20°С[45]; b – surface tension (1х10-3 N/m) at 18°С and salt concentration 5% (w)[57].
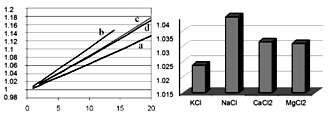
Therefore, during drying of a drop of KCl solution, crystallization starts and is over earlier than in the case of a NaCl drop of the same concentration (Fig. 5). In addition, KCl has smaller surface tension (Fig. 8, b) and lower density (Fig. 9).
Figure 9. Density of aqueous saline solutions versus concentration at 20° С[58]. Х – concentration (% w), Y – solution density relative to water density at 4° С. а - KCl, b - NaCl, c - CaCl2, d - MgCl2. On the right: Relative density 4% (w) of aqueous saline solutions at 20° С.
Hence, it is natural to suppose that, in compliance with their intrinsic chaotropic properties, in mixed NaCl and KCl solutions K+ cations along with Cl- anions are displaced from water medium to hydrophobic surface – water-air interface (Fig. 10) to form ion pairs there. If this hypothesis is correct, then the presence of large crystals in the center of dried drops of the mixture of KCl and NaCl solutions may be explained by the fact that KCl crystals originate and start to grow primarily in the surface layer of the drop at the interface with air at the early stage of drying. In this case, NaCl forms the majority of the crystals along the three-phase boundary.
Figure 10. Schematic representation of presumable ion arrangement in a sessile drop of a mixture of KCl and NaCl solutions: black spheres – K+; grey spheres – Cl-; empty spheres – Na+. See the explanation in the body of the text.
Drops of CaCl2 and MgCl2 saline solutions during drying in the experiment did not form crystals visible by eye. Free water evaporation led to gradual solution condensation and increase of AMI signal that was more pronounced in the MgCl2 solution (Fig. 11).
Figure 11. Morphological and dynamic features of crystallization of drying drops of 3% (w) solutions of CaCl2 and MgCl2: a – CaCl2, b – MgCl2. At the bottom: raw experimental curves in AMI reference frame (arbitrary units) vs. time (min).
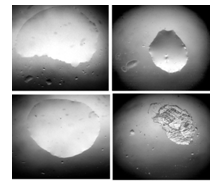
Figure 12. Drops of 3% (w) aqueous solutions of CaCl2 (upper row) and MgCl2 (lower row) a day after placing them on glass (left) and three weeks after (right): a – CaCl2, b – MgCl2.
This difference is evidently related to lower hygroscopicity of Mg2+ as compared to Ca2+, as a result of which the volume of water evaporating from MgCl2 solution and its final viscosity were higher than in the CaCl2 drop. This gave different final levels of AMI. Partial signal decrease at the end of the study of mgcl2 solution (Fig. 7, b) was associated with the beginning of diminution of the drop-substrate contact area. Sessile drops of CaCl2 and MgCl2 solutions on glass were in liquid phase for a long time. Three weeks after beginning of the experiment drops of MgCl2 solution crystallized, whereas drops of CaCl2 solution were still in liquid phase (Fig. 12).
Thus, the use of natural processes of drying drop self-organization as an instrument allowed revealing physicochemical features of the studied saline solutions, such as higher crystallization rate of KCl solution than of NaCl solution, and average value of this parameter for their mixture.
A qualitatively different arrangement of crystals in the dried drop of KCl and NaCl mixture suggests that in this case KCl crystals originate and develop at the interface with air. The experiments also confirmed higher hygroscopicity of CaCl2 solution as compared to MgCl2.
We further investigated different combinations of mixtures of 3% aqueous solutions in equal inclusion volume fractions. The results are presented in Fig. 13.
Figure 13. Morphological and dynamic features of crystallization of drying drops of coextensive 3% (w) solution mixtures: a – NaCl+CaCl2+MgCl2; b – KCl+CaCl2+MgCl2; c –KCl+NaCl+CaCl2+MgCl2. Upper row: photographs in reflected light; lower row: photographs in transmitted light with side illuminatioin. At the bottom: raw experimental curves in AMI reference frame (arbitrary units) / time (min).
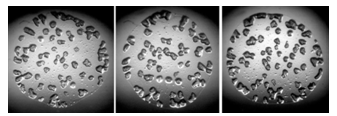
Outward appearance of the dried drops as well as AMI dynamics possessed characteristic features for each mixture. At the end of the experiment, drops containing NaCl+CaCl2+MgCl2 (Fig. 13, a) represented hygroscopic “pillows” with NaCl crystals in the form of crosses and “rapiers” on the surface. As crystallization took place on the drop surface, the hygroscopic substrate due to the presence of CaCl2 and MgCl2 damped mechanical action of crystals on sensor surface, and the AMI shape represented only solution condensation (analogously to Fig. 11). When NaCl in that solution was replaced by KCl (Fig. 13, b) the drop surface became hilly due to KCl crystals. The AMI curve acquired a peak typical of crystal deposition on quartz. However, a hygroscopic layer remained, only losing its continuity here and there. Addition of NaCl to this mixture resulted in drop fragmentation into individual “islets” between which a hygroscopic layer was not retained (Fig. 13, с). The upper part of each such “islet” was crystalline, and the lower was, evidently, a hygroscopic layer with bounded water. The AMI curve also had a saline peak, but the final value – steady state level – was less than in the other two mixtures due to larger water evaporation.
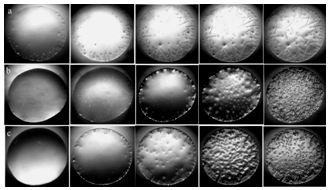
Microscopic study of the drying drop process (Fig. 14) gave additional information.
Figure 14. Drops of saline solutions in the course of drying: a – NaCl+CaCl2+MgCl2, b – KCl+CaCl2+MgCl2, c –KCl+NaCl+CaCl2+MgCl2.
For example, NaCl crystals (Fig. 14, a) started to grow at the three-phase boundary and proceeded on the surface of a hydrophilic “pillow” towards the drop center. This suggests that at least Na+ cations were not initially present on the surface of the drop; instead, they were gradually brought there by the ascending thermocapillary Marangoni flows[59-61]. When Na+ was replaced by K+ in the mixture, the crystallization process changed: after initial deposition of KCl along the three-phase boundary further crystallization of KCl proceeded simultaneously over the entire drop surface (Fig. 14, b). This indicated that K+ and Cl- ions were initially present on the surface, confirming the supposition made before. Early growth of KCl crystals on the surface of a drying drop changes mechanical properties of this layer, making it less elastic and more rigid. As water evaporation is accompanied by flattening of the drop dome and reduction of its area, mechanical stresses develop in the surface layer (at the air interface) that lead to drop fragmentation into “islets” in accordance with crystal position on its surface. Addition of Na+ to this mixture does not change the picture basically, but makes the “islets” more detached from each other (presumably, due to high surface tension of NaCl solution).
Twofold reduction of the concentration of CaCl2 and MgCl2 saline solutions with the same (3% w) concentration of KCl and NaCl solutions leads to formation of more ordered structures in the drying drops of the mixture of these solutions in equal volume ratios (Fig. 15).
Figure 15. Structurig of drops of a mixture of 3% (w) KCl and NaCl solutions and 1.5% (w) CaCl2 and MgCl2 solutions in equal volumes.
The presented approach may be used for creating microstructures with preset properties.

4. Conclusions

To conclude, the approach used in this work allows tracing the interaction of ions with water, with each other, and with the bounding surfaces during drying of drops of saline solutions and their mixtures on glass slides. A characteristic feature of the approach is that not only physicochemical properties of the salts affect the final drop structuring, but the features of the processes running in the drying drops play an important role too. This is a source of additional information. The sequence and kinetics of salt crystallization from solutions are the measure of integral interaction of ions with water and with each other. This parameter may be recorded and assessed quantitatively by means of acoustic impedancemetry. The obtained data suggest that in sessile drops of aqueous saline solutions on a solid wettable substrate ions are distributed according to their hydrophilic / hydrophobic properties: chaotropic ions (potassium, chlorine) are displaced to the boundary with air, while cosmotropic ions (calcium, magnesium) are located in bulk water. These properties may be observed in living organisms too in the interaction of ions with surfaces of different biological substrates. For instance, a change of protein conformation and the related enhancement of their hydrophobicity leads to changes in their affinity to biologically important ions and, hence, to functional changes, up to development of pathology. Alteration of the natural cation ratio in biological media, in turn, may also result in changes in protein conformation and in disturbance of harmony of physiological reactions. The apparent importance of these problems demands their thorough study. The author will believe that her mission is successful if the data presented in this paper give a new impetus to active investigation of surface phenomena using modern methods, including a drying drop.

ACKNOWLEDGEMENTS

The author highly appreciates the assistance of her colleagues A.G. Sanin and O.A. Sanina in carrying out the experiments, and is grateful to Dr. V.V. Matveev and Professor V. A. Kratasyuk for useful discussions.

References

[1]  A.Ya. Yaroshevsky (ed.), “The Physiology of Blood System”, Series “Handbook of Physiology”, Nauka: Leningrad, Russia, 1968[in Russian].
[2]  F. Hofmeister, “On the understanding of the effect of salts”, Second report, “On regularities in the precipitation effects of salts and their relationship to their physiological behavior”, Archiv Exp. Pathol. Pharmakol. (Leipzig), vol. XXIV, pp.247-60, 1887.
[3]  P. Debye, E. Hückel, “On the theory of electrolytes. 1. Freezing point depression and related phenomena”, Phys. Z., vol.24, pp.185-206, 1923.
[4]  G. Jones, M. Dole, “The viscosity of aqueous solutions of strong electrolytes with special reference to barium chloride”, J. Am. Chem. Soc., vol.51, pp.2950-2964, 1929.
[5]  E.R. Nightigale, “Phenomenological theory of ion solvatation. Effective radii of hydrated ions”. J. Phys. Chem., vol.3, no.5, pp.1381-1387, 1959.
[6]  N.T. Skipper, G.W. Neilson, “X-ray and neutron-diffraction studies on concentrated aqueous solutions of sodium-nitrate and silver-nitrate”, J. Phys. Condens. Matter., vol.1, pp.4141-4154, 1989,
[7]  K.D. Collins, “Charge density-dependent strength of hydration and biological structure”, Biophys. J., vol.72, pp.65-76, 1997.
[8]  M.Y. Kiriukhin, K.D. Collins, “Dynamic hydration numbers for biologically important ions”, Biophys. Chem., vol.99, pp.155-168, 2002.
[9]  W. Kunz, P. Lo Nostro, B.W. Ninham, “The present state of affairs with Hofmeister effects”. Curr. Opin. Colloid Interface Sci., vol.9, no.1-2, pp.1-18, 2004.
[10]  K.D. Collins, G.W. Neilson, J.E. Enderby, “Ions in water: Characterizing the forces that control chemical processes and biological structure”, Biophys. Chem., vol.128, pp.95-104, 2007.
[11]  Y. Kohno and H. Ohno, “Temperature-responsive ionic liquid / water interfaces: relation between hydrophilicity of ions and dynamic phase change”, Phys. Chem. Chem. Phys., vol. 14, pp.5063-5070, 2012.
[12]  F. Bruni, S. Imberti, R. Mancinelly and M.A. Ricci, “Aqueous solutions of divalent chlorides: ion hydration shell and water structure”, J. Chem. Phys., vol.136, pp. 064512 (7 pages), 2012.
[13]  J. E. Gordon, “The Organic Chemistry of Electrolyte Solutions”, Wiley: New York, USA, 1975.
[14]  I.B. Ivanov, R.I. Slavchov, E.S. Basheva, D. Sidzhakova, S.I. Karakashev, “Hofmeister effect on micellization, thin films and emulsion stability”, Adv. Colloid Interface Sci, vol.168, pp.93-104, 2011.
[15]  C.W. Bock, A. Kaufman, J.P. Glusker, “Coordination of water to magnesium cations”, Inorg. Chem., vol.33, pp.419-427, 1994.
[16]  Z.K. Blinnikova, K.V. Mayerle, M.P. Tsuryupa, V.A. Davankov, “Characteristic features of mineral salt separation by thе method of frontal exclusion chromatography on neutral nanoporous supercross-linked polystyrene”, Sorption and Cromatographic Processes, vol.9, no.3, pp.323-331, 2009[in Russian].
[17]  G. Archontis, E. Leontidis, G. Andreou, “Attraction of ions by the free water surface, revealed by simulations with a polarizable force field based on drude oscillators”, J. Phys. Chem. B, vol.109, pp.17957-17966, 2005.
[18]  M. Shibukawa, Y. Kondo, Y. Ogiyama, K. Osuga, Sh. Saito, “Interfacial water on hydrophobic surfaces recognized by ions and molecules”, Phys. Chem. Chem. Phys., vol 13, pp. 15925-15935, 2011.
[19]  P. Jungwirth, D.J. Tobias, “Specific ion effects at the air/water interface”, Chem. Rev., vol.106, pp.1259-1281, 2006.
[20]  P.B. Petersen, R.J. Saycally, “On the nature of ions at the liquid water surface”, Annu. Rev. Chem., vol.57, pp.333-64, 2006.
[21]  Y. Levin, “Polarizable ions at interfaces”, Phys. Rev. Lett., vol. 102, pp. 147803, 2009.
[22]  Y. Levin, A.P. dos Santos, A. Diehl, “Ions at the air-water interface: an end to the hundred-year-old mystery?”, Phys. Rev. Lett., vol. 103, pp. 257802, 2009.
[23]  M. Chaplin, “Theory and experiment: what is the surface charge of water?” Water, vol.1, pp.1-28, 2009.
[24]  R. Vaґcha, M.L. Berkowitz, P. Jungwirth, “Molecular model of a cell plasma membrane with an asymmetric multicomponent composition: Water permeation and ion effects”, Biophys. J., vol.96, pp.4493–4501, 2009.
[25]  L.Vrbka, J. Vondrasek, B. Jagoda-Cwiklik, R. Varcha, P. Jungwirth, “Quantification and rationalization of the higher affinity of sodium over potassium to protein surfaces”, PNAS, vol.103, no.42, pp.15440-15444, 2006.www.pnas.org_cgi_doi_10.1073_pnas.0606959103
[26]  C. Caleman, J. S. Hub, P. J. Van Maaren, D. Van der Spoel, “Atomistic simulation of ion solvation in water explains surface preference of halides”, PNAS, vol.108, pp.6838-6842, 2011. Www.pnas.org/cgi/doi/10.1073/pnas.1017903108
[27]  V. Buch, A. Milet, R. Varcha, P. Jungwirth, J.P. Devlin, “Water surface is acidic”, PNAS, vol.104, no.18, pp.7342-7347, 2007.www.pnas.org_cgi_doi_10.1073_pnas.0611285104
[28]  C. Colacicco, “Electrical potential of the water surface”, Chemica Scripta, vol.28, no.2, pp.141-144, 1988.
[29]  G. Lamoureux, R. Saycally, “Absolute hydration free energy scale for alkali and halide ions established from simulations with a polarizable force field”, J. Phys. Chem. B, vol.110, pp.3308-3322, 2006.
[30]  Ya.E. Geguzin, “The Drop”, Nauka: Moscow, Russia, 1973[in Russian].
[31]  R D. Deegan, O. Bakajin, T. F. Dupont, G. Huber, S.R. Nagel, T.A. Witten, “Contact line deposits in an evaporating drop”, Phys. Rev. E, vol.62, no.1, pp.756-765. 2000.
[32]  R. D. Deegan, “Pattern formation in drying drops”, Phys. Rev. E, vol.61, no.1, pp.475-485. 2000.
[33]  Yu. Popov, “Evaporative deposition patterns: Spatial dimensions of the deposit”, Phys. Rev. E, vol.71, pp.036313, 2005.
[34]  L. Pauchard, “Patterns caused by buckle-driven delamination in desiccated colloidal gels”, Europhys. Lett., vol.74, no.1, pp.188-192, 2006.
[35]  Yu. Yu. Tarasevich, I.V. Vodolazskaya and O. P. Isakova, “Desiccating colloidal sessile drop: dynamics of shape and concentration”, Colloid and Polymer Science, vol. 289, no 9, pp.1015-1023, 2011.
[36]  D. Sobac and D. Brutin, “Structural and evaporative evolutions in desiccating sessile drops of blood”, Phys. Rev. E., vol. 84, pp. 011603, 2011.
[37]  D. Sobac and D. Brutin, “Triple-line behavior and wettability controlled by nanocoated substrates: influence on sessile drop evaporation”, Langmiur, vol. 27, no 24, pp. 14999-15007, 2011.
[38]  D. Sobac and D. Brutin, “Thermocapillary instabilities in an evaporating drop deposited onto a heated substrate”, Phys. Fluids, vol. 24, pp. 032103, 2012.
[39]  T.A.H. Nguen, A.V. Nguen, M.A. Hampton, Z.P. Xu, L. Huang, V. Rudolf, “Theoretical and experimental analysis of droplet evaporation on solid surfaces”, Chemical Engineering Science, vol. 69, no 1, pp. 522-529, 2012.
[40]  Т.А. Yakhno, V.G. Yakhno, “Structural evolution of drying drops of biological fluids”, Technical Physics, vol.54, no.8, pp.1219-1227, 2009.
[41]  T. Yakhno, “Salt-induced protein phase transitions in drying drops”, J. Colloid Interface Sci., vol.318, pp.225-230, 2008.
[42]  V. Ragoonanan, A. Aksan, “Heterogenity in desiccated solutions: implications for biostabilization”, Biophys. J., vol.94, pp.2212-2227, 2008.
[43]  E.G. Rapis, “Regular structure formation of drying protein film”, Pis’ma v JTF, vol.14, no.17, pp.1560-1564, 1988[in Russian].
[44]  Yu. Yu. Tarasevich, A. K. Ayupova, “Effect of diffusion on the separation of components in a biological fluid upon wedge-shaped dehydration”, Technical Physics, vol.48, no.5, pp.535–540, 2003.
[45]  T. A. Yakhno, V. V. Kazakov, O. A. Sanina, A. G. Sanin, V. G. Yakhno, “Drops of biological fluids drying on a hard substrate: Variation of the morphology, weight, temperature, and mechanical properties”, Technical Physics, vol.55, no.7, pp.929-935, 2010.
[46]  L.V. Savina, “Crystalloscopic Structures of Blood Serum of a Healthy and Diseased Persons”, Sovetskaya Kuban: Krasnodar, Russia, 1999[in Russian].
[47]  V.N. Shabalin, S.N. Shatokhina, “Morphology of Biological Liquids of a Human”, Khrizostom: Moscow, Russia, 2001[in Russian].
[48]  H. Y. Erbil, “Evaporation of pure liquid sessile and spherical suspended drops: a review”, Advances in Colloid and Interface Science, vol. 170, pp. 67-86, 2012.
[49]  T.A. Yakhno, V.G. Yakhno, A.G. Sanin, I.I. Shmelev, “Study of the dynamics of phase transitions of liquids of different types by recording acoustomechanical impedance of a drying drop”. Biofizika, vol.47, no.6, pp.1101-1105, 2002[in Russian].
[50]  T.A. Yakhno, V.G. Yakhno, A.G. Sanin, O.A. Sanina, A.S. Pelyushenko, “Dynamics of phase transitions in drying drops as an information parameter of liquid structure”, Nonlinear Dynamics, vol.39, pp.369-374, 2005.
[51]  T. Yakhno, A. Sanin, A. Pelyushenko, V. Kazakov, O. Shaposhnikova, A. Chernov, V. Yakhno, C. Vacca, F. Falcone, B. Johnson, “Uncoated quartz resonator as a universal biosensor”, Biosensors & Bioelectronics, vol.22, no.9-10, pp.2127-2131, 2007.
[52]  T. A. Yakhno, A. G. Sanin, C. V. Vacca, F. Falcione, O. A. Sanina, V. V. Kazakov, V. G. Yakhno, “A New Technology for Studying Multicomponent Liquids Using a Quartz Crystal Resonator: Theory and Applications”, Technical Physics, vol.54, no.10, pp.1423–1430, 2009.
[53]  T. Yakhno, A. Sanin, V. Kazakov, O. Sanina, C. Vacca, F. Falcione, V. Yakhno, “Uncoated quartz resonator as a universal biosensor”, Chapter in a book: “Intelligent and Biosensors”, Vernon, S. (ed.) Somerset: INTECH, Austria, pp.386-404, 2010.Http://www.sciyo.com/articles/show/title/uncoated-quartz-resonator-as-a-universal-biosensor
[54]  T. Yakhno, “Blood as a Polydisperse System”, Lambert Academic Publishing gmbh & Co. KG, Saarbrucken, Germany, 2011.
[55]  T.A.Yakhno, V.V. Kazakov, A.G. Sanin, O.B. Shaposhnikova, A.S. Chernov, “Dynamics of phase transitions in drying drops of human serum protein solutions”, Technical Physics, vol.52, no.4, pp.515–520, 2007.
[56]  A.N. Kirgintsev, L.N. Trushnikova, V.G. Lavrentieva, “Water Solubility of Inorganic Substances”, Handboook, Chemistry: Leningrad, Russia, 1972[in Russian].
[57]  M.I. Gelfman, O.V. Kovalevich, V.P. Yustratov, Colloid Chemistry, 2nd edition; Lan: Moscow, Russia, 2004[in Russian].
[58]  I.K. Kikoin (ed), “Tables of Physical Quantities”, Atomizdat: Moscow, Russia, 1976[in Russian].
[59]  H. Hu, R.G. Larson, “Analysis of the Effects of Marangoni Stresses on the Microflow in an Evaporating Sessile Droplet”, Langmuir, vol.21, no. 9, pp.3972-3980, 2005.
[60]  W.D. Ristenpart, P.G. Kim, C. Domingues, J. Wan, H.A. Stone, “Influence of substrate conductivity on circulation reversal in evaporating drops”. Phys. Rev. Lett., vol.99, pp.234502, 2007.
[61]  R. Bhardwaj, X. Fang, D. Attinger, “Pattern formation during the evaporation of a colloidal nanoliter drop: a numerical and experimental study”, New J. Phys., vol.11, pp.075020, 2009.