Physical Chemistry

p-ISSN: 2167-7042    e-ISSN: 2167-7069

2012;  2(1): 6-11

doi: 10.5923/j.pc.20120201.02

Development and Validation of the Quantitative Analysis of Ceftazidime in Powder for Injection by Infrared Spectroscopy#

Andréia de Haro Moreno , Hérida Regina Nunes Salgado

Department of Drugs and Medicines, School of Pharmaceutical Sciences, University of São Paulo State, Araraquara, 14801-902, Brazil

Correspondence to: Hérida Regina Nunes Salgado , Department of Drugs and Medicines, School of Pharmaceutical Sciences, University of São Paulo State, Araraquara, 14801-902, Brazil.

Email:

Copyright © 2012 Scientific & Academic Publishing. All Rights Reserved.

Abstract

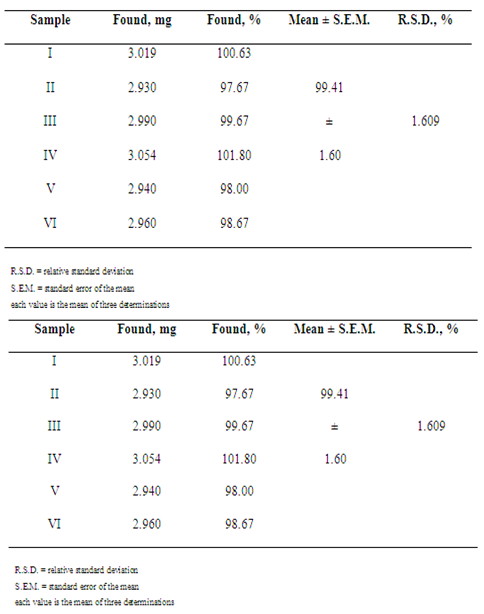
Ceftazidime quantification by the infrared spectroscopy was developed and validated for pharmaceutical preparations in powder for injection. This method involved absorbance measurements of the band corresponding to aromatic ring centered by 1475-1600 cm-1. Selectivity, linearity, precision and accuracy were determined in order to validate the proposed method. It was also found that the excipient did not interfere with the assay. Calibration curve was obtained for ceftazidime at 0.5 to 7.0 mg, and mean recovery percentage was 98.98 ± 0.70. The proposed method was successfully applied to the assay of ceftazidime in powder for injection.

Keywords: Ceftazidime, Infrared, Spectroscopy, Quantitative, Determination

Cite this paper: Andréia de Haro Moreno , Hérida Regina Nunes Salgado , "Development and Validation of the Quantitative Analysis of Ceftazidime in Powder for Injection by Infrared Spectroscopy#", Physical Chemistry, Vol. 2 No. 1, 2012, pp. 6-11. doi: 10.5923/j.pc.20120201.02.

1. Introduction

Ceftazidime (Fig. 1) is a third-generation cephalosporin that is widely used for the treatment of serious infections caused by Gram-negative bacteria, including Pseudomonas aeruginosa. They include biliary-tract infections, bone and joint infections, cystic fibrosis (respiratory-tract infections), endophthalmitis, infections in immunocompromised patients (neutropenic patients), meningitis, peritonitis, pneumonia, septicaemia, skin infections (including burns, ulceration) and urinary-tract infections[1-13].
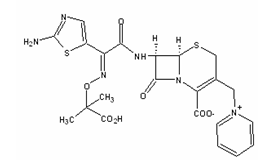
Figure 1. Chemical structure of ceftazidime – C22H22N6O7S2 (mw 546.58)
Ceftazidime is administrated by slow intravenous infusion over 24 hours. The infusion solutions are prepared in advance and stored in the pharmacy[11,14].
Several analytical procedures are available in the literature for the analysis of cephalosporins. These methods included spectrophotometry[15-24], high performance liquid chromatography[2,9,25-29], capillary eletrophoresis[30], fluorimetry[31-35], polarography[36-40] and titrimetry[41].
Infrared spectroscopy is an important technique used for the characterization of very complex mixtures. The portion of the infrared region most useful for analysis of organic compounds is that having a wavelength range from 2500 to 16000 nm[42].
Infrared spectroscopy exploits the fact that molecules have specific frequencies at which they rotate or vibrate corresponding to discrete energy levels (vibrational modes). These resonant frequencies are determined by the shape of the molecular potential energy surfaces, the masses of the atoms and by the associated vibronic coupling. In order to a vibrational mode in a molecule to be infrared active, it must be associated with changes in the permanent dipole. Nevertheless, resonant frequencies can be in a first approach related to the strength of the bond, and the mass of the atoms at either end of it. Thus, the frequency of vibrations can be associated with a particular bond type[43].
Infrared spectrum of a sample may be obtained by passing a beam of infrared light through the sample. Examination of the transmitted light reveals how much energy was absorbed at each wavelength. This can be done with a monochromatic beam, which changes in wavelength over time, or by using a Fourier transform instrument to measure all wavelengths at once. From this, a transmittance or absorbance spectrum can be produced, showing at which infrared wavelengths the sample absorbs. Analysis of these absorption characteristics reveals details about the molecular structure of the sample[44].
Infrared spectroscopy is widely used in both research and industry as a simple and reliable technique for measurement, quality control and dynamic measurement. It is especially used to forensic analysis in both criminal and civil cases and has been highly successfully for applications in both organic and inorganic chemistry[45].
Although the infrared spectroscopy is officially accepted to identification of several compounds, the literature shows few publications that employ this method for the quantitative analysis[46].
Recently, Moreno and Salgado published four methods for the analysis of ceftazidime in powder for injection: microbiological assay[47], high performance liquid chromatography[48] and spectrophotometry[49,50]. Therefore, the aim of this study was developed and validated a new and unpublished infrared spectroscopic method for quantitative determination of ceftazidime in powder for injection.].

2. Material and Methods

2.1. Chemicals

Ceftazidime reference substance (assigned purity 99.98%) and ceftazidime powder for injection were kindly supplied by Ariston Química e Farmacêutica Ltda. (São Paulo, Brazil). Ceftazidime powder for injection (Ceftazidon) was claimed to contain 1000 mg (as anhydrous base) of the drug and 118 mg of anhydrous sodium carbonate as excipient (solubilizer).
Potassium bromide (Merck, Darmstadt, Germany) used to the preparation of translucent pellets was of analytical grade and was previously dried at 120ºC for 2 h.

2.2. Instrumentation and Analytical Conditions

2.2.1. Equipment
A conventional SHIMADZU IR Spectrometer Model FTIR 8300 (Tokyo, JP) with spectral digitalization was used for obtaining data and respective absorption regions (wavelength region of 500-4000 cm-1 at 2 cm-1 intervals).
2.2.2. Obtaining of Analytical Curve
Translucent pellets were prepared by dilution of ceftazidime reference substance in potassium bromide to obtain 250 mg of total weight. Amounts of 0.5, 1.0, 2.0, 5.0 and 7.0 mg of ceftazidime reference substance (previously diluted with potassium bromide 1:10, w/w) were prepared using sufficient amount of potassium bromide to obtain 250 mg. Powders were mixed and ground until the obtaining an homogeneous powder; so, this powder mixture was crushed in a mechanical die press to form translucent pellets through which the beam of the spectrometer can pass.
2.2.3. Sample Preparation
Twenty flasks containing ceftazidime powder for injection were weighed and the average weight was determined. An amount of powder equivalent to 300 mg of ceftazidime was mixed and ground with potassium bromide for the obtaining the homogeneous powder (1:10, w/w dilution). Dilutions with potassium bromide were made to give final concentrations of 3.0 mg in each translucent pellet. This dilution procedure was performed in triplicate. Lectures were made at wavelength region of 500-4000 cm-1 and the absorbance measurements were monitored at 1475-1600 cm-1 region, that corresponding to the aromatic ring absorption region of the molecule.
2.2.4. Sample Preparation
Sample concentrations (mg) were calculated by following: CS =[AS x CRS] / ARS, where CS is the sample concentration (mg), CRS is the reference substance concentration (mg), AS is the sample absorbance measurement and ARS is the reference substance absorbance measurement.
2.2.5. Method Validation
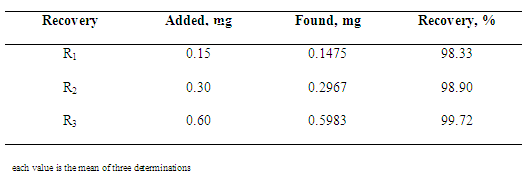
The developed method was validated by the following parameters: linearity, precision and accuracy as per ICH Guidelines[51] and AOAC[52].
a) Linearity: To assays linearity of the method, doses of reference substance were evaluated on 3 different days. Regression lines were calculated by the least-squares method. Statistical evaluation was made by ANOVA. For the infrared spectrometric method, linearity was verified by analysis of 5 points at concentration range 0.5-7.0 mg.
b) Precision: Repeatability (intraday) and intermediate precision (inter-day) were evaluated by the assay of 6 independent samples in a day, under the same experimental condition (standard and sample preparation as described above). Results obtained on 3 different days were compared.
c) Accuracy: This parameter was determined by the recovery study, comparing theoretical and measured concentrations of ceftazidime reference substance added at the beginning of the process. Translucent pellets were prepared at concentration 3.0 mg in each pellet. Amounts of 30.0 mg of ceftazidime sample dilution (1:10, w/w) in potassium bromide and amounts of 15.0, 30.0 and 60.0 mg of ceftazidime reference substance, previously diluted in potassium bromide (1:100, w/w), corresponding to 150, 300 and 600 µg of ceftazidime, respectively, were weighed, mixed and ground with sufficient amount of potassium bromide for the obtaining the homogeneous powder (250 mg each pellet), giving final concentrations of 3.15, 3.30 and 3.60 mg in each pellet, respectively, which correspond to 105, 110 and 120% (R1, R2 and R3) of nominal analytical concentration. Each level was made in triplicate.
Recovery percentage of ceftazidime added was calculated using the equation proposed by AOAC[52].

3. Results and Discussion

Quality control is very important to guarantee the safety and the effectiveness of pharmaceuticals. In order to control the production line as best as possible and to increase the productivity a lot of samples were drawn and analysed in certain intervals. But still the test procedure solely rely on random testing, because it was up to now the only way to assure the quality of the millions of products produced in a day. Clusters of products, faulty in constituents, concentration or humidity, caused by momentary production problems could not always be detected[53].
Near-infrared spectroscopy is a widely recognized technique for identification and verification of compounds. It is non-contact, non-destructive and no sample preparation is required[54]. This technique has been used to identify several compounds, such as pharmaceuticals, cosmetics and foods, but requires expensive equipments and mathematical pre-treatments[54, 55, 56]. So, the aim of this study was developed an infrared spectrometric method for the determination of ceftazidime in powder for injection.
Infrared spectra obtained presented characteristic absorption bands of cephalosporin compounds, such as 3660-3250 cm-1 (N-H group axial deformation), 1750-1725 cm-1 (carboxylic acid function C=O stretching), 1475-1600 cm-1 (aromatic ring C=C axial deformation), 1350-1300 cm-1 (C-N axial deformation) and 1680-1630 cm-1 (amide group C=O axial deformation), according to Figure 2.
Spectra showed characteristic absorption bands and absorbance measurements of them; so, it was possible to verify the linear relationship between ceftazidime concentrations and absorbance measurements when different amounts of the drug were used to prepare the translucent pellets. Spectra were analysed and compared to that obtained of ceftazidime reference substance for identify the sample. Absorption bands of aromatic ring were chosen for absorbance monitoring because those absorption bands did not occur in excipient present in pharmaceutical preparations (anhydrous sodium carbonate or arginine).
Infrared spectroscopic method presented many advantages when compared to both UV/Vis spectrophotometric methods: there wasn’t necessary to realize extraction stages, which reduced time analysis and costs with filter equipments and membranes. Besides, drugs presenting solubility problems with more appropriate solvent could be prepared in powder form (generally, potassium bromide) for obtaining the pellets. Time procedure was also smaller than that solutions preparation.
Excipients present in pharmaceutical preparation (powder for injection) did not interfere with the results obtained because those do not present specific absorption bands used to identify and quantify the analysed drug.
Despite being only moderately selective, infrared spectroscopic method was a very robust, easy and inexpensive method when compared to other instrumental methods, offering good precision in quantitative analysis.
Calibration curve of ceftazidime was obtained by plotting absorbance measurements against drug concentration. The curve was linear at range 0.5-7.0 mg, with a regression coefficient of 0.9998 and a linear regression equation of y = 0.1717x + 0.2129 (Figure 3).
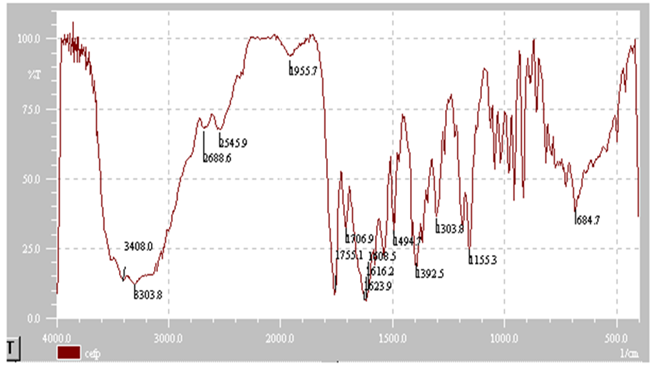
Figure 2. Infrared spectrum for ceftazidime reference substance
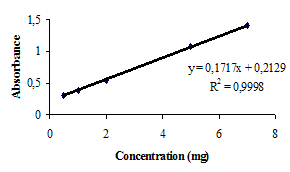
Figure 3. Calibration curve for ceftazidime by infrared spectroscopic proposed method
Results obtained through the infrared spectroscopic method for ceftazidime powder for injection are displayed in Table 1, which shows mean, e.p.m. and R.S.D. values. Quantities of the drug found were in accordance with the values claimed by the manufacturer (99.41%), indicating the applicability of the proposed method to pharmaceutical analysis. This method showed good precision, with R.S.D. value found to be less than 2% (1.61%). There was no evidence of interference from the excipient (anhydrous sodium carbonate).
Table 1. Experimental values obtained for the determination of ceftazidime by the infrared spectroscopic proposed method
     
Accuracy may be expressed as percent recovery by the assay of known added amounts of analyte[51-52]. Results obtained from recovery test of ceftazidime are shown in Table 2. The mean absolute recovery test was found to be 98.98%, indicating a good accuracy and the agreement with spiked amount of reference substance.
Table 2. Experimental values obtained in the recovery test for ceftazidime by infrared spectroscopic proposed method
     

3. Conclusions

Ceftazidime quantification in powder for injection by the infrared spectroscopic method demonstrated good linearity, precision and accuracy at concentrations ranging from 0.5 to 7.0 mg. The present investigation showed that infrared analysis could be also employed for quantitative determination of ceftazidime in pharmaceutical preparations, with possible application for quantification of other drugs. Therefore, it was an acceptable alternative method for the routine quality control of ceftazidime in raw material and pharmaceuticals. The proposed method used simple reagents, with minimum sample preparation procedures, encouraging its application in routine analysis.

ACKNOWLEDGEMENTS

Authors thank Ariston Química e Farmacêutica Ltda. (São Paulo, Brasil) for providing ceftazidime reference substance and ceftazidime powder for injection. This work was supported by PACD-FCFAr-UNESP-Brazil, FUNDUNESPBrazil, FAPESP-Brazil and CNPq-Brazil.

References

[1]  J.G. Hardman and L.E. Limbird, The Pharmacological Basis of Therapeutics, New York, NY: McGraw-Hill Book Co., 2006
[2]  Baskaran, N.D., Gan, G.G., Adeeba, K., Sam, I.C., 2007, Bacteremia in patients with febrile neutropenia after chemotherapy at a university medical center in Malaysia, Int. J. Infect. Dis., 23, 115-121
[3]  Cavallo, J.D., Hocquet, D., Plesiat, P., Fabre, R., Roussel-Delvallez, M., 2007, Susceptibility of Pseudomonas aeruginosa to antimicrobials: a 2004 French multicentre hospital study, J. Antimicrob. Agents Chemother., 59, 1021-1024
[4]  Claridge, J.A., Edwards, N.M., Swanson, J., Fabian, T.C., Weinberg, J.A., Wood, C., Croce, M.A., 2007, Aerosolized ceftazidime prophylaxis against ventilator-associated pneumonia in high-risk trauma patients: results of a double-blind randomized study, Surg. Infect. (Larchmt), 8, 83-90
[5]  Eagye, K.J., Kuti, J.L., Nicolau, D.P., 2007, Evaluating empiric treatment options for secondary peritonitis using pharmacodynamic profiling, Surg. Infect. (Larchmt), 8, 215-226
[6]  Martin, M.G., 2007, Encephalopathy with myoclonic jerks resulting from ceftazidime therapy: an under-recognized potential side-effect when treating febrile neutropenia, Leuk. Lymphoma, 48, 413-414
[7]  Raja, N.S., 2007, Antimicrobial susceptibility pattern of clinical isolates of Pseudomonas aeruginosa in a tertiary care hospital, J. Microbiol. Immunol. Infect., 40, 178-82
[8]  Rodenas, V., Garcia, M.S., Sanchez-Pedreno, C., Albero, M.I., 1997, Spectrophotometric methods for the determination of cephradine or ceftazidime in human urine using batch and flow-injection procedures, J. Pharm. Biomed. Anal., 15, 1687-1693.
[9]  Adamis, G., Papaioannou, M.G., Giamarellos-Bourboulis, E.J., Gargalianos, P., Kosmidis, J., Giamarellou, H., 2004, Pharmacokinetic interactions of ceftazidime, imiprenem and aztreonam with amikacin in healthy volunteers, Int. J. Antimicrob. Agents, 23, 144-149
[10]  A.R. Gennaro, Remington: The Science And Practice of Pharmacy, 20th ed., Rio de Janeiro, Brazil: Guanabara Koogan, 2004
[11]  Martindale, The Complete Drug Reference, London, England: Pharmaceutical Press, 2005
[12]  Myers, C.M., and Blumer, J.L., 1983, Determination of ceftazidime in biological fluids by using high-pressure liquid chromatography, Antimicrob. Agents Chemother., 24, 343-346
[13]  Arséne, M., Favetta, P., Favier, B., Bureau, J., 2002, Comparison of ceftazidime degradation in glass bottles and plastic bags under various conditions, J. Clin. Pharm.Therap., 27, 205-209
[14]  A. Korolkovas, Dicionário Terapêutico Guanabara, Rio de Janeiro, Brazil: Guanabara Koogan, 2000
[15]  Abdel-Khalek, M.M., and Mahrous, M.S., 1984, Use of ammonium molybdate in the colorimetric assay of cephalosporins, Talanta, 31, 635-637
[16]  Navarro, P.G., and Las Parras, P.M., 1991, Reaction of sodium amoxicillin with Cu(II) ion in a methanolic medium, J. Pharm. Sci., 80, 904-907
[17]  Zuhri, A.Z.A., Rady, A.H., El-Shahawi, M.S., Al-Dhaheri, S., 1994, Spectrophotometric determination of ampicillin by ternary complex formation with 1,10-phenantroline and copper(II), Microchem. J., 50, 111-115
[18]  Ayad, M.M., Shalaby, A.A., Abdellatef, H.E., Elsaid, H.M., 1999, Spectrophotometric determination of certain cephalosporins through oxidation with cerium (IV) and 1-chlorobenzotriazole, J. Pharm. Biomed. Anal., 20, 557-564
[19]  Al-Momani, I.F., 2001, Spectrophotometric determination of selected cephalosporins in drug formulations using flow injection analysis, J. Pharm. Biomed. Anal., 25, 751-757
[20]  Mohamed, G.G., 2001, Spectrophotometric determination of ampicillin, dicluxacillin, flucoxacillin and amoxicillin antibiotic drugs: ion-pair formation with molybdenum and thiocyanate, J. Pharm. Biomed. Anal., 24, 561-567
[21]  Martinez, L.G., Falco, P.C., Cabeza, A.S., 2002, Comparison of several methods used for the determination of cephalosporins. Analysis of cephalexin in pharmaceutical samples, J. Pharm. Biomed. Anal., 29, 405-423
[22]  Salem, H., and Askal, H., 2002, Colourimetric and AAS determination of cephalosporins using Reineck’s salt, J. Pharm. Biomed. Anal., 29, 347-354
[23]  El-Mammly, M.Y., 2003, Spectrophotometric determination of flucoxacillin in pharmaceutical preparations some nitrophenols as a complexing agent, Spectrochim. Acta, 59, 771-776
[24]  Amin, A.S., and Ragab, G.H., 2004, Spectrophotometric determination of certain cephalosporins in pure form and in pharmaceutical formulations, Spectrochim. Acta, 60, 2831-2835
[25]  Nascimento, J.W.L., Omosako, C.E., Carmona, M.J., Auler Junior, J.O., Santos, S.R.C.J., 2003, Micrométodo para quantificação de cefuroxima em plasma através da cromatografia líquida de alta eficiência. Aplicação na profilaxia de pacientes submetidos à cirurgia cardíaca. Br. J. Pharm. Sci., 39, 265-272
[26]  Joshi, S., 2002, HPLC separation of antibiotics present in formulated and unformulated samples, J. Pharm. Biomed. Anal., 28, 795-809
[27]  Samanidou, V.F., Hapeshi, E.A., Papadoyannis, I.N., 2003, Rapid and sensitive high-performance liquid chromatographic determination of four cephalosporins antibiotics in pharmaceuticals and body fluids, J. Chromatogr. B, 788, 147-158
[28]  Zajac, M., Jelinska, A., Dobrowolski, L., Oszczapowicz, I., 2003, Evaluation of stability of cefuroxime in solid state, J. Pharm. Biomed. Anal., 32, 1181-1187
[29]  Zivanovic, L., Ivanovic, I., Vladimirov, S., Zecevic, M., 2004, Investigation of chromatographic conditions for the separation of cefuroxime axetil and its geometric isomer, J. Chromatogr. B, 800, 175-179
[30]  Castaneda, P.G., Julien, E., Fabra, H., 1996, Cross validation of capillary electrophoresis and high-performance liquid chromatography for cefotaxime and related impurities, J. Chromatogr., 42, 159-164
[31]  Fabre, H., Blanchin, M.D., Lerner, D., Mandrou, B., 1985, Determination of cephalosporins utilizing thin-layer chromatography with fluorescence detection, Analyst, 110, 775
[32]  Korany, M.A., El-Sayed, H.M.A., Galal, S.M., 1989, The applications of a new chromogenic and fluorescent reagent for cobalt(II), Anal. Lett., 22, 619-622
[33]  Farrell, C.D., Rowell, F.J., Cumming, R.H., rapid fluorescence ELISA for ceftazidime, Anal. Proc., 32, 205-206
[34]  Aly, F.A., Hefnawy, M.M., Belal, F., selective spectro-fluorimetric method for the determination of cephalosporins in biological fluids, Anal. Lett., 29, 1
[35]  Yang, J.H., Zhou, G.J., Jie, N.Q., Han, R.J., Lin, C.G., Hu, J.T., 1996, Simultaneous determination of cephalexin and cephadroxil by using the coupling technique of synchronous fluorimetry and H-point standard additions method, Anal. Chim. Acta, 325, 195-200
[36]  Sengun, F.I., Ulas, K., Fedai, I., 1985, Analytical investigations of cephalosporins-II. Polarographic behaviour of ceftriaxone, cefuroxime, cefotaxime and ceftizoxime and assay of their formulations, J. Pharm. Biomed. Anal., 3, 191-199
[37]  Altinoz, S., Ozer, D., Temizer, A., Yuksel, N., 1994, Determination of ceftriaxone in aqueous humour and serum samples by differential-pulse adsorptive stripping voltametry, Analyst, 119, 1575-1577
[38]  El-Maali, N.A., Ali, A.M.M., Ghandour, M.A., 1994, Square-wave voltametric determination of cefoperazone in a bacterial culture, pharmaceutical drug, milk and urine, Electroanalysis, 52, 599-604
[39]  Reddy, G.V.S., and Reddy, S.J., 1997, Estimation of cephalosporin antibiotics by differential pulse polarography, Talanta, 44, 627-631
[40]  Ozkan, S.A., Erk, N., Uslu, B., Ylmaz, N., Biryol, I., 2000, Study on electrooxidation of cephadroxil monohydrate and its determination by differential pulse voltametry, J. Pharm. Biomed. Anal., 23, 263-273
[41]  Fogg, A.G., Abadía, M.A., Henriques, H.P., 1982, Titrimetric determination of the yield of sulphide formed by alkaline degradation of cephalosporins, Analyst, 107, 449
[42]  L. Ohannesian and A.J. Streeter, Handbook of Pharmaceutical Analysis, New York, NY: Marcel Dekker, 2002
[43]  D. Harris, Análise Química Quantitativa, Rio de Janeiro, Brazil: LTC Livros Técnicos e Científicos, 2001
[44]  G.H. Jeffrey, J. Basset, J. Mendham, R.C. Denney, Vogel: Análise Química Quantitativa, Rio de Janeiro, Brazil: LTC Livros Técnicos e Científicos, 1992
[45]  J.A. Barnard and R. Chayen, Metodos Modernos de Analisis Quimico, Bilbao, Spanish: Bilbao, 1970
[46]  Matkovic, S.R., Valle, G.M., Galle, M., Briand, L.E., 2001, Desarollo y validación del análisis cuantitativo de ibuprofeno en comprimidos por espectroscopia infrarroja, Acta Farm. Bonaerense, 24, 561-567
[47]  Moreno, A.H., and Salgado, H.R.N., 2007, Microbiological assay for ceftazidime injection, J. AOAC Int., 90, 1379-1382
[48]  Moreno, A.H., and Salgado, H.R.N., 2008, Development of a new high-performance liquid chromatographic method for the determination of ceftazidime, J. AOAC Int., 91, 739-743
[49]  Moreno, A.H., and Salgado, H.R.N., 2008, Spectrophotometric determination of ceftazidime in pharmaceutical preparations using neocuproin as a complexing agent, Anal. Lett., 41, 2143-2152
[50]  Moreno, A.H., and Salgado, H.R.N., 2009, Rapid and selective UV spectrophotometric method for the analysis of ceftazidime, J. AOAC Int., 92, 820-824
[51]  Validation of analytical procedures: text and methodology Q2(R1)-ICH harmonized tripartite guideline, in: International Conference on Harmonization of Technical Requirements for Registration of Pharmaceuticals for Human Use, 2005
[52]  Official Methods of Analysis, 17th ed., Gaithersburg, MD: AOAC International, 2000
[53]  D.G. Watson, Pharmaceutical Analysis, London, England: Churchill Livingstone, 1999
[54]  Herkert, T., Prinz, H., Kovar, K.A., 2001, One hundred percent online identity check of pharmaceutical products by near-infrared spectroscopy on the packaging line, Eur. J. Pharm. Biopharm., 51, 9-16
[55]  Morgano, M.A., Faria, C.G., Ferrão, M.F., 2005,Determinação de proteína em café cru por espectroscopia NIR e regressão PLS, Ciênc. Tecnol. Aliment., 25, 25-31
[56]  Souza, J.S., and Ferrão, M.F., 2006, Aplicações da espectroscopia no infravermelho no controle de qualidade de medicamentos contendo diclofenaco de potássio. Parte I: Dosagem por regressão multivariada, Br. J. Pharm. Sci., 42, 437-445