-
Paper Information
- Paper Submission
-
Journal Information
- About This Journal
- Editorial Board
- Current Issue
- Archive
- Author Guidelines
- Contact Us
International Journal of Optics and Applications
p-ISSN: 2168-5053 e-ISSN: 2168-5061
2019; 8(2): 21-31
doi:10.5923/j.optics.20190802.01

Wideband Electromagnetic Wave Generation via Supercontinuum Formation in Infrared-Resonant Optical Microcavities
 Abstract
 Reference
 Full-Text PDF
 Full-text HTML
Özüm Emre Aşırım, Mustafa Kuzuoğlu
Department of Electrical and Electronics Engineering, Middle East Technical University, Ankara, Turkey
Correspondence to: Özüm Emre Aşırım, Department of Electrical and Electronics Engineering, Middle East Technical University, Ankara, Turkey.
| Email: |  |
Copyright © 2019 The Author(s). Published by Scientific & Academic Publishing.
This work is licensed under the Creative Commons Attribution International License (CC BY).
http://creativecommons.org/licenses/by/4.0/

High intensity wave generation is hard to achieve in certain frequency intervals such as the terahertz frequency range and the ultraviolet frequency range. In this paper we present a numerical study for ultra-wideband spectral broadening (supercontinuum formation) and wideband electromagnetic wave generation in a small infrared-resonant optical microcavity. It was observed that at a given intracavity intensity, spectral broadening occurs profoundly near the resonance frequency of the cavity material, and the broadening effect drastically weakens when the excitation frequency is away from the resonance frequency. A numerical example is presented for an intense, near resonance, infra-red frequency excitation, and the resulting spectral broadening is investigated in the terahertz-ultraviolet frequency range. This numerical example is repeated for some other resonance frequency values that are gradually further from the infrared frequency range, and the resulting cessation of the spectral broadening process is illustrated. It is found that, for an infrared-resonant optical microcavity, supercontinuum can be generated under intense near-resonance excitation and spectrally ultra-tunable electromagnetic waves can be generated at the cavity output with the use of a switch controlled bandpass filter.
Keywords: Spectral broadening, Resonance frequency, Supercontinuum, Harmonic generation, Nonlinear media
Cite this paper: Özüm Emre Aşırım, Mustafa Kuzuoğlu, Wideband Electromagnetic Wave Generation via Supercontinuum Formation in Infrared-Resonant Optical Microcavities, International Journal of Optics and Applications, Vol. 8 No. 2, 2019, pp. 21-31. doi: 10.5923/j.optics.20190802.01.
Article Outline
1. Introduction
- When a nonlinear medium is excited by a wave of very high intensity, spectral broadening may occur depending on the length of the medium and the strength of nonlinearity of the medium [1-5]. The nonlinear medium that is used for spectral broadening is often chosen as a long optical fiber. Although, when the excitation intensity is of very high intensity, one can use a piece of bulk nonlinear crystal such as glass to observe spectral broadening. The required intensity to observe a significant spectral broadening by using a piece of bulk nonlinear crystal of a few centimeters of length, is on the order of
 . Such high intensities are achievable by using Q switched lasers or Mode locked lasers, and usually have pulse widths ranging from femtoseconds to picoseconds. The degree of spectral broadening depends mainly on the second order nonlinear electric susceptibility
  and/or the third order nonlinear electric susceptibility
  of the nonlinear crystal [6]. Achieving a significantly broadened spectrum in the THz frequency range or in the UV (Ultraviolet) frequency range is quite difficult as it is difficult to generate high power electromagnetic radiation in these parts of the spectrum. Modern lasers can generate very high-power laser beams in the infra-red region of the spectrum, but not as much in the THz or UV region of the spectrum. Therefore, it is of interest to search for a technique to generate high power radiation in the THz/UV range along with a continuously broadened spectrum.In the last decade, the vast majority of supercontinuum generation research has focused on optical fibers and their modification for achieving a wider supercontinuum, mainly photonic crystal fibers. Existing literature on supercontinuum generation is about the engineering of the constitutive parameters, structure, and geometry of optical/photonic crystal fibers to achieve a more extensive supercontinuum generation, such as those mentioned in [7-17]. Some research has focused on the pulse parameters of the excitation laser beams such as those as mentioned in [13,14]. Although not always mentioned or detailed in the existing literature, we have deduced that all these engineering attempts tend to modify either the resonance frequency of the engineered fiber structure, or the spectrum of the excitation (laser pulse). The relation between the excitation frequency and the resonance frequency has not been thoroughly investigated. In this paper we want to show that by carefully selecting the excitation frequency to be close to the resonance frequency
  of the medium of propagation, we can greatly increase the extent of spectral broadening and may use this technique to generate high intensity waves in a wide frequency band that ranges from the terahertz region to the ultraviolet frequency region.If we assume that the nonlinear susceptibility terms
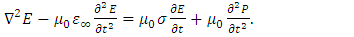
  are isotropic and frequency independent, then the electric field (E) of the high intensity wave that undergoes spectral broadening in a non-centrosymmetric nonlinear dielectric media is given as [1]
 | (1) |
 Free space permeability,
  Free space permittivity, E: Electric field,
  Kth order susceptibilityThis formulation states that the second and the third harmonics of the excitation frequency will be generated after a certain propagation time as evident by the right side of the equation. If the excitation intensity is sufficiently high, even nonnegligible fourth and sixth harmonics may be generated. But since ultra-high intensity waves (laser pulses) have very short durations [18,19] (on the order of picoseconds or femtoseconds), the nonlinear dielectric response must be modeled as a dispersive one. The inclusion of dispersion in the analysis is what enables us to observe a continuously broadened spectrum [20,21]. Therefore, in order to investigate the spectral broadening of a laser pulse in a nonlinear media, we need to be careful and accurate on how to include dispersion in the nonlinear wave equation. Our aim is to use a mathematical description of the wave equation that accounts for the resonance frequency. In order to use a simple and a clear mathematical model, we will model a separate differential equation for the electric charge polarization density and solve it in parallel with the wave equation, as described in the following section.
 2. Wave Propagation in Nonlinear Dispersive Media
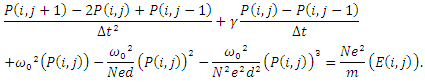
- When the wave that propagates through a dispersive medium has a very high power, nonlinearity arises. In this case, we must use a model that handles dispersion and nonlinearity simultaneously [22,23]. In order to model the nonlinear dispersive media, we solve the wave equation in parallel with the nonlinear equation of motion of an electron cloud as given below in Eq.2a and Eq.2b [24,25]:
 | (2a) |
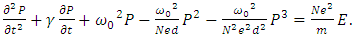 | (2b) |
 Background (infinite frequency band) permittivity,
  Natural damping coefficient of a medium, d: Atomic diameter,
  Free space permittivity,
  Angular resonance frequency of a medium, σ: Electric conductivity (Siemens/m) In Eq. (2b) we have made an expansion up to the third order of the nonlinear charge polarization density as higher order terms will be negligibly small [26,27]. Note that equations (2a) and (2b) are coupled to each other and need to be solved simultaneously. We will analyze the effect of the resonance frequency
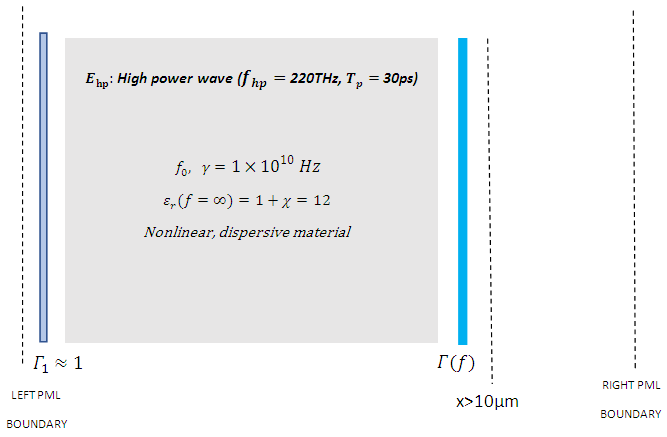
  of the cavity medium on spectral broadening and harmonic generation in an optical cavity which has an optical isolator as the left cavity wall and a switch controlled bandpass filter as the right cavity wall as shown in figure 1.
 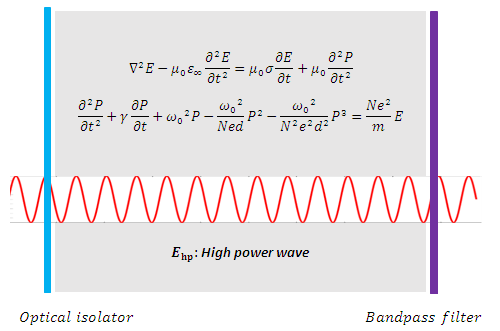 | Figure 1. Modeling of wave propagation in a nonlinear dispersive medium inside a cavity |
 | (3a) |
 | (3b) |
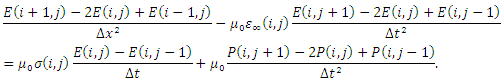
 By solving equations (2a,2b) simultaneously, along with the initial condition and the boundary conditions of a given problem, we can get the time variation of
  at any point in one dimensional space.
 3. Simulation Results
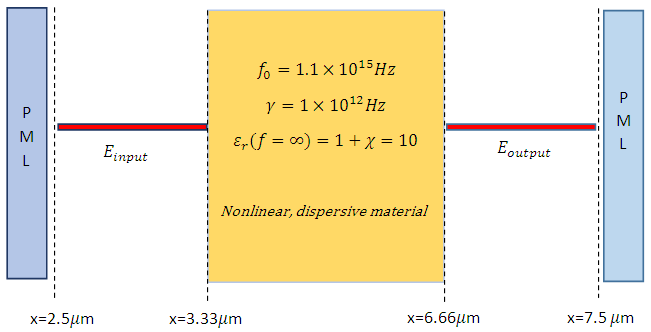
- Simulation 1: The high-power wave E is propagating inside a cavity that has two reflecting walls on the left and right side. The reflecting wall on the left side can be thought as an optical isolator, the one on the right side represents a switch controlled band-pass filter with a frequency dependent reflection coefficient.
 Resonance frequency of the medium:
  Damping rate of the medium:
 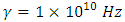 Dielectric constant of the medium
  Spatial range of the simulation domain:
  Dielectric medium range:
 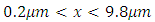 Left cavity wall location:
  Right cavity wall location:
  Electron density of the nonlinear medium:
 Atomic diameter:
 | Figure 2. Configuration of the cavity |

 (the prime sign indicates the time derivative)Boundary conditions:
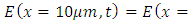
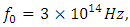
 For an input high power wave of frequency
  (one of the Nd:YAG laser emission frequencies), we solve equations (3a,3b) for each resonance frequency value from 10THz to 1500THz, and compute the maximum wave amplitude that is reached inside the cavity for 0<t<30ps, as shown below in figure 3.
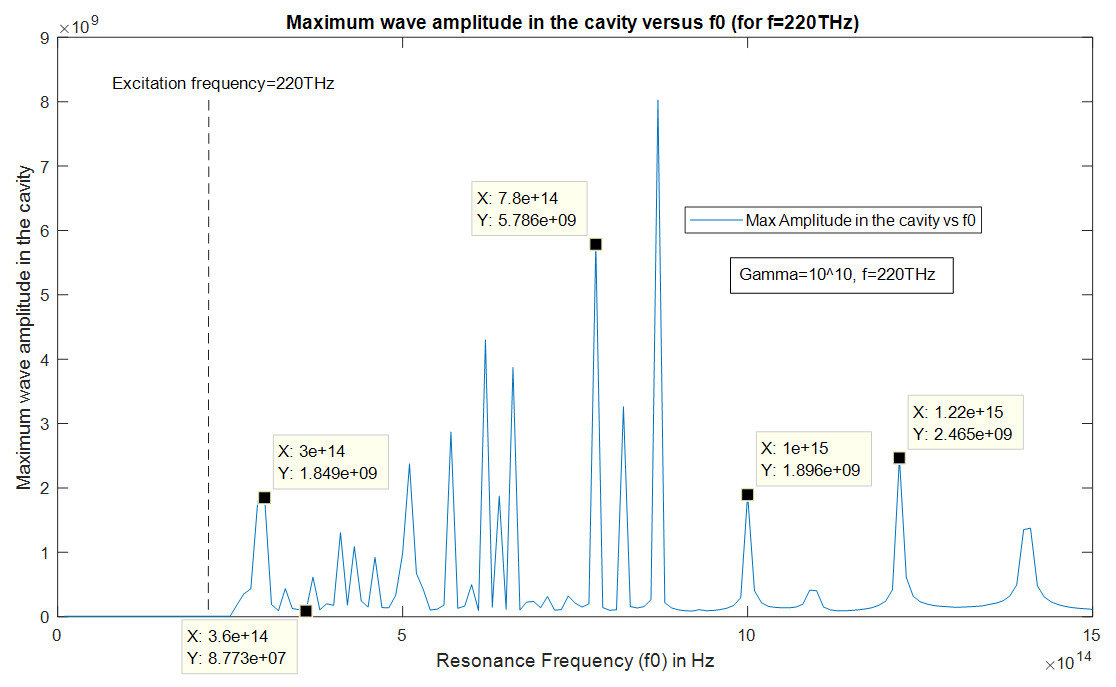 | Figure 3. Maximum wave amplitude in the cavity versus the resonance frequency  Our spectral broadening measurements are made at the indicated resonance frequencies (Note that, parameters such as the background permittivity Our spectral broadening measurements are made at the indicated resonance frequencies (Note that, parameters such as the background permittivity  and the conductivity and the conductivity  are assumed to be time independent, as the dispersion of the media is governed by the nonlinear electron cloud motion equation (eq.2b) rather than being incorporated into the medium parameters in a standalone wave equation. The damping coefficient are assumed to be time independent, as the dispersion of the media is governed by the nonlinear electron cloud motion equation (eq.2b) rather than being incorporated into the medium parameters in a standalone wave equation. The damping coefficient  is the inverse of the charge polarization lifetime of the electrons, which is a material specific constant rather than a time dependent quantity.) is the inverse of the charge polarization lifetime of the electrons, which is a material specific constant rather than a time dependent quantity.) |
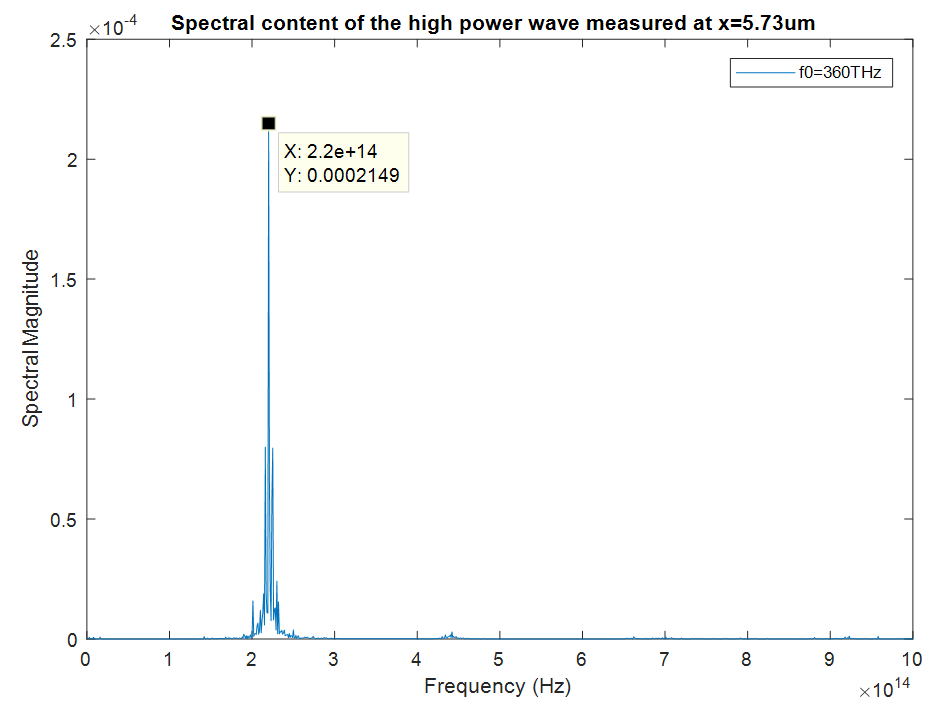
 and investigate the spectrum of the wave in the cavity. As we can see from figure 4, the spectrum of the wave encompasses the whole band from 10THz to 1000THz (from THz to UV), this is called a supercontinuum as the spectral broadening is ultrawide. The generation of the supercontinuum is due to the intracavity wave amplitude being high and most importantly due to the resonance frequency being close to the excitation frequency.
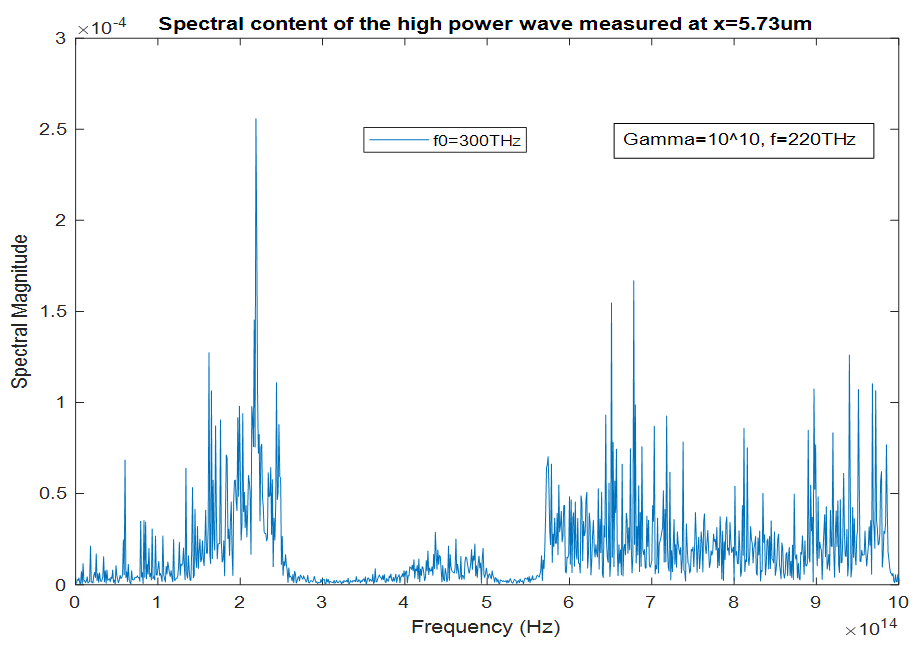 | Figure 4. Spectrum of the high-power wave as computed inside the cavity at  |
 (figure 5), we can see that the broadening at
  is much less significant than the broadening at
 even though we are still close to the excitation frequency. This is because the intracavity wave amplitude is much smaller at
 | Figure 5. Spectrum of the high-power wave as computed inside the cavity at  |
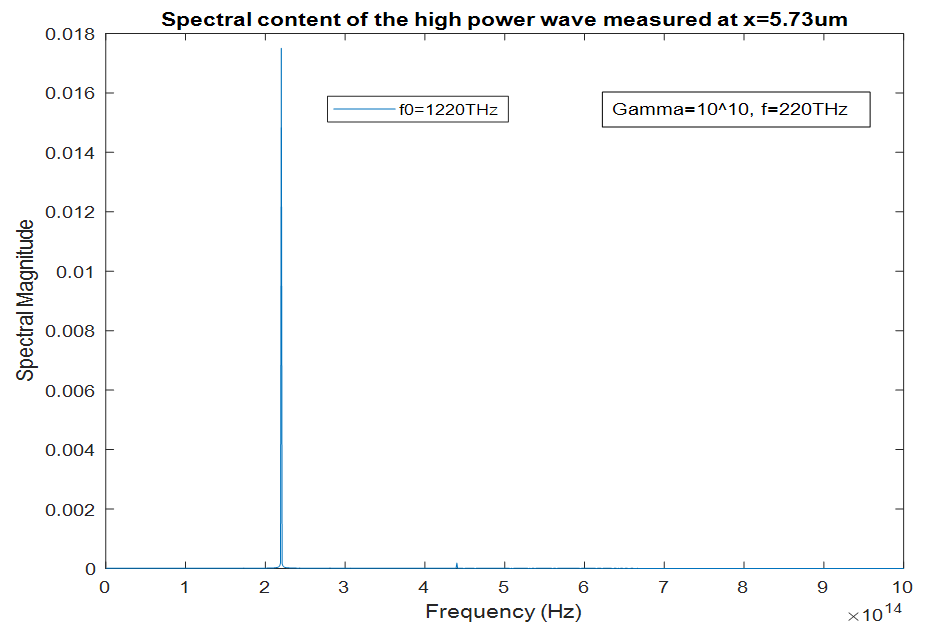
 , the spectral broadening is significant (figure 6), but not as profound as in the case of
  , even though the peak at
 has a much higher spectral amplitude. This is due to the increased spectral distance from the excitation frequency.
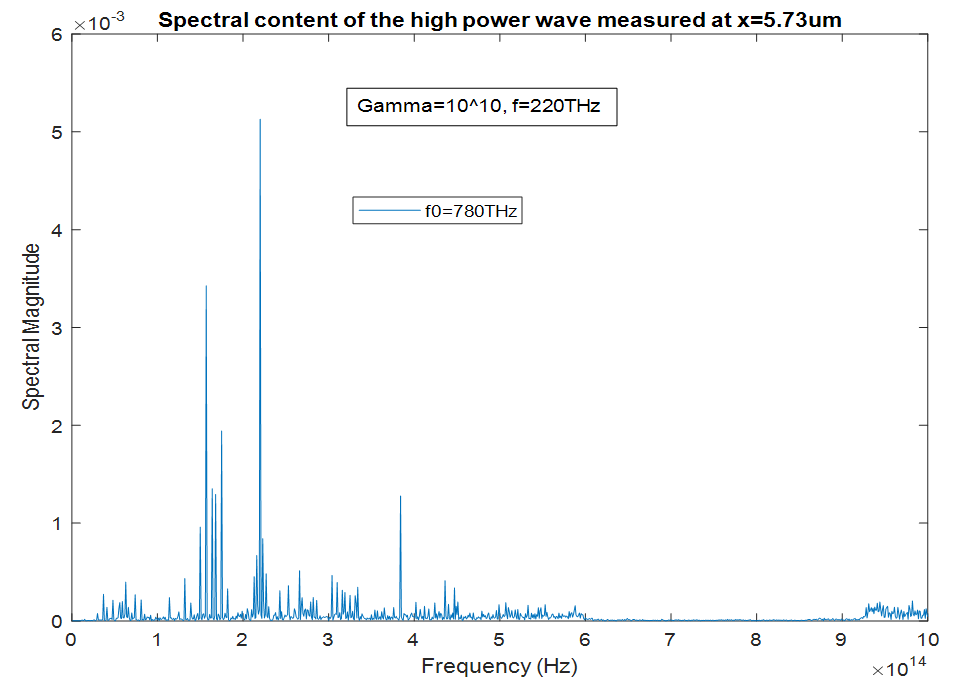 | Figure 6. Spectrum of the high-power wave as computed inside the cavity at  |
 there is no spectral broadening at all (fig 7), even though the amplitude of the peak at
  is almost the same with the peak at
  Similarly, for the amplitude peak at
  there is no spectral broadening (fig 8), even though the amplitude of the peak at
  is higher than the amplitude of the peak at
  This is because we are now too far from the excitation frequency to observe any broadening.
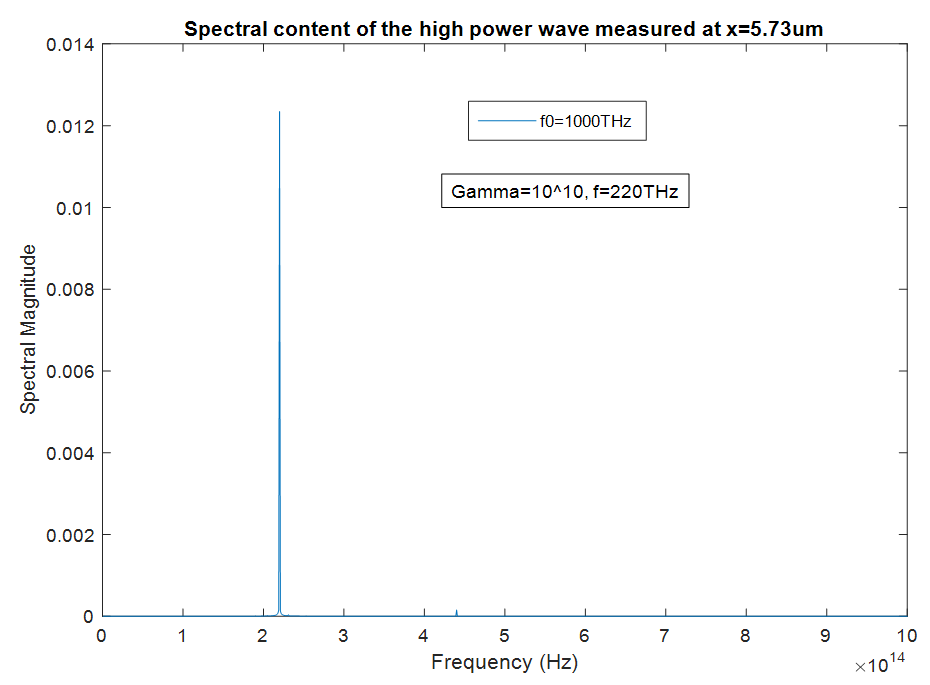 | Figure 7. Spectrum of the high-power wave as computed inside the cavity at  |
 | Figure 8. Spectrum of the high-power wave as computed inside the cavity at 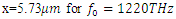 |
 where the spectral broadening is the most prominent. Once the spectral broadening occurs everywhere in a desired frequency range, as in the case of figure 4, we can use a bandpass filter in order to obtain a high-power output wave at a certain frequency. For example, we can obtain a high-power output in the ultraviolet frequency range or in the far-infrared frequency range. In order to obtain an output at a desired frequency, we need to adjust the frequency response of the bandpass filter accordingly. Consider the following configuration, assume that we have the fixed values of
 and
and 
 The right cavity wall is a switch controlled bandpass filter and for a wave frequency ( f ), the magnitude frequency response of the filter is chosen as
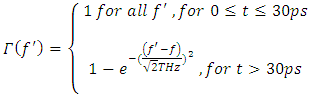 The left cavity wall is an ideal optical isolator, which acts as a perfect transmitter from the left side and as a perfect reflector from the right side. Optical isolators are generally used for avoiding high power reflections to prevent optical damage. Since we are only interested in what is going on inside the cavity (the right side of the isolator), we model the optical isolator as a perfect reflector. After the spectral broadening has occurred (t>30ps), the resulting cavity/filter output for each frequency is plotted in figure 9 below, for the configuration described above.
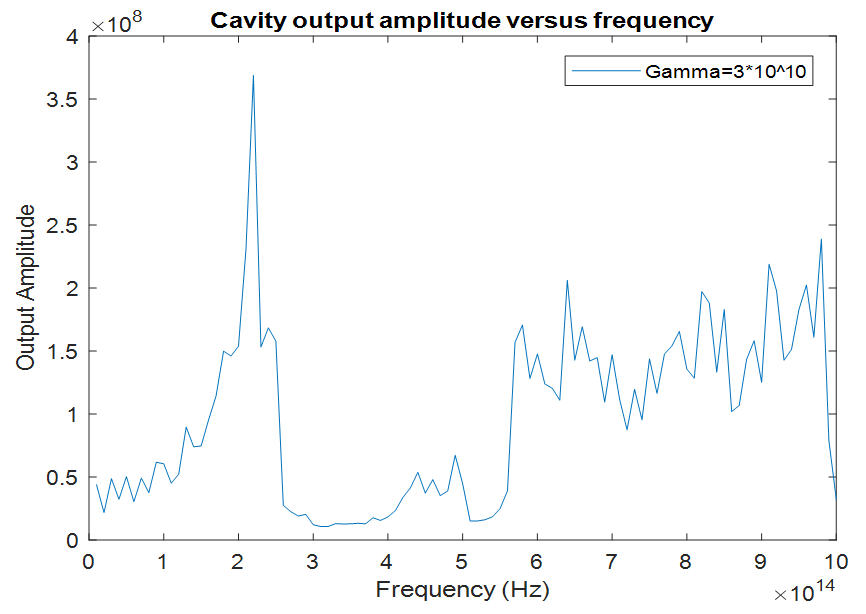 | Figure 9. Cavity output amplitude versus desired output frequency |
 | Figure 10. Amplitude variation of the cavity output at 3THz versus time |
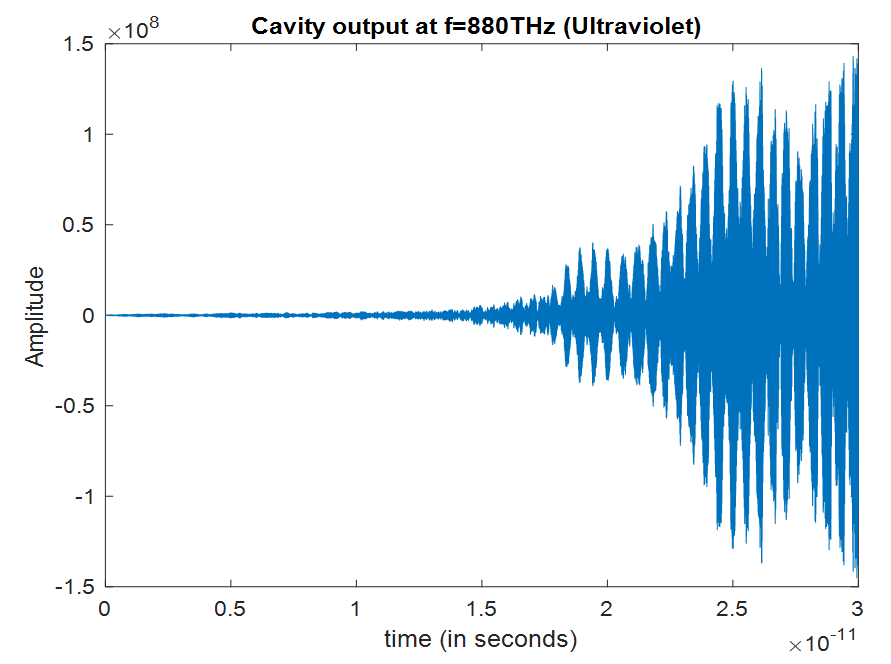 | Figure 11. Amplitude variation of the cavity output at 880THz versus time |
4. Conclusions
- Wideband spectral broadening or supercontinuum formation can occur inside a small infrared-resonant microcavity, under high intracavity wave intensity, provided that the resonance frequency of the cavity medium is close to the excitation frequency. As the intensity of the wave increases and as the resonance frequency gets closer to the excitation frequency, the spectral broadening occurs at a greater extent. Once the spectral broadening occurs at a target bandwidth, we can obtain a high-power output at a desired frequency, using a switch controlled optical bandpass filter. This allows us to generate intense electromagnetic waves in the frequency ranges where obtaining a high-intensity output is difficult, such as the terahertz range (1THz-10THz) or the ultraviolet frequency range.
5. Appendix: Validation of the Computational Model
- Simulation 2: (Second harmonic generation (SHG))This simulation aims to compare our computational model with the theoretical results given in [1,4]. The input field
 is generated at
  It has an amplitude of
  and a frequency of 300THz.
  Simulation parameters:
  Resonance frequency of the nonlinear medium:
  Damping rate of the nonlinear medium:
 Dielectric constant of the nonlinear medium
  Nonlinear dielectric medium spatial range:
 The values of
  and
and  given above are typical values for solid media. Computationally, the second harmonic generation efficiency results are obtained by solving equations (3a,3b).For
  the computational formula for second harmonic generation efficiency is
 | Figure 12. A high amplitude infra-red laser beam passing through a nonlinear dispersive medium |
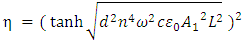 | (4) |
 = Input frequency (first harmonic);
  Input wave electric field amplitude Assume that we have the following values of the parameters
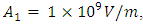 f=300THz, L=3.3333µm, n=3.1623
  For these values, the theoretical result at
 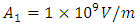 becomes almost equal to our computational result for a nonlinearity coefficient of
 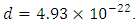 Therefore, we estimate this value as our nonlinearity coefficient and see if the results still agree for all other input amplitudes. The resulting comparison is shown in figure 13.
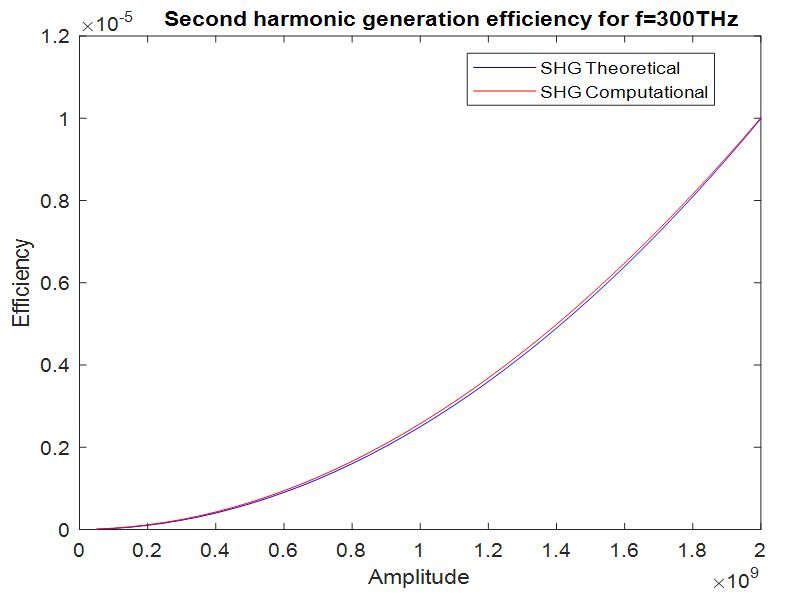 | Figure 13. Comparison of the second harmonic generation (SHG) efficiencies for f=300THz |