-
Paper Information
- Paper Submission
-
Journal Information
- About This Journal
- Editorial Board
- Current Issue
- Archive
- Author Guidelines
- Contact Us
International Journal of Optics and Applications
p-ISSN: 2168-5053 e-ISSN: 2168-5061
2017; 7(4): 69-74
doi:10.5923/j.optics.20170704.01

Phase Gradient Retrieval from Fringes Pattern by Using of Two-dimensional Continuous Wavelet Transforms
 Abstract
 Reference
 Full-Text PDF
 Full-text HTML
A. Ghlaifan, Y. Tounsi, D. Muhire, A. Nassim
Measurement and Control Instrumentation Laboratory IMC, Physics Department, Chouaib Doukkali University, El Jadida, Morocco
Correspondence to: A. Nassim, Measurement and Control Instrumentation Laboratory IMC, Physics Department, Chouaib Doukkali University, El Jadida, Morocco.
| Email: |  |
Copyright © 2017 Scientific & Academic Publishing. All Rights Reserved.
This work is licensed under the Creative Commons Attribution International License (CC BY).
http://creativecommons.org/licenses/by/4.0/

The central goal of this paper is to present an algorithm for optical phase gradient evaluation from only one fringe pattern using the two-dimensional continuous wavelet transform (2D_CWT) analysis. The phase gradient is computed from the extremum scales correspond to the maximum ridge of the wavelet coefficients modulus. Spatial modulation process is realized by combining two shifted fringes patterns, we use only single fringe pattern and we suggest to generate its quadrature using spiral phase transform SPT. The obtained results with computer simulation and image quality index values show a good performance of the proposed algorithm, and eventually, we can reconstruct the spatial phase distribution by integrating numerically the phase gradient along x and y-direction. Also, experimental results are given by exploiting speckle fringe correlation recorded in digital speckle pattern interferometry.
Keywords: Continuous wavelet transforms CWT, Wavelet ridge, Phase gradient extraction
Cite this paper: A. Ghlaifan, Y. Tounsi, D. Muhire, A. Nassim, Phase Gradient Retrieval from Fringes Pattern by Using of Two-dimensional Continuous Wavelet Transforms, International Journal of Optics and Applications, Vol. 7 No. 4, 2017, pp. 69-74. doi: 10.5923/j.optics.20170704.01.
Article Outline
1. Introduction
- Optical phase extraction becomes a key technique in the analysis of the fringe pattern given in interferometric metrology. The phase distribution encoded in the recorded fringe pattern intensity provides full-field measurements of physical magnitude like displacement, strain, temperature, refractive index changes. The phase shifting [1] and the Fourier transform methods [2] are the most common techniques used to extract phase from the fringe pattern. Several authors have reported the use of the wavelet transform to retrieve phase distributions encoded by fringes pattern [3, 4]. Two-dimensional continuous wavelet transform (2D-CWT) techniques are used to successfully demodulate fringe patterns [5, 6]. These algorithms give a wrapped phase distribution from modulated fringe patterns due to use of arctangent [7], thus, phase unwrapping is necessary, and phase gradient leads directly to continuous phase distribution phase distribution [8, 9]. Avoiding the complex step of the phase unwrapping. We present here a study of the phase gradient extraction from a single fringe pattern using the two-dimensional continuous wavelet transform algorithm 2D-CWT; it is easy to compute the phase gradient from maximums scales relating to the ridge point of the wavelet coefficient modules, which are integrated to give directly the continuous phase distribution. The first section of this paper will examine the fringe pattern intensity distribution analysis using two-dimensional continuous wavelet transform (2D-CWT). The second part presents the algorithm for extraction of phase gradient from ridge wavelet and we are finishing the work by presenting differents obtained results using computer simulation and an experimental fringe pattern given from digital speckle pattern interferometry.
2. Fringe Pattern Analysis by 2D Continuous Wavelet Transform
- An interference fringe pattern intensity distribution is commonly expressed as:
 | (1) |
 presents the background illumination,
  denotes modulation factor of the fringe pattern, and
  is the phase distribution related to the desired physical magnitude. Since fringe pattern can be presented in digital format, the image processing techniques can be exploited to analyze them. Between these techniques, 2-CWT (two-dimensional continuous wavelet transform) has been successfully applied since it is robust and particularly helpful for detecting the characteristics of local fringes [10, 11].Compared with the one-dimensional CWT algorithm [12], the 2D-CWT algorithm is more suitable for interferogram analysis due to its multiscale zooming capabilities. The wavelet coefficients can be calculated by the correlation product between an image and the mother wavelet with different values of dilatation and angle of orientation, and it is a measure of the local similarity between them, the wavelet coefficients of a given signal
  can be defined as:
 | (2) |
 denoted the complex conjugate operator,
  and
and  are respectively the translation parameters on
  and
and  directions,
  is a scale vector,
  is a rotation angle,
  is the 2D mother wavelet and
  is the conventional 2x2 rotation matrix corresponding to
  .
. | (3) |
 | (4) |
 is a fixed spatial frequency, and chosen to be about 5 to 6 to satisfy the admissibility condition [13], and
  represents the complex unit.In the 2D-CWT, for the fringe pattern, the wavelet rotates at the angle of
  , and scans the whole fringe pattern across the two direction x and y by translation t and d respectively,
  is the scale factor.
3. Phase Gradient Retrieval from Wavelet Ridge
- The analysis in CWT wavelet domain needs a fringe pattern with the spatial carrier in a chosen direction, for this reason, and using an appropriate modulation rate m, we combine numerically fringe pattern and its quadrature with the matrix cos(mx) and sin(mx) respectively to derive the modulated fringe pattern with a digital spatial frequency carrier [14]. Removing the background illumination from the intensity distribution of fringe pattern expressed in equ (1), by a low pass filter, it becomes as:
 | (5) |
 | (6) |
 and D represents direction map. From the equation (6), we obtain sine fringe pattern (quadrature) as:
 | (7) |
 | (8) |
 | (9) |
 | (10) |
 | (11) |
 | (12) |
 | (13) |
 correspond to the maximum ridge of the wavelet coefficients modulus is defined as:
 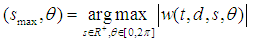 | (14) |
 represent the scale value for maxima.In term of representation of cwt transform, given a 2D signal, we produce a 4D representation which cannot be readily plotted or visualized. There exist several possible representations [20]. That the CWT can determine the local frequency [21], we have a natural way to detect the phase gradient that can be obtained from the local frequencies as:
  | (15) |
4. Computer Simulation and Application on Real Fringes
- To prove the effectiveness of the proposed method, we have tested it with simulated fringe patterns using MatLab software; the test phase distribution shown in figure (1.a) that we used has the following expression:
 | (16) |
 | Figure 1. Computer simulation (a) simulated phase map (b, c) simulated horizontal and vertical Phase gradient (d) 3d plotted phase map and (e) plotted line profile for row (:,128) |
 | Figure 2. Results of computer simulation (a) fringe pattern intensity distribution (b) quadrature map obtained by SPT (c) fringe pattern with spatial carrier |
 , vertical orientation
  , and a scale vector vary from 2 to 12 with increments of 0.01, we obtain the results presented in figure (3). The right column present the 3d plotted original phase gradient distribution along x and y-direction. The middle column presents the retrieved phase gradient by using the proposed algorithm, and the left column presents the plotted profile along one row from original and estimated phase gradient.
  | Figure 3. Right: Original phase gradient distribution along x and y-direction. Middle: Retrieved phase gradient. Left: Plotted profile along one row from original and estimated phase gradient |
 | Figure 4. Profile of the obtained phase distribution by numerical integration |
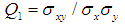 | (17) |
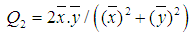 | (18) |
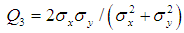 | (19) |
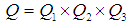 | (20) |
 and
and  presents the average of the image x and y,
  and
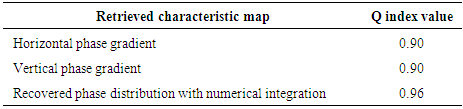
and  the standard deviation of the two images, respectively. The Q values are in the range [-1, 1] where 1 is satisfied for an exact retrieval characteristic. The table below shows the metric value given by Q index that compares the original phase gradient distribution with there obtained by 2D-CWT.
|
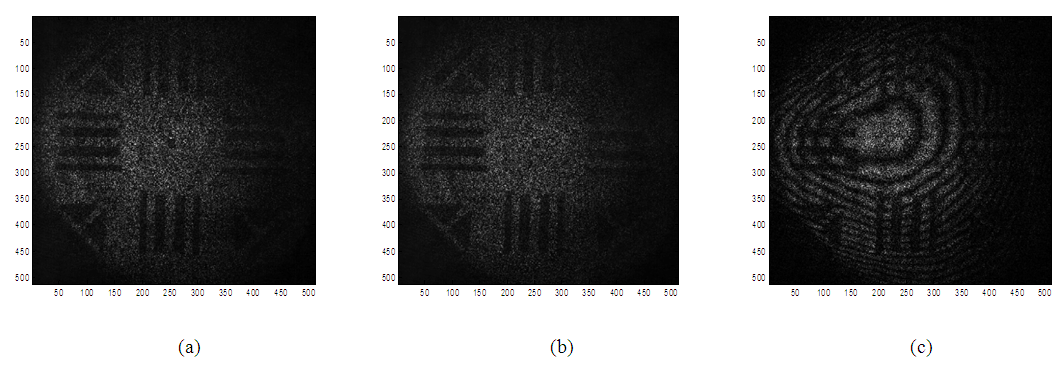 | Figure 5. The recorded speckle pattern. (a) After deformation, (b) before deformation, (c) speckle fringe correlation |
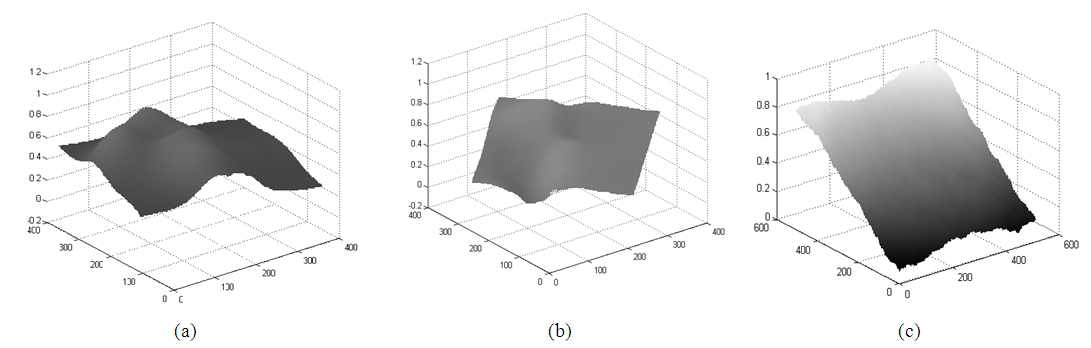 | Figure 6. The estimated features after filtering step, (a) horizontal phase derivative, (b) vertical phase derivative, (c) phase distribution obtained by numerical integration |
5. Conclusions
- The aim of this paper was to extract phase gradient distribution from a single fringe pattern with a spatial carrier using the 2-CWT algorithm. This study has shown that we can use only a single fringe pattern and generate its quadrature by spiral phase transform SPT, and this makes us to introduced digitally the spatial carrier. The performance of the proposed algorithm has been evaluated with the good accuracy by using generated fringes pattern by computer simulation. In an experimental context, we have applied the 2-CWT algorithm to a speckle fringe correlation after a speckle noise removing step.
ACKNOWLEDGMENTS
- The authors want to thank Dr. Neal Brock and Dr. J. C. Wyant from 4D Technology for providing them the experimentally shifted fringe patterns.