-
Paper Information
- Paper Submission
-
Journal Information
- About This Journal
- Editorial Board
- Current Issue
- Archive
- Author Guidelines
- Contact Us
International Journal of Optics and Applications
p-ISSN: 2168-5053 e-ISSN: 2168-5061
2017; 7(3): 62-67
doi:10.5923/j.optics.20170703.03

Design of Structural Parameters of Photonic Crystal Fibers for Optimization of Dispersion Flattening Management Using FDTD Method
 Abstract
 Reference
 Full-Text PDF
 Full-text HTML
Faramarz E. Seraji1, M. Nouri2
1Optical Communication Group, Iran Telecom Research Center, Tehran, Iran
2Elect. and Computer Eng. Dept, Science and Research Branch, Islamic Azad University, Tehran, Iran
Correspondence to: Faramarz E. Seraji, Optical Communication Group, Iran Telecom Research Center, Tehran, Iran.
| Email: |  |
Copyright © 2017 Scientific & Academic Publishing. All Rights Reserved.
This work is licensed under the Creative Commons Attribution International License (CC BY).
http://creativecommons.org/licenses/by/4.0/

In this paper, optimization and management of dispersion of photonic crystal fibers (PCF) are presented, using 2D finite difference method in time domain based on an Intelligent Programming. In the analysis, for the proposed PCF structures, by evaluation of the effective refractive indices, the dispersions are calculated for 11 circular air-hole rings in the cladding. The effects of geometrical parameters of the PCFs, such as air-hole diameters, the pitch value, number of air rings on dispersion are investigated for the influence of the structural parameters of the PCFs on the obtained dispersions and the corresponding results are graphically compared. It is shown that when the air-hole diameter decreases, the slope of the negative dispersion would increase, while increase of the pitch would cause a decrease in the negative dispersion values. It is further shown that at pitches of higher than 5μm, irrespective of air-hole diameter, the variation of the dispersion is almost linear. The results presented can help in choosing the PCF parameters for appropriate applications.
Keywords: Dispersion management, Photonic crystal fibers, Optimization, FDTD
Cite this paper: Faramarz E. Seraji, M. Nouri, Design of Structural Parameters of Photonic Crystal Fibers for Optimization of Dispersion Flattening Management Using FDTD Method, International Journal of Optics and Applications, Vol. 7 No. 3, 2017, pp. 62-67. doi: 10.5923/j.optics.20170703.03.
Article Outline
1. Introduction
- In the past two decades, photonic crystal fibers (PCFs) have become popular for applications in designs of optical devices used in optical communication networks [1, 2] and sensing systems [3]. The particular application, which is widely used, is in designing of dispersion compensators commonly utilized in WDM optical communication networks to reduce the number of required repeaters [4, 5]. One of the characteristic features of the PCFs in comparison with conventional optical fibers is flexibilities of their characteristic parameters in response to dispersion effects on propagating pulses caused intrinsically by optical fibers in a long-haul transmission optical line [6, 7].Several designs of dispersion compensating fibers (DCFs) have been optimized for compensation of the dispersions using PCFs in optical transmission bands ranging from 1460 nm to 1675 nm [8-10]. Xuyou Li et al reported design of a pentagonal PCF with large flattened negative dispersion by using the full vector finite element method (FEM) [11]. The reported average negative dispersions for two kinds of optimized designs were −611.9 ps∕nm∕km over 1,460–1,625 nm and −474 ps∕nm∕km over 1425–1675 nm wavelength bands, respectively. Raonaqul Islam et al reported design of a porous-core circular photonic crystal fiber with circular arrangement of air holes, both in the periodic cladding and the porous core [12]. The simulation results, by using an efficient finite element method, showed a flattened dispersion of ±0.09 ps∕THz∕cm within the frequency range of 0.9 to 1.3 THz. The management of the chromatic dispersion, which is achieved by doping the core of a PCF doped with Germanium was reported [13]. An ultra-flattened dispersion with a range of values from -210 ps/nm.km up to 15 ps/nm.km was obtained. In another report, a design of a hybrid PCF with elliptical and circular air holes of hexagonal layout with triangular lattice of five rings around the solid core was presented by Varshali Sharma et al [14]. The obtained large flattened dispersion was of the order of 4.88 ps/nm/km for the wavelength range of 1.2 to 1.8 μm.In this paper, using two-dimensional finite difference time domain (2D-FDTD), three PCF structures are proposed to optimize the dispersions by considering the effects of the geometrical parameters, such as air-hole diameters and the center-to-center spacing between the holes (pitch). The air-holes are arranged in the cladding in the form of triangular lattice by constituting 11 rings around the core [15].
2. Dispersion and Index Formulations
- Total dispersion in an optical fiber is expressed as follows:
 | (1) |
 is the material dispersion and
  indicates the waveguide dispersion that are expressed, respectively, as:
 | (2) |
 | (3) |
 represents the velocity of light in a vacuum,
  is the wavelength, and
  indicates the propagation constant, which is defined as follows:
 | (4) |
 is the operating wavelength,
  a constant coefficient, and
  is a natural number. For evaluation of the dependency of refractive index of silica on wavelength, the Sellmeier formula is used, which is defined as follows:
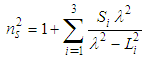 | (5) |
 represents the coefficients related to the strength of material oscillator and
  denotes the corresponding wavelength of the oscillator. Finally, the effective refractive index
  is determined with respect to the structural parameters of the PCFs, using the following approximate expression [10]:
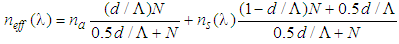 | (6) |
 and air-hole diameter
  , the number of air rings in the cladding
  , and the pitch
  with effective refractive indices of the core
  and air
  .
.3. Design of the PCFs for Dispersion Management
3.1. Design Procedures
- The dispersion analysis is performed by considering the variations of the air-hole diameter and the pitch in a PCF of 11 air-hole rings in the cladding. At the first stage of the analysis, the shapes of all the air-holes in the 11 rings are circular arranged in triangular lattice with equal diameters of
 and the pitch
  is
is  .By using 2d-FDTD method, the cross-section, effective refractive index, and dispersion as a function of wavelength are depicted in Fig. 1. The variations of the dispersion in the wavelength range of
  to
to  are obtained from -70 to +22 ps/nm.km. The dispersion values at 1300 nm and 1550 nm are zero and about 14 ps/nm.km, respectively, with a mild changing slope. In another attempt, based on the intelligent algorithm [10], by further increase of the air-hole diameter to
  while keeping the pitch
  , it is noticed that the variations of the dispersion has changed from -47 to +15 ps/nm.km and the value at
  is obtained at about 9 ps/nm.km, as shown in Fig. 2. That is, by increasing the air-hole diameter by about 37%, there will be a reduction of dispersion value of 36% (5 units) smaller than the previous case.The dispersion slope at
  in second case (Fig. 2) is 3.64 deg. higher than that of the first case (Fig. 1). In the final stage of design procedure, the impact of large variations of the pitch
  on the dispersion property is investigated for air-hole diameter of
  The corresponding numerical results are graphically depicted in Fig. 3. Noteworthy to mention that by sudden increase of the pitch, the PCF structure is not rumbled and the holes arrangement is taken care by the employed intelligent algorithm [10].
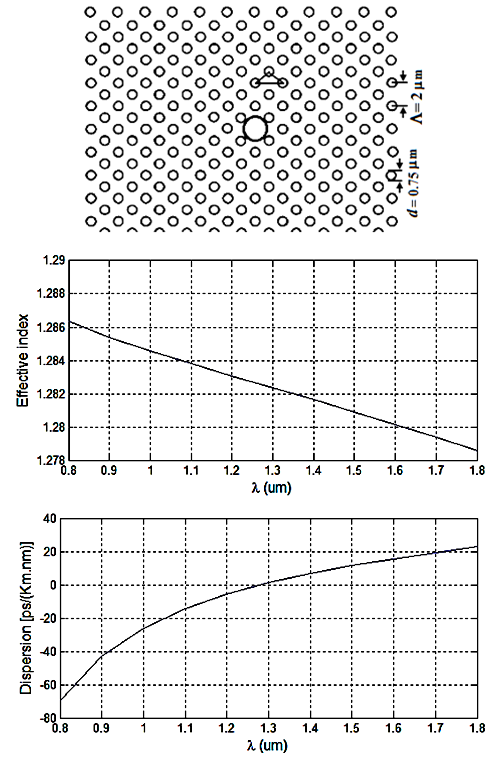 | Figure 1. Cross-section of PCF with  , ,   (Above), the effective refractive index (Middle), and dispersion (Below) as functions of wavelength (Above), the effective refractive index (Middle), and dispersion (Below) as functions of wavelength |
 | Figure 2. Cross-section of PCF with 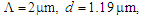 (Above), the effective refractive index (Middle), and the dispersion (Below) as functions of wavelength (Above), the effective refractive index (Middle), and the dispersion (Below) as functions of wavelength |
 | Figure 3. As previous curves for   and and  |
3.2. Impact of Geometrical Parameters of PCFs
- More investigations on impact of geometrical parameters of designed PCFs are carried out by considering different values of the air-hole diameter and the pitch
 values.The first attempt was on increasing the air-hole diameter in a range of
  to
to  with constant pitch of
  and number of air-hole ring
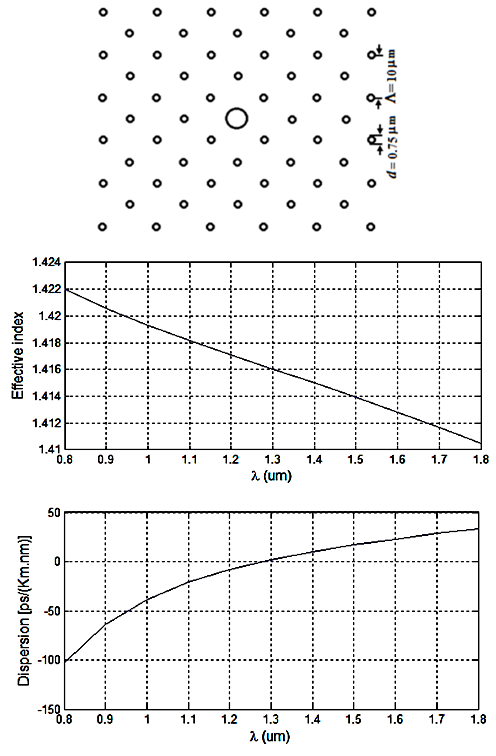
  . The numerical results of dispersion variations in terms of wavelength are illustrated in Fig. 4 [16]. We note that for the given value of
  , over calculating range of the wavelength, when air-hole diameter increases, the slope of the dispersion would decrease and becomes more flattened.
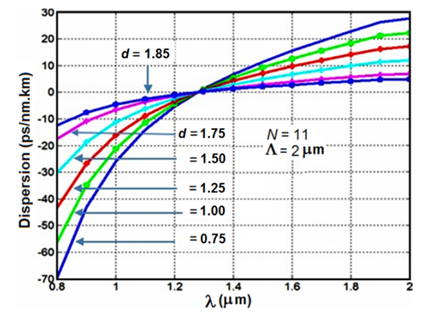 | Figure 4. Dispersion versus wavelength for different values of the air-hole diameter,  and and  |
 to
to  , the variations of the dispersion slope versus air-hole diameter is plotted in Fig. 5, where the pitch
  and the number of air-hole ring
  . It is observed that when the air-hole diameter increases, the slope at
  would decrease to the lowest level for a typical maximum value of
  . It shows that the trend of dispersion slope variations in terms of air-hole diameter is almost linear. As
  increases, the dispersion in the wavelength range of
  to
to  , becomes more flat [8, 17].
  | Figure 5. Variation of the dispersion slope versus air-hole diameters for  and and  |
 to
to  with respect to wavelength is investigated, by considering two separate values of air-hole diameter of
  and
and  .The numerical results are illustrated in Fig. 6. In comparison to Fig. 4, it is noticed that as the pitch increases, the tail of the dispersion curve tends to more negative levels in shorter wavelengths, while in longer wavelengths, the dispersions become more positive. This condition is observed for both values of the air-hole diameter. The distinguishable difference between Figs. 6a and 6b is derived mainly from the influence of changes of the air-hole diameter d. When d. increases, the slope of the dispersion curve would reduce and tends to a flatter levels [9]. In general, as d. decreases, the dispersion slope would increase, whereas an increase in the pitch would cause the dispersion slope to increase. Therefore, the impacts of air-hole diameter d. and the pitch
  counterbalance each other.
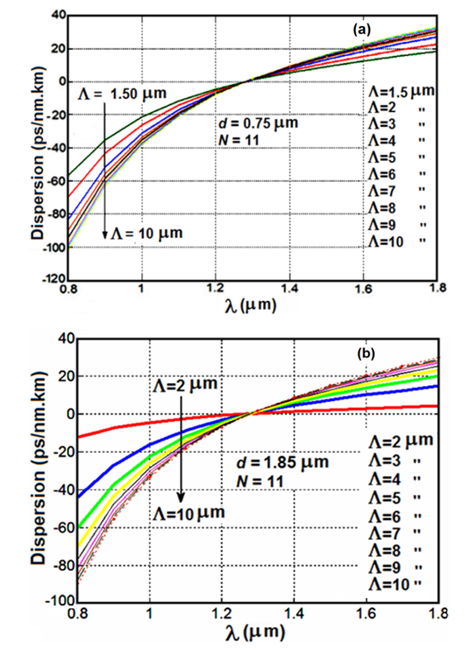 | Figure 6. Dispersion versus wavelength for different values of the pitch for (a)  (b) (b)  and and  |
 and
and  for various values of the air-hole diameter d, as depicted in Figs. 7.If we compare two Figs. 7a and 7b, it’s noted that in the calculating range of the pitch
  the dispersion values exponentially become more negative at wavelength
  , while at higher wavelength
  , the changing trend of the dispersion is towards positive values. At the same time, the impact of the variations in air-hole diameter d, causes different changes for two wavelengths. At
  and
and  , the dispersion variations is about +5.15 ps/nm.km, whereas at
  with the same value of d, the variation is about -27 ps/nm.km.
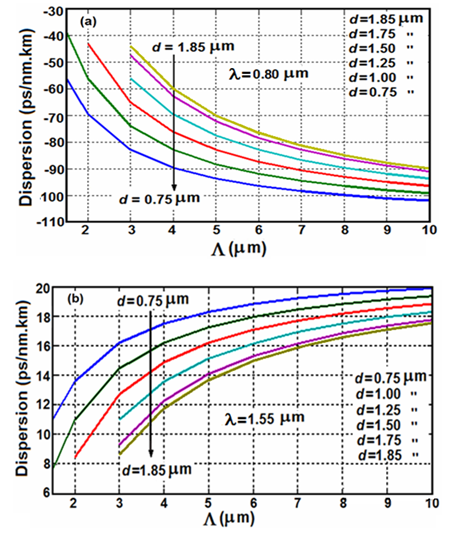 | Figure 7. Variations of dispersion versus the pitch for various values of d and  (a) at (a) at  and (b) and (b)  |
 , all the slopes of the dispersions in the calculating range of air-hole diameter d, intersect at about twice the corresponding value of
  denoted by
  In other words, the ratio
  almost remain at constant value. For instance, when
  , the intersection points
  of all the dispersion slopes occur at about
  respectively, for different values of d, as shown in Fig. 8.
 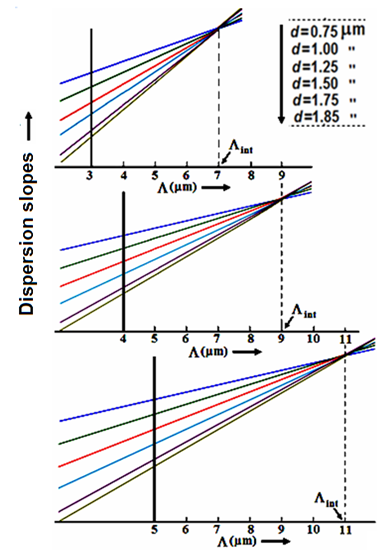 | Figure 8. Intersection points of dispersion slopes obtained as  and and  at at 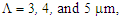 respectively, for different values of d respectively, for different values of d |
 and dispersion in terms of the given range of d vary linearly, defined by equations
  and
and 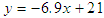 , respectively, at
  and
and  , as illustrated in Fig. 9.
 | Figure 9. The linear relationships between (a)  and (b) the dispersion versus d at and (b) the dispersion versus d at  and and  |
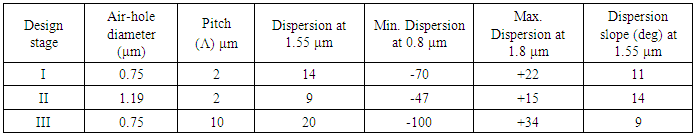
 is obtained as 20 ps/nm.km with a slope of 9 deg. To compare the slope of the three cases, we found that in the third case the dispersion become about 36% more flattened. The numerical results obtained in three cases are listed in Table 1 for a qualitative comparisons.
|
4. Conclusions
- This paper has presented designs of three PCF structures to study the dispersion behavior under impacts of typical geometrical parameters, such as air-hole diameter and the pitch of the proposed PCF structures with respect to the wavelength variations. In a qualitative comparison in the present study, beside a reasonable compliance, the dispersion variations with respect to higher pitch values are reported, and it is shown that the dispersion could vary linearly as a function of the pitch of the PCF. In addition, it is shown that by knowing the impact of the air-hole diameter on the dispersion variations could benefit the PCF designers for better choices of PCF applications.Further, it’s revealed that in plotting the variations of the dispersion versus wavelength for a typical range of
 to
to  , at
, at  , the intersections of dispersion slopes
  of the proposed PCF, with number of air-holes in the cladding
  varies linearly with air-hole diameter d. We have also shown that at
  and
and  , the relationships between
  and dispersion in terms of d vary linearly, defined by equations
  and
and 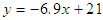 , respectively.Another interesting result worth to note is the flat dispersion spectrum in the range 1100 to 1550 nm, when
  and
and  . Further results showed that the impacts of air-hole diameter d and the pitch
  counterbalance each other in a given PCF structure.