Martin Drahanský1, Ondřej Kanich1, Eva Březinová2, Koichi Shinoda3
1Faculty of Information Technology, Brno University of Technology, Božetěchova, Brno, Czech Republic
21st Department of Dermatology and Venereology, St. Anne’s University Hospital, Pekařská, Brno & Faculty of Medicine, Masaryk University, Kamenice, Brno, Czech Republic
3Department of Computer Science, Graduate School of Information Science and Engineering, Tokyo Institute of Technology, Japan
Correspondence to: Martin Drahanský, Faculty of Information Technology, Brno University of Technology, Božetěchova, Brno, Czech Republic.
| Email: |  |
Copyright © 2016 Scientific & Academic Publishing. All Rights Reserved.
This work is licensed under the Creative Commons Attribution International License (CC BY).
http://creativecommons.org/licenses/by/4.0/

Abstract
This article describes our experiments with optical properties of skin on fingers. At the beginning we introduce the medical skin structure and measurement of blood oxidation. This information is needed for the second part – preparation of our measurement (acquirement) equipment for multispectral skin illumination using various wavelengths and for finger vein acquirement using infrared light. Follow results from our experiments which are summarized in graphs and tables. The aim of this research is to find a suitable solution for liveness detection (anti-spoofing), based on optical properties of skin on fingers.
Keywords:
Human skin, Liveness detection, Skin disease, Biometrics
Cite this paper: Martin Drahanský, Ondřej Kanich, Eva Březinová, Koichi Shinoda, Experiments with Optical Properties of Skin on Fingers, International Journal of Optics and Applications, Vol. 6 No. 2, 2016, pp. 37-46. doi: 10.5923/j.optics.20160602.03.
1. Introduction
Biometric systems based on fingerprint recognition use various sensor technologies for acquirement of fingerprints. The common technologies are: optical, capacitive, ultrasound, e-field, pressure based, electro-optical, MEMS and some others. One of the mostly used sensor technologies for fingerprint acquirement is the optical one. This technology is based on principle that the light coming out from the light source is partially absorbed, scattered and reflected from the ridges (papillary lines) on a finger, whereas the reflected beams of light are captured by a CCD (charge-coupled device) or CMOS (complementary metal-oxide-semiconductor) camera – see Fig. 1.1. In the most cases the finger is placed on a glass platen (touched sensors) or is placed above the camera unit (touchless sensors). In both cases the finger(tip) is illuminated by a light source of a concrete wavelength – commonly used colors are red, green and white. The skin on a fingertip reacts to each of the colors in a different way. And this is an important aspect, which we try to discuss in this article, because the impact of reaction of the skin on a fingertip for a general fingerprint sensors has to be analyzed, but additionally we can use the optical skin properties for liveness detection (anti-spoofing). On this principle some spectroscopic methods for liveness detection are based. It is difficult to cheat such sensor, i.e. these optical properties of our skin on fingers should be analyzed that we better understand which of these properties we can use as a base for liveness detection methods or for enhancement of reliability and quality of fingerprint acquirement.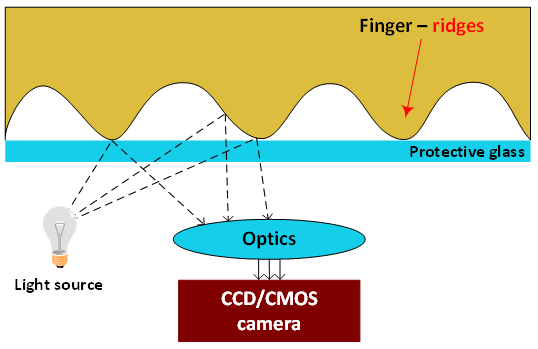 | Figure 1.1. Schematic principle of optical sensor technology for fingerprint acquirement |
The aim of this research is to find the best skin properties for development of methods for liveness detection, i.e. recognition whether any spoof is used instead of a real living finger. We constructed new hardware tool for using LEDs with various wavelengths, incl. reflective and transmissive light. Reflective illumination is especially suitable for multispectral skin properties, transmissive could be used with advance for finger veins acquirement.
2. Fingerprint Acquirement Using Optical Sensor
This chapter tries to sum up all the phenomena that can influence a fingerprint when optical scanner is used. Unfortunately optical sensing technology is one of the most influenceable technology. There are three main groups of phenomena damaging the quality of a fingerprint. It is finger condition, sensor condition and environment. [1] [2]The first factor is dirt on the finger, be it a small particle, a few grains of dust or just a greasy finger. Liquids are usually the most problematic types, however optical sensors acquire anything what can be seen. Dry or moist finger is one of the most typical cases of damage done to a fingerprint. Whether it is because we wash our hands or we are nervous and our fingers are sweating or on the other hand we have very dry hands because of some lotion. Physical damage of a finger like cuts or abrasions is obviously damaging the fingerprint. Closely related to physical damage are skin diseases. There are ones which are changing papillary lines. And if the disease is severe enough to damage the dermis structure of ridges (papillary lines) there is no way of getting the original structure. Pressure can literally turn the fingerprint into a big black oval. Only contactless sensors are fully immune to the damage that the pressure can make. The change of pressure, a very big or a very low pressure or movement is also considered being a part of the next category of non-cooperative behavior. All these activities lead to a very thick or thin and blurred images. Non-cooperative behavior of the user is typical when the user dislikes biometric technology or simply tries to find the limits of its functionality. The user usually uses an unexpected pressure, moves when the device is scanning and/or places the finger in a wrong place or a wrong rotation. [1] [2]The second factors connected to the sensor will be described now. Dirt on the surface has the same effects like the dirt on the finger. The problem is that it is affecting everyone who is using the device. So in the registration phase it can create a common error for every user and there is a danger that these users will not be able to be identified after cleaning up the device. In addition to fingers there are more types of dirt than can pollute the sensor area: for example metallic dust, wooden dust, earth dust, fine sand, excrements (in outdoor use). These could be on fingers as well, but they are easily pictured on the sensor. Every sweep sensor is also more resistant to this type of damage. Latent fingerprint is closely related to the previous topic. It is in some way a type of dirt on the surface of the sensor. More than damaging a new fingerprint there is a security hazard. These fingerprints can be copied or reactivated to cheat the biometric device. This factor is almost certainly eliminated by usage of the sweep sensors. Physical damage is an extreme but a possible influencing factor of the resulting fingerprint. There is no easy way to prevent the sensor from damaging. In the optical technology the glass crack could be seen in the fingerprint. [1] [2]The last type of influencing factors is the surrounding environment. Vibration in some degree is not a problem, but when the vibrations are strong, they can unfasten some internal components causing the device to break down. In another situation they can slightly change the position of a finger. This movement, as it was described in the user influencing factors, can blur the fingerprint. Only sensors using the sweep technology are, to a certain degree, resistant to this type of damage. Surrounding light is typical factor exclusively connected to the optical and electro-optical technologies because they have a light sensing unit. Usually to keep the cost of the sensor low the sensor area is small so that the finger covers this fully. In that case there is no problem with the surrounding light. However, when the sensor area is larger, the finger of the user is smaller, a smaller finger like a pinkie is used or the contactless technology is used, the influence of the surrounding light can be huge. Electro-magnetic radiation is an influencing factor which affects not only sensor, but entire biometric system. The device as a whole can be influenced by electro-magnetic radiation. Wires inside or outside connecting it to other parts of biometric system and all electronic components can be influenced. Some devices, for example, will create a blurred image. [1] [2]
3. Skin Optical Characteristics
This subchapter contains description of general skin optical characteristics (based especially on [3]) and basic principles of oxygen saturation measurement (this principle is important for vein acquirement).
3.1. Skin Optical Characteristics
Skin is a multilayered and inhomogeneous organ (see Fig. 3.1). In this section, we outline the biological characteristics of its main constituents, and how they affect the propagation and absorption of light.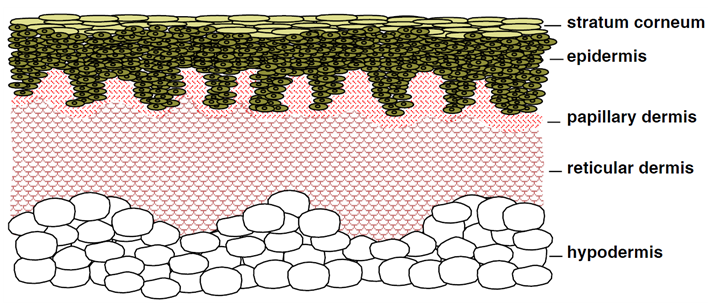 | Figure 3.1. Schematic cross-section of human skin tissues and the subcutaneous fat tissue [3] |
The first and outermost section of human skin is the stratum corneum, which is a stratified structure approximately 0.01-0.02 mm thick [3]. Stratum corneum is a part of the whole outermost layer of the skin – namely the epidermis (see Fig. 3.1). The stratum corneum is composed mainly of dead cells, called corneocytes, embedded in a particular lipid matrix. Light absorption is low in this tissue, with the amount of transmitted light being relatively uniform in the visible region of the light spectrum. [3]The epidermis is a 0.027-0.15 mm thick structure composed of five layers (stratum basale, stratum spinosum, stratum granulosum, stratum lucidum, stratum corneum). The epidermis propagates and absorbs light. The absorption property comes mostly from a natural chromophore, melanin. There are two types of melanin, the red/yellow phaeomelanin and a brown/back eumelanin. Their absorption spectra are broad, with higher values for shorter wavelengths. The skin color is mostly associated with the eumelanin. The ratio between the concentration of phaeomelanin and eumelanin present in human skin varies from individual to individual, with much overlap between skin types. [3] Recent studies reported values between 0.049 and 0.36. Melanin is produced by cells called melanocytes occurring in the stratum basale, and it is found in membranous particles called melanosomes. The melanin absorption level depends on how many melanosomes per unit volume are in the epidermis. Typically, the volume fraction of the epidermis occupied by melanosomes varies from 1.3% (lightly pigmented specimen) to 43% (darkly pigmented specimen). [3] The dermis is a 0.6-3.0 mm thick structure which also propagates and absorbs light. It can be divided into two layers: the papillary dermis and the reticular dermis (see Fig. 3.1). These layers are primarily composed of dense, irregular connective tissue with nerves and blood vessels (smaller ones in the papillary, and larger ones in the reticular dermis). The volume fraction of blood in tissue can vary, roughly in the 0.2-7.0% range. The effluence rate of blood decreases as we get deeper into the skin, following an almost linear pattern in the dermis. In the blood cells we find another natural chromophore, hemoglobin, which absorbs light and gives blood its reddish color. Normally, the hemoglobin concentration in whole blood is between 134 and 173g/l. In the arteries, 90-95% of hemoglobin is oxygenated, and in the veins, more than 47% of the hemoglobin is oxygenated. These two types of hemoglobin, namely oxygenated and deoxygenated hemoglobin, have slightly different absorption spectra. Two other blood borne pigments are found in the dermis, bilirubin and ß-carotene, which contribute to the yellowish or olive tint of human skin. We remark that ß-carotene may be also found in the epidermis and stratum corneum. [3] The hypodermis is a subcutaneous adipose tissue characterized by a negligible absorption of light in the visible region of the spectrum. It is usually not considered part of the skin, and its size varies considerably throughout the body. It can be up to 3 cm thick in the abdomen and absent in the eye lids. The hypodermis presents significant deposits of white fat, whose cells are grouped together forming clusters. Due to the presence of these white fat deposits, most of the visible light that reaches this tissue is reflected back to the upper layers. [3] The scattering profile of human skin has two main components: surface and subsurface scattering. Surface scattering follows Fresnel equations, and it is affected by the presence of folds in the stratum corneum. The aspect ratio of these meso-structures depends on biological factors such as aging and hydration. Approximately 5-7% of the light incident (over the entire spectrum) on the stratum corneum is reflected back to the environment. The remaining portion is transmitted to the internal tissues. Besides the reflective-refractive scattering caused by the reflection and refraction of light at cellular boundaries, two other types of subsurface scattering occur within the skin layers: Mie and Rayleigh scattering. [3]The stratum corneum and the epidermis are characterized as forward scattering media. In the former this behavior is due to the alignment of the fibers, while in the later it is due to Mie scattering caused by particles that are approximately the same size of the wavelength of light (e.g., cell organelles). The level of forward scattering for these tissues is wavelength dependent. [3]In the dermis, collagen fibers (approximately 2.8 μm in diameter and cylindrical) are responsible for Mie scattering, while smaller scale collagen fibers and other micro-structures are responsible for Rayleigh scattering. Light gets scattered multiple times inside the dermis before it is either propagated to another layer or absorbed. This means that the spatial distribution of the light scattered within the dermis quickly becomes diffuse. While Mie scattering produces variations on both ends of the visible region of the light spectrum, Rayleigh scattering, being inversely proportional to the wavelength of light  produces larger variations on the low end of the light spectrum. [3]
3.2. Oxygen Saturation
Oxygen saturation is a method to define liveness of a sample. This method is based on computing oxygen, which is tied to blood. The principle of this method is similar to pulse oximeter. [4]The heart is organ that is essential to a human body. It is hollow muscle that pumps oxygenated blood to various parts of the body. Heart cycle is composed of two main phases: systole and asystole. Systole is coordinated contraction of atrium or ventricle. [4]On the other hand, asystole is release of the hollow muscle. With every systole about 70 ml of oxygenated blood is pumped into the system. Average of 70-80 contractions are made in a minute. Blood flows to all parts of human body system and rate of oxygen tied to hemoglobin is decreasing with time [5].Molecule of hemoglobin is made of 10,000 atoms, where three of them are atoms of iron, which ties the oxygen. Oxygen is a colorless gas, which is located in atmosphere and human body would not last without it. Too much of oxygen or too less can be dangerous to human body as it can lead to diseases and eventually even death. Therefore oxygen in human body must be measured, e.g. by pulse oximeter [5].How oximeter worksPulse oximeter works with two LEDs (light emitting diode), which emit light. One of the diodes emits the light beam of wavelength 660 nm and the second one emits wavelength of 910 nm (red and infrared light) [5]. Difference in light absorption of various wavelengths of hemoglobin is shown in Fig. 3.2. Detector, which is opposed to LEDs, is used to determine difference in light absorption for oxyhemoglobin and deoxyhemoglobin [5].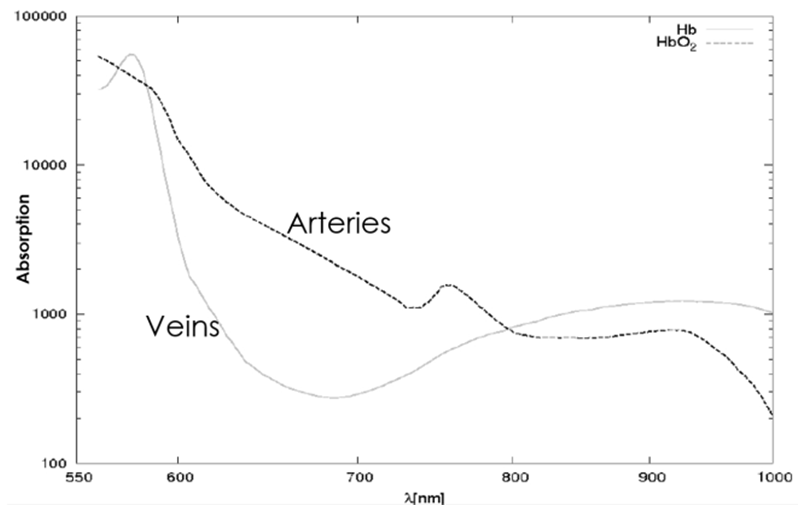 | Figure 3.2. Absorption of light on different wavelengths |
Oxygen saturation is defined as ratio of oxyhemoglobin to the total concentration of hemoglobin in blood and its formula is [6]: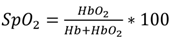 | (3.1) |
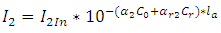
Arterial SpO2 is a parameter measured by oximeter. This value is expressed in percentage. However computation in biometric devices is computed in other way, which will be described later.Light intensity emitted by LED passing through arterial blood is decreasing with distance. This is expressed by Lamberts law [1]. Assume that la is length of artery which the light passes, Iin is initial intensity of light, C0 is concentration of oxyhemoglobin, Cr is concentration of deoxyhemoglobin,  means absorption coefficient of oxyhemoglobin on wavelength
  and
and  is absorption coefficient of deoxyhemoglobin on wavelength
  Formula which represents Lamberts law is as follows [6]:
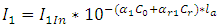 | (3.2) |
 | (3.3) |
As soon as the absorption level is detected, we can define the ratio between oxyhemoglobin and deoxyhemoglobin on different wavelengths. In this case we assume that light is fully absorbed. The ratio of absorbed light depends on systolic contraction.This value is variable, because systolic contractions are not instant. In oxygen saturation, this effect is called AC component and it represents absorption of light by oxyhemoglobin and deoxyhemoglobin. Furthermore there is DC component which is bound to absorption of light due to venous blood, non-pulsative blood and intensity of light from source.DC is constant and involves phenomena mentioned above. These values define R factor (liveness factor). According to R factor it is possible to define whether subject is alive (i.e. real user with valid access) or not (impostor).During scanning of the input signal there is also noise, which is not undesirable. Noise can be reduced using convolution, when smoothing filter is used on red and infrared signals. R factor is then a value that serves to compute oxygen saturation. Values AC and DC are bound to intensity of light. However, division of AC values, which are functions of light, would produce incorrect result, therefore following formula has to be used [5]: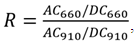 | (3.4) |
where AC660 and AC910 are values for red and infrared light, DC660 and DC910 are values for red and infrared light.The above described method is used in oximeters. If computing oxygen saturation from R factor, empirically verified curve is used. Most of oximeters use standard curve, due to cost of using device, which would calibrate curve on its own, is large. The graph on Fig. 3.3 shows computing oxygen saturation based on R factor. It is the function [7] 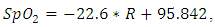 | (3.5) |
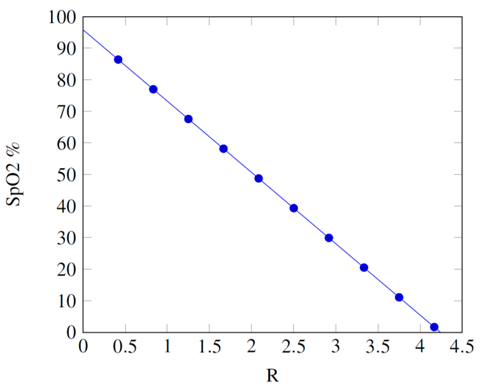 | Figure 3.3. Absorption of light on different wavelengths |
However, the function mentioned above does not compute oxygen saturation for higher values. Common values of oxygen saturation should be between 95 to 100 percent. When using the function above, maximal value would be 91.322 for R = 0.2.
4. Device for Optical Capturing of Skin Samples
Device for optical capturing of skin samples [6] consists of three main parts – illuminative modules, source for regulated power supply of illuminative modules and capturing device itself.
4.1. Source for Regulated Power Supply of Illumination Modules
When designing source for regulated power supply of illuminative modules there were two options taken into account. These options were source of constant electric current or source of constant voltage. One of the tested power supplies of constant electric current was using the integrated circuit TL062SMD. As it turns out its lowest level of current to 50 mA, this could be too much for some diodes. Other sources have a similar problem that is why we selected the source of constant voltage. For voltage regulation integrated circuit LM317 was used. Connection of the source and other elements can be seen in the block diagram in Fig. 4.2. Input voltage was experimentally determined to 12 V. LM317 regulates voltage in range from 1.25 V to maximal input voltage. We need to regulate the voltage from 0 V. This was solved by adding voltage with opposite polarity to the control part of the regulator. This voltage was set by trimmer to -1.25 V. Because of this we can regulate voltage from 0 V to maximum input voltage minus 1.25 V. [6]During tests of this solution in working condition it turns out that it is necessary to have separated power source for each regulator and also for each voltmeter (V-meter) and ammeter (A-meter). With only one power source there were interactions among above mentioned parts. An updated scheme which was used in final product is in Fig 4.1. [6]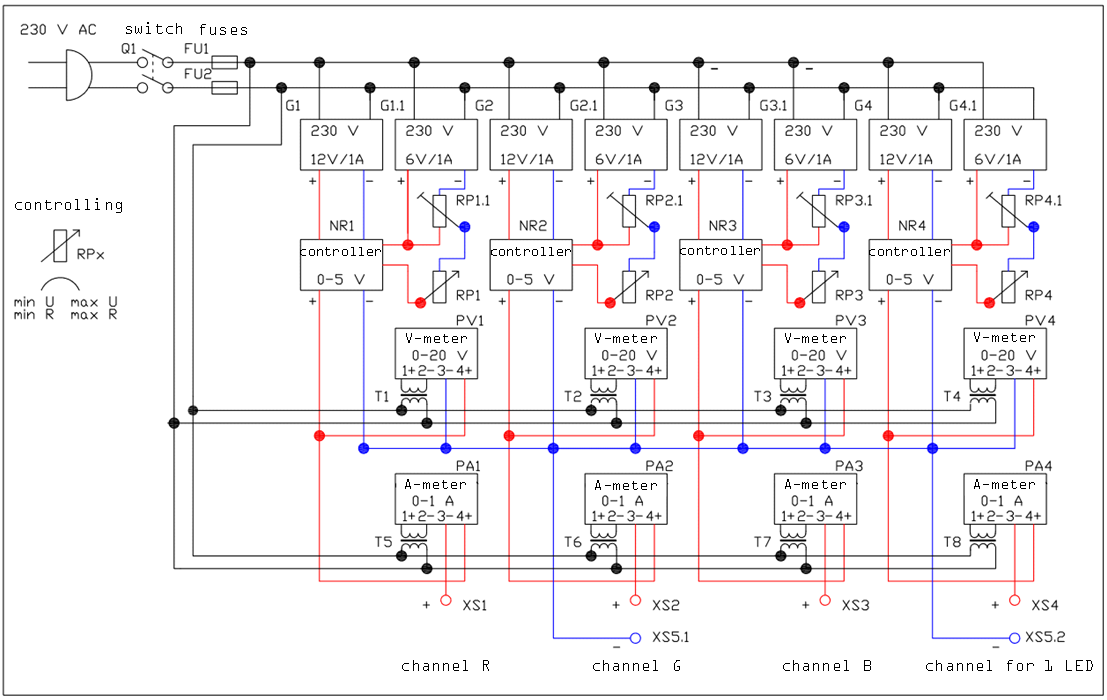 | Figure 4.1. Final version of the block diagram [3] |
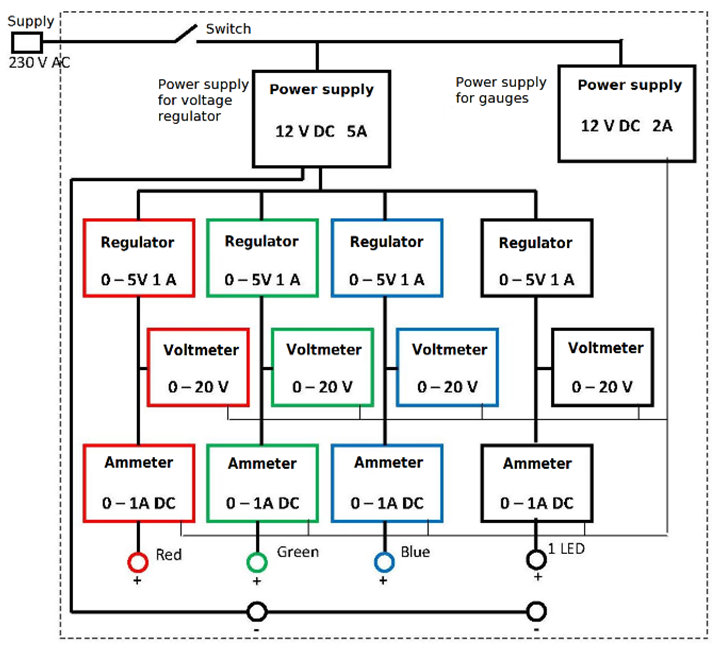 | Figure 4.2. Originally designed block diagram [6] |
4.2. Illuminative Modules
As a main light source there were chosen several types of power LEDs. After some sorting 3 diodes were chosen for experiments. First power LED (3 W IR-LED) is using infrared light with wavelength of 850 nm, second is ultraviolet LED (LL-HP60MUVA) with wavelength of 400 nm and third one is RGB (three channel) LED (OF-HPRGB-1SL) with wavelengths of 630 nm for red channel, 530 nm for green channel and 470 nm for blue channel. Diodes were installed on holder including passive cooling system so they do not burst. [6]
4.3. Capturing Device and Capturing Itself
As a capturing device there were the following possibilities: digital single-lens reflex camera with macro lens, webcam or digital microscope. We selected (because of its properties) the digital microscope Dinolite Pro AM413T.By each volunteer there was captured the intermediate phalanx of the index finger from top and bottom side. Capturing itself was done in dark room for the most possible elimination of surrounding light. In further processing several operations were implemented – they follow:Ÿ I component of the greyscale image,Ÿ R component of the RGB model,Ÿ G component of the RGB model,Ÿ B component of the RGB model,Ÿ C component of the CMY model,Ÿ M component of the CMY model,Ÿ Y component of the CMY model,Ÿ Y component of the YUV model,Ÿ U component of the YUV model,Ÿ V component of the YUV model,Ÿ Y component of the YCbCr model,Ÿ Cb component of the YCbCr model,Ÿ Cr component of the YCbCr model,Ÿ Morphological dilation, element 3×3,Ÿ Morphological erosion, element 3×3,Ÿ Sobel op. for edge detection, x axis, element 3×1,Ÿ Sobel op. for edge detection, x axis, element 3×3,Ÿ Sobel op. for edge detection, x axis, element 5×5,Ÿ Sobel op. for edge detection, y axis, element 3×1,Ÿ Sobel op. for edge detection, y axis, element 3×5,Ÿ Sobel op. for edge detection, y axis, element 5×5,Ÿ Sobel op. for edge detect., x and y axis, element 5×5,Ÿ Sobel op. for edge detect., x and y axis, element 7×7,Ÿ Adaptive thresholding,Ÿ Histogram equalization,Ÿ Canny edge detection.In Fig. 4.3 we can see in a) original image captured by blue channel of RGB LED (470 nm) and in b) to o) resulting images from various image processing operations. [6]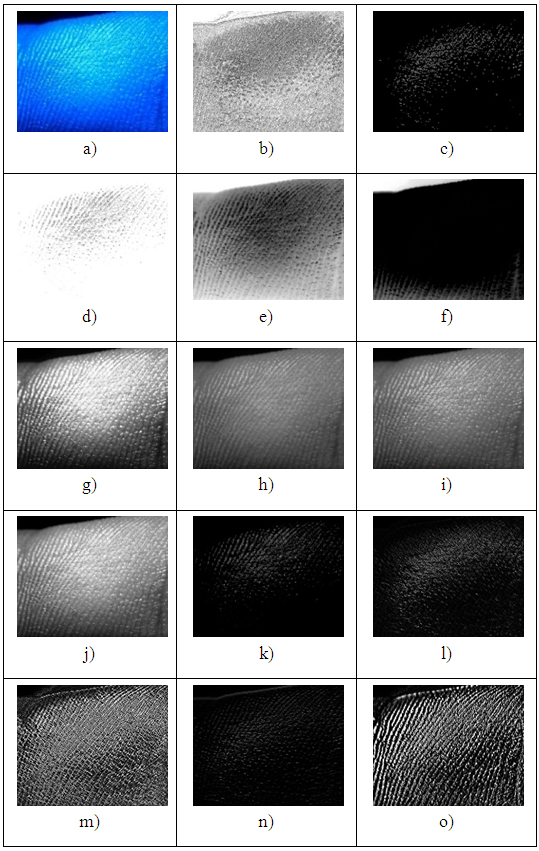 | Figure 4.3. Sample of images from device (a) and various image processing operations used on it (b-o) [6] |
5. Experiments
5.1. Experiments with Oxygen Measurement
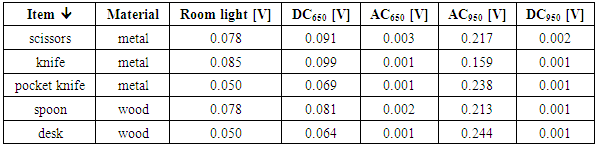
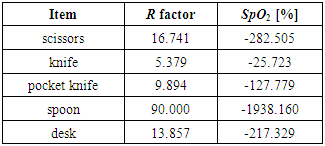
Construction of device was inspired by the device constructed in India. This device should be able to recognize false fingertips from the real ones. It works on the principle of switching LEDs, which emit light on wavelengths of 650 nm and 950 nm. The device switches between these two wavelengths. These wavelengths are absorbed differently by oxyhemoglobin and deoxyhemoglobin. Used LEDs are HLMP-4101 (manufacturer AVAGO Technologies) and SFH409-2 (manufacturer OSRAM). Opposed to these LEDs, there is photodiode, which detects light and is shown as voltage on voltmeter. Range of voltmeter was from 0 to 2 V. The type MATRIX MPS-3005L-3 served as a voltage source. Red diode was powered by 2.1 V and current was 0.9 A. Infrared diode was powered by 1.3 V and current was 0.14 A. When using the device, finger is inserted between LED and photodiode. Finger must be between these two diodes, which are vertically opposed. When measuring, common light has to be subtracted, because it negatively affects results. To reduce the common light to minimum, room, where measurement took place, was dark with no lights on. Furthermore black fabric covered photodiode to reduce common light. Experiments were conducted several times to achieve more accurate results.The conducted experiments were aimed to cover many cases that could appear in a real environment. Among tested subjects were:Ÿ wooden and metal items;Ÿ representative of Negroid and Mongoloid race;Ÿ representatives of Caucasian race without nail polish;Ÿ various nail polish used on Caucasian race;Ÿ various fake fingerprints;Ÿ various fake fingerprints with nail polish.Experiments with wooden and iron itemsMetal and wooden items were chosen because of possible usage to access the systems. During experiments three metal items and two wooden items were used. Results of experiments were as expected – oxygen saturation within these items is not in acceptable interval which would refer to live sample. Results are shown in Tab. 5.1 and Tab. 5.2. Values AC650 and AC950 should be minimal or zero, because there is no blood in these items, which would influence them. Deviations which are in these values in the table could have been influenced by movement of the item during scanning. However, results show that this method is able to recognize them even if AC650 and AC950 are not zero.Table 5.1. AC and DC values for wooden and metal items
 |
| |
|
Table 5.2. R and SpO2 values for wooden and metal items
 |
| |
|
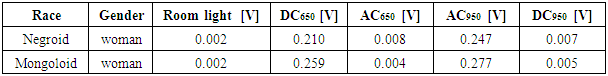
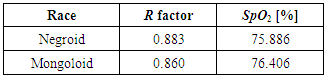
Experiments with representatives of Negroid and Mongoloid raceRepresentatives of Negroid and Mongoloid race were chosen to determine whether color of skin has influence on measurement or not. The device should be able to recognize representatives of these two races. However, only two experiments were conducted, which is just small sample to determine usefulness of this method for these two races.Results of experiments can be seen in tables Tab. 5.3 and Tab. 5.4. It seems that color of skin has no or minimal influence on the result based on these two experiments. However, as stated above, it is needed to perform more experiments.Table 5.3. AC and DC values for Negroid and Mongoloid representatives
 |
| |
|
Table 5.4. R and SpO2 values for Negroid and Mongoloid representatives
 |
| |
|
Experiments with representatives of Caucasian race without nail polishThese experiments were most frequent because of number of subjects. Experiments were conducted on men and women. Results are summarized in Fig. 5.1 and Fig. 5.2. All test subjects had oxygen saturation over 60%. This is very different from the normal behavior. On some subjects even oximeter was used to show real oxygen saturation and lowest value was 83%. This shows that used calibration curve is not ideal and measurement itself is not that accurate as measurement with oximeter. However, conducted experiments with fake fingerprints showed that device is relatively able to recognize between dead and live sample and most of subjects in this category were found live. One measurement showed mismatch, but it was because of slight movement that subject made during scanning.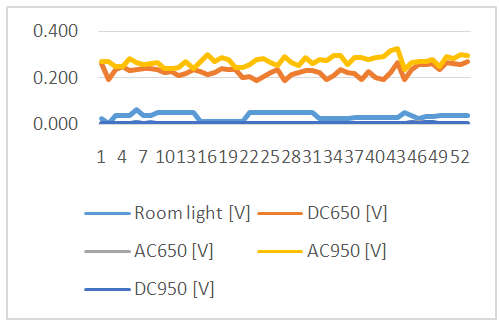 | Figure 5.1. Graph with AC and DC values for Caucasian representatives without nail polish (# 44 till 53 are women, otherwise men) |
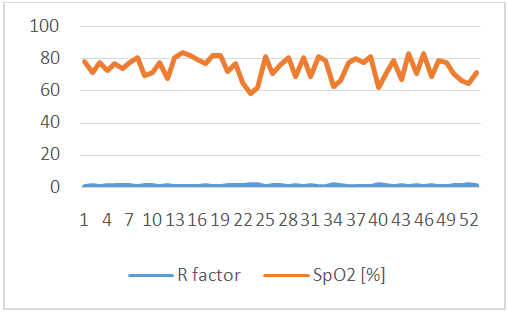 | Figure 5.2. Graph with R factor and SpO2 values for Caucasian representatives without nail polish (# 44 till 53 are women, otherwise men) |
Experiments with nail polish on representatives of Caucasian raceAim of these experiments was to determine whether nail polish affects value of R factor. Subjects had red, purple, violet, dark blue, see-through and black nail polish. The results are summarized in Fig. 5.3 and Fig. 5.4. These results show that nail polish affects detected level of oxygen saturation. When the subject used dark nail polished, it reduced detected oxygen saturation and therefore declared subject as dead. The greatest impact of nail polish was encountered when detecting DC650 value. When subject used red or see-through nail polish, detected DC650 value did not appear to change that much. This is because of light absorbance of dark nail polishes.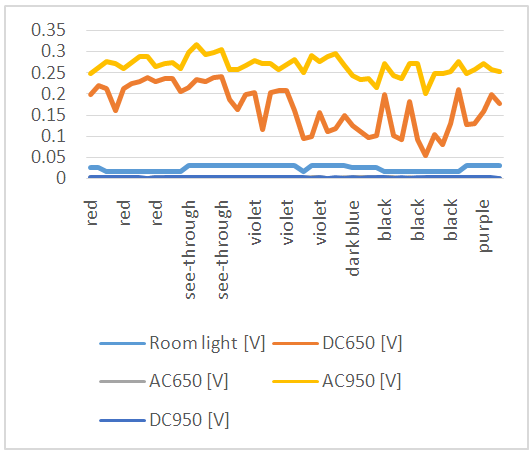 | Figure 5.3. Graph with AC and DC values for Caucasian representatives various nail polishes |
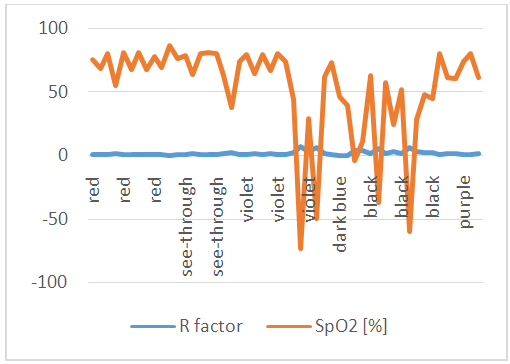 | Figure 5.4. Graph with R factor and SpO2 values for Caucasian representatives with various nail polishes |
Experiments with various types of fake fingerprints and nail polishDuring these tests, subjects had various types and colors of fake fingerprints, i.e. wax, silicon and rubber. Aim of this experiment was to successfully identify all fake fingerprints. Results are shown in Fig. 5.5 and Fig. 5.6. These results show that oxygen saturation method is suitable for detection of fake fingerprints made of rubber or silicon, but if impostor used wax, it would not detect him/her, because of different light absorption by wax and rubber or gum. Remaining experiments apart from wax were found dead. The same experiments were conducted with fake fingerprints and nail polish, results can be seen in Fig. 5.7 and Fig. 5.8. Results are as expected – wax fake fingerprints with red nail polish were found live, all the others samples were found dead.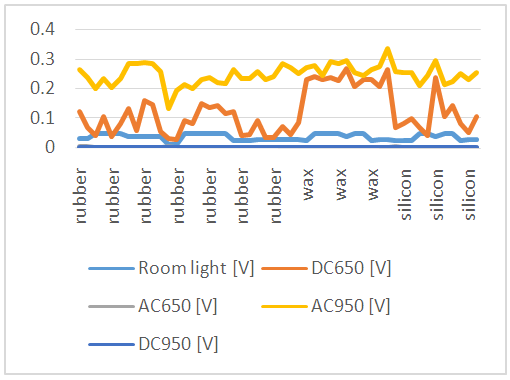 | Figure 5.5. Graph with AC and DC values for finger fakes made of various materials |
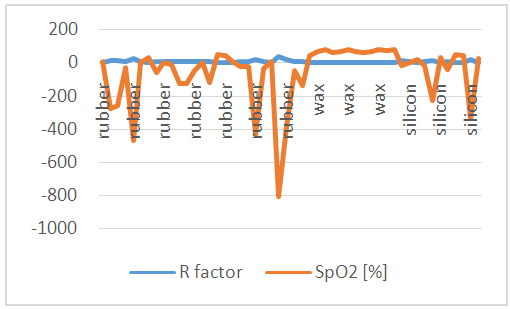 | Figure 5.6. Graph with R factor and SpO2 values for finger fakes made of various materials |
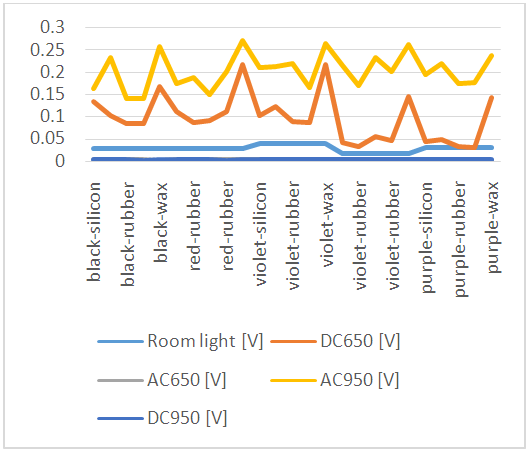 | Figure 5.7. Graph with AC and DC values for finger fakes made of various materials with applied nail polish |
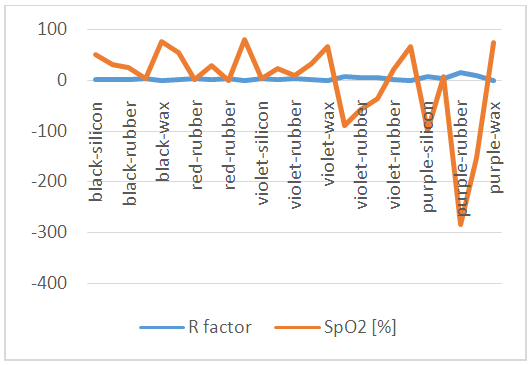 | Figure 5.8. Graph with R factor and SpO2 values for finger fakes made of various materials with applied nail polish |
5.2. Results from Experiments
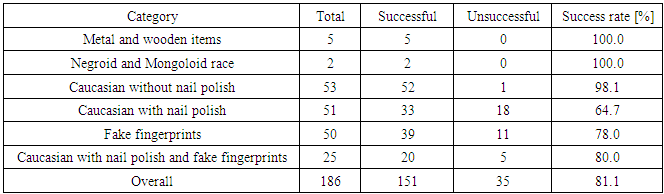
Conducted experiments showed strengths and weaknesses of the device and oxygen saturation method. As stated above, oxygen saturation is method, which can be influenced by many factors. Experiments which were conducted showed, that if subject uses dark nail polish it affects detected oxygen saturation. If subject used fake fingerprint, he/she was found dead in most cases except for case when he/she used fake fingerprints made of wax.Some experiments show large deviation, this might have been caused by slightly moved LED or photodiode or by subject’s movement during scanning. In Tab. 5.5 there are results of all experiments with total number of conducted experiments, total number of successful experiments, total number of unsuccessful experiments and percentage of success. Value of oxygen saturation to access the system was set to 60%.Table 5.5. Results for all conducted experiments
 |
| |
|
Device is least trustworthy when the test subject uses nail polish. Oxygen saturation does not refer to real values in human body, because of different types of used LEDs.These LEDs were not in device for which was the calibration curve made. This curve was also used in these experiments. However, even if oxygen saturation did not match real oxygen saturation, this device is relatively able to determine liveness of sample.Lower success rate was due to experimenting with same fake fingerprints to determine, whether they really affects this method and device or whether it was just a coincidence. [8]
6. Conclusions
We described realized experiments in the area of skin optics for biometric systems based on fingerprint recognition, incl. experiments with finger fakes for support of development of methods for liveness detection (anti-spoofing). We still work on another methods for analysis of skin optical properties to build a reliable and robust detector of living skin tissue not only for fingerprint acquirement technology, but for other biometric systems, based on acquirement of human body parts with skin.
ACKNOWLEDGEMENTS
This work was supported by The Ministry of Education, Youth and Sports of the Czech Republic from the National Programme of Sustainability (NPU II) – project IT4Innovations excellence in science - LQ1602 and BUT internal grant “Reliability and Security in IT” FIT-S-14-2486 and the fellowship research activity at the Tokyo Institute of Technology supported by the Matsumae International Foundation (Japan).
References
| [1] | Drahanský, M.: Fingerprint Recognition Technology - Related Topics. LAP LAMBERT Academic Publishing GmbH & Co. KG, 2011. p. 172. ISBN: 978-3-8443-3007-6. |
| [2] | Kanich, O.: Fingerprint Damage Simulation – A Simulation of Fingerprint Distortion, Damaged Sensor, Pressure and Moisture, LAP LAMBERT Academic Publishing GmbH & Co. KG, 2014, p. 57. ISBN 978-3-659-63942-5. |
| [3] | Krishnaswamy A., Baranoski G.V.G. A Study on Skin Optics, Natural Phenomena Simulation Group, School of Computer Science, University of Waterloo, Canada, Technical Report CS-2004-01, January 2004, p. 17. |
| [4] | Reddy P.V., Kumar A., Rahman S.M.K. a Mundra T.S. A new method for fingerprint antispoofing using pulse oximetry. First IEEE International Conference on Biometrics: Theory, Applications, and Systems, p. 6, 2007. ISBN 978-1-4244-1596-0. |
| [5] | Crihalmeanu M.C. Adding liveness detection to the hand geometry scanner. Master Thesis. West Virginia University, p. 104, 2003. |
| [6] | Doleželová L.: Design and construction of device for skin optical capturing, Bachelor thesis, Brno University of Technology, FIT, 2014, p. 39. |
| [7] | Atesł G., Polat K. Measuring of Oxygen Saturation Using PulseOximeter Based on Fuzzy Logic. Medical Measurements and Applications Proceedings (MeMeA), p. 16, 2012. ISBN 978-1-4673-0880-9. |
| [8] | Javorský D.: Biometrical liveness detection – optical characteristics, Bachelor thesis, Brno University of Technology, FIT, 2014, p. 51. |

 Abstract
 Reference
 Full-Text PDF
 Full-text HTML