-
Paper Information
- Paper Submission
-
Journal Information
- About This Journal
- Editorial Board
- Current Issue
- Archive
- Author Guidelines
- Contact Us
International Journal of Optics and Applications
p-ISSN: 2168-5053 e-ISSN: 2168-5061
2016; 6(2): 21-30
doi:10.5923/j.optics.20160602.01

Laser Energy Density and Spatial Modulation for Enhanced Detection and Velocity-Position Measurements of Circulating Tumor Cells in a Silicon Blood Vessel Phantom
 Abstract
 Reference
 Full-Text PDF
 Full-text HTML
Jeremie Cosette1, 2, Patrice Flaud2, 3, Sylvain Fisson1, 4, 5
1Genethon, Evry, F-91002, France
2Laboratoire Matière et Systèmes Complexes UMR 7057, Paris 75205 cedex 13, France
3Université Paris 7 Diderot 75205 Paris cedex 13, France
4Inserm, U951, Evry, F-91002, France
5Univ Evry, UMR_S951, Evry, F-91002, France
Correspondence to: Jeremie Cosette, Genethon, Evry, F-91002, France.
| Email: |  |
Copyright © 2016 Scientific & Academic Publishing. All Rights Reserved.
This work is licensed under the Creative Commons Attribution International License (CC BY).
http://creativecommons.org/licenses/by/4.0/

Early detection of circulating tumor cell (CTCs) has been shown to be crucial for diagnosis and choice of therapeutic strategies in cancer disease. Several techniques have been described for early in vivo CTCs detection, for most, based on optical phenomena, especially fluorescence. However, native fluorescence in living tissues often makes it difficult to detect specific fluorescence. We describe here a fluorescence-based technique that allows enhanced detection of fluorescence and relative velocity measurement of CTCs in a blood vessel phantom. The technique relies on an easy-to-implement signal processing method and, on a spatial and energy modulation of the illuminating source. The original excitation light’s pattern gives a CTC a specific signature to improve detection (signal to noise ratio increased) and distinguish artifacts. The relative velocity is related to position inside the blood vessel phantom by the Poiseuille flow equation; most of cells are circulating in a ring located between 60% and 80% of the radius. Detection enhancement of fluorescent particles with this approach is very relevant in the context of conventional cytometry, especially for small particles, for which the signal to noise ratio is weak. Further, the application of this method on GFP-positive cell lines, widely used, yet very sensitive to tissue absorption, could give information on the way CTCs flow in vessels.
Keywords: Time of flight, Laser spatial modulation, Laser energy modulation, Fluorescence detection, Lymphoma, Circulating tumor cell, Flow cytometry, Velocimetry
Cite this paper: Jeremie Cosette, Patrice Flaud, Sylvain Fisson, Laser Energy Density and Spatial Modulation for Enhanced Detection and Velocity-Position Measurements of Circulating Tumor Cells in a Silicon Blood Vessel Phantom, International Journal of Optics and Applications, Vol. 6 No. 2, 2016, pp. 21-30. doi: 10.5923/j.optics.20160602.01.
Article Outline
1. Introduction
- Early circulating tumor cells detection remains a challenge and is crucial to understand metastasizing processes and increase treatment efficiency [1, 2]. Different techniques [3] are now available to early detect circulating tumor cells (CTCs) in small animal in vivo, in a non-invasive way. In vivo flow cytometry (IVFC) has been first described for detecting fluorescent red blood cells of tumor cells in the blood flow, in different organs (e.g. mesentery blood vessels or ear blood vessels) [4-7]. However, most of actual flowing-cell detection devices are focused on multi-channel detection and quantification of circulating tumor cells in the vascular system.We addressed the question of accurately measuring the relative velocity of circulating cells. Evaluate and measure the velocity of cells in a blood vessel in vivo could help in understanding cellular spreading mechanisms in different types of models, from metastases dissemination to stem cells tissue mobilization. Conventional Doppler ultrasound allows measuring the speed of a fluid within a tissue. However, some applications were described, such as laser Doppler flowmetry that can not only access the velocity of blood flow in a blood vessel, but an estimation of the velocity of light-absorbing particles [8]. Different techniques were developed for both measuring the flow velocity or red blood cells (RBC) velocity. From videocapillaroscory [9], to phosphorescence imaging [10] through videomiscroscopy and image processing algorithms, all these techniques are focused on the measurement of RBC velocity [11, 12]. The in vivo flow cytometer initially described [4] offers a way to estimate the velocity of other cell types by measuring the full width at half maximum of the generated peaks on the raw fluorescent signal. The in vivo imaging flow cytometer described later also offered to measure the cell velocity [13]. A multi-illumination system using photo-acoustic flow cytometry previously described generates multiple signal peaks, thus enhancing detection, and allowing the calculation of time of flight [14]. Here we describe a modulated double illumination ex vivo flow cytometry device coupled with a signal processing method, which allows measuring the velocity of cells flowing in a blood vessel phantom. The device requires a single illumination source and a single detector. We tested the device with a GFP-expressing murine B lymphoma cell line (A20.IIA-GFP) previously described [15, 16]. With this approach we have been able to measure the time of flight (tof) of circulating tumor cells and to link this tof with the position of each cell inside the blood vessel phantom.
2. Material
2.1. Cells
- A20.IIA is an FcγReceptor-negative clone originating from the A20-2J murine B-lymphoma cell line. A20.IIA-GFP are A20.IIA cells transfected with pEGFP-N1 plasmid (Promega) using nucleofector® system (Lonza). The cells are maintained at 37°C, 5% CO2 in complete Roswell Park Memoral Institute 1640 Medium Glutamax plus (RPMI; Gibco- Invitrogen, France) supplemented with 10% fetal calf serum (FCS; PAA laboratories, Germany), 100 µg/mL penicillin and 100 µg/mL streptomycin (both from Eurobio, France), 10 mM sodium pyruvate (Gibco-Invitrogen), 50µM β-mercaptoethanol (Gibco-Invitrogen), and 0.5mg/mL G418 sulfate (Invivogen).
2.2. Laser
- The laser used is 488 nm Diode-Pumped Solid-State Laser (DPSS), with a 100mW maximum output power (Oxxius – Opton Laser International – France), and 0.6 mm output diameter. The transverse electromagnetic mode is Gaussian at 99% (TEM00 99%).
2.3. Optics
- Lenses, prisms, polarizer, mounts, filter and dichroic mirror are from Thorlabs Inc. – Germany. The objective is a 10X, air, 0.32 Numeric Aperture (LEITZ WETZLAR – Germany), and the detector is a photomultiplier tube (H10722-20), controlled and supplied with its corresponding stable power supply (Hamamatsu – Japan). The anamorphic prisms duet extends one direction of the laser beam by a 3:1 ratio. The calcite prism splits the laser beam into two parallel but orthogonally polarized beams separated by 4 mm. A cylindrical lens contributes to extend more the laser beam in the same direction than the anamorphic prisms duet. Before being focused by the microscope objective, the excitation light is composed by two parallel laser slits. After the objective, the dimensions of the slits are reduced; the two slits are still parallel, yet orthogonal to the blood vessel phantom. The Gaussian slits of light full width half maximum (FWHM) were measured around 700µm.Fluorescence light is gathered by the same objective, is selected through a dichroic beam splitter (edge wavelength 505nm), is focused by the association of two achromatic lenses, is filtered by a bandpass filter (515 nm – 545 nm), and is finally turned into electric signal through the 10-dynodes photomultiplier tube (Fig. 1).
2.4. Signal Acquisition
- The signal is acquired using a NI USB-6211 acquisition card (National Instruments – U.S.A.) and is recorded using LabVIEW software (National Instruments – U.S.A.). The analog signal is digitalized in a 14-bits converter, and acquired at a rate of 8000 samples per second.
2.5. Signal Processing
- The signal is processed and the velocity of cells is measured using MATLAB software (Mathworks – U.S.A.).
2.6. Statistical Analysis
- Comparisons used unpaired one-way t-test and were performed with GraphPad Prism (GraphPad Software, La Jolla, CA). Statistical significance was defined by p values less than 0.05.
2.7. Silicon Blood Vessel Phantom
- We modeled a blood vessel using a polydimethyl siloxane (PDMS – silicon) phantom (SILGUARD), in which a 120µm-diameter tube is embedded.
2.8. Flow Cell
- The cell suspension (45 000 cells.mL-1) is put in a syringe, and a syringe-pump imposes a constant output at 1mL.h-1. The output of the cell suspension corresponds to an actual mean velocity in the blood vessel phantom around 5mm.s-1, which corresponds to the physiological mean velocity of cells for this vessel diameter.
3. Results
3.1. Patterned Excitation Gives the Cell an Unique Fluorescence Signature
- To detect circulating cells inside the phantom, we designed a double slit excitation pattern. The excitation light is provided by a 488nm laser. The laser beam is split into two excitation slits of light orthogonally polarized. The beams are converted into slits by the association of an anamorphic prisms duet and a cylindrical lens (Fig. 1A). These slits are focused on the channel inside the silicon phantom, orthogonally to flow direction through a microscope objective (Fig. 1B). The width of each slit is larger than the tube diameter. To obtain an unbalanced power distribution in each slit, the laser beam is first polarized by a polarizer filter. The fluorescence signal from a single cell is thus a double-peak, each peak corresponding to an illumination slit. Those two peaks have not the same amplitude due to the unbalanced power distribution (Fig. 1C), which gives a specific signature for the cell signal. Hence, the signal of interest (i.e. the fluorescence signal) can be easily identified.
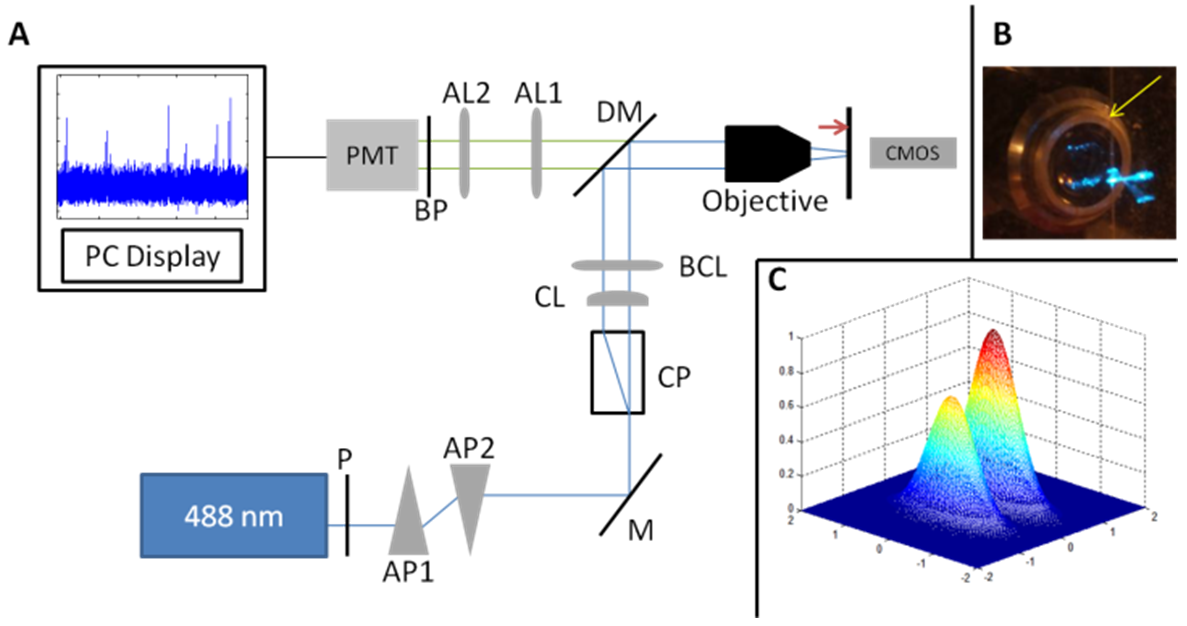 | Figure 1. (A) Schematic of double-slit illumination ex vivo flow cytometer experimental device. The round-shaped laser light is turned into a slit by an anamorphic prisms duet (AP1 and AP2) and a cylindrical lense (CL), the slit is doubled with a polarizing calcite prism (CP), and the slits are focused on the phantom channel with a microscope objective (10X, 0.2 N.A). The fluorescence from the cells flowing in the phantom channel is collected by the same objective, and is gathered by a photomultiplier tube (PMT), after being selected by the dichroic beam splitter (DM – edge wavelength 505nm) and focused with two achromatic lenses (AL1 and AL2). BP: Bandpass filter (515-545 nm). P: Polaroid. AP1 and AP2: anamorphic prisms duets. M: mirror. CP: Calcite prism. CL: cylindrical lens. BCL: Biconvex lens. DM: Dichroïc mirror. AL1 and AL2: Achomatic lenses. PMT: Photomultiplier tube. (B) Picture of the blood vessel phantom illuminated with the unbalanced power slits of light. The channel (yellow arrow) is 120µm diameter and the slits of light is about 700µm x 100µm. (C) Energy density in the observation plane (i.e. in the channel plane) |
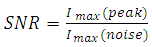
3.2. The Signal Processing Method (SPM) Dramatically Increased the Signal to Noise Ratio (SNR)
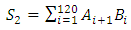
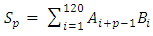
- The signal processing method was designed to eliminate stochastic fluctuations of autofluorescence background noise. The method relies on an optimal averaging of the signal, assuming that the mean of the aufluorescence background noise is 0. The amplitude of the noise’s fluctuations decreases as the number of points used for the mean calculation increases. When the mean is calculated on few points, the fluctuations of the noise may not be decreased; on the other hand, when calculated on a too high number of points, sliding mean may smoothen the signal of interest.On the raw signal, a cell generates a double peak; each peak is about 120 samples long (data not shown). According to this observation, we calculate the 120-sample-long mean of the raw signal; we then weight the mean with the coefficients of a Gaussian-shaped function, which corresponds to the ideal signal from a fluorescent cell. A1, A2, A3, … , An are the values of the raw signal from the detector. The acquisitions last for about 1 min, which means that n is around 500000.B1, B2, B3, … , B120 are the values of the Gaussian-shaped function
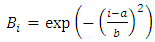 | (1) |
 To obtain the first point of the filtered signal (sn), we apply this formula:
 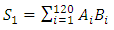 | (2) |
 | (3) |
 | (4) |
 | (5) |
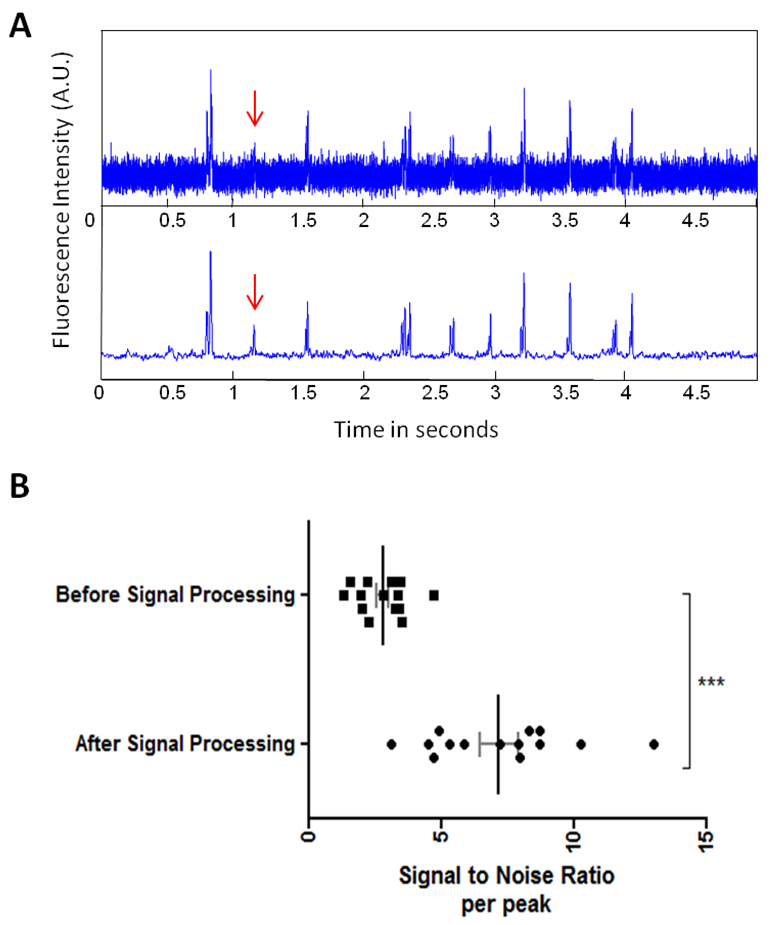 | Figure 2. (A) Representative signal after filtering using the Gaussian weighted sliding mean. The raw signal is treated with the noise reduction method, and the signal over noise ratio is dramatically increased as can be seen on the filtered signal and on the chart (A-B). The double-peaked signal from a cell is isolated from background noise. Some cell signals are sometimes barely detectable in the raw signal but are fully extracted from noise using the noise extraction method (red arrow). (B) Representative SNR values before and after signal processing. The Signal Processing Method significantly increases the SNR (*** p<0.0001) |
3.3. Double-Slit Modulated Illumination Eliminates Artifacts and Allows Velocity Calculation
- As the energy density of each slit of light is different (the first slit encountered by the flowing cells is less energetic than the second one – Fig. 1B – 1C), the fluorescence signal is spatially modulated. Thus, the signal from a cell has a specific signature: two close peaks – the delay between those peaks depending on the velocity of cells. The first peak is always less intense than the second one. A double peak from a cell can be distinguished efficiently from a single-peaked artifact (Fig. 3).
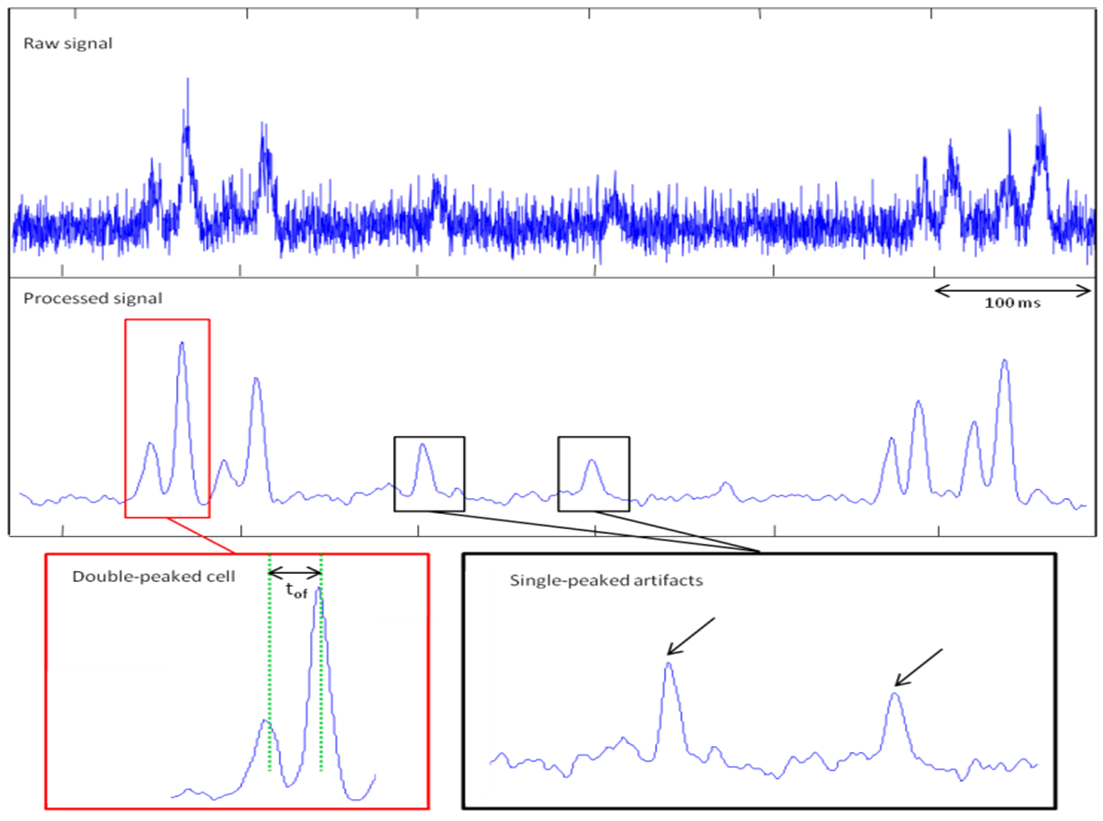 | Figure 3. Representative signal obtained from the device. Raw signal and filtered signal are represented here. The double-peaked signal from a cell (red box) can be distinguished from single-peaked artifacts (black boxes). The maxima of the double peak are precisely located and the time of flight is measured between these two maxima |
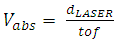 | (6) |
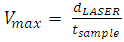 | (7) |
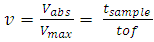 | (8) |
 does not depend on dLASER. As only the maximum of each peak is considered to measure the time of flight and thus relative velocity, those measurements do not depend on the cell signal amplitude (Fig. 3).
3.4. Position of Cells within the Vessel can be deduced from the Relative Velocity Measurements
- The viscosity of a cell suspension does vary with concentration [17]. However at the concentration of 45 000 cells.mL-1, and with the flow velocity of 5 mm.s-1, the cell suspension viscosity can be considered equal to PBS buffer viscosity. Moreover, the slits of light are focused sufficiently far (3cm) from the beginning of phantom channel to be sure the flow is fully developed and perfectly laminar. These conditions allow considering the flow as a Poiseuille flow, in which the velocity distribution follows a parabolic profile. Parabolic velocity profiles in hamster microvessels were indeed shown to be a good approximation [18].The assumed parabolic velocity profiles follow this law:
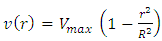 | (9) |
 | (10) |
 of the cell and its position inside the blood vessel phantom (Fig. 4A).
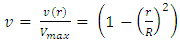
  is the maximum velocity when r = 0, r being the radial position and R the radius.We represented the measured relative velocity
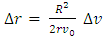
  for each cell against r/R (Fig. 4A scatter plot, and bar chart).Each bar of the chart corresponds to a Δv that can be associated to a Δr by differentiating equation (8).
 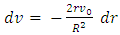 | (11) |
 | (12) |
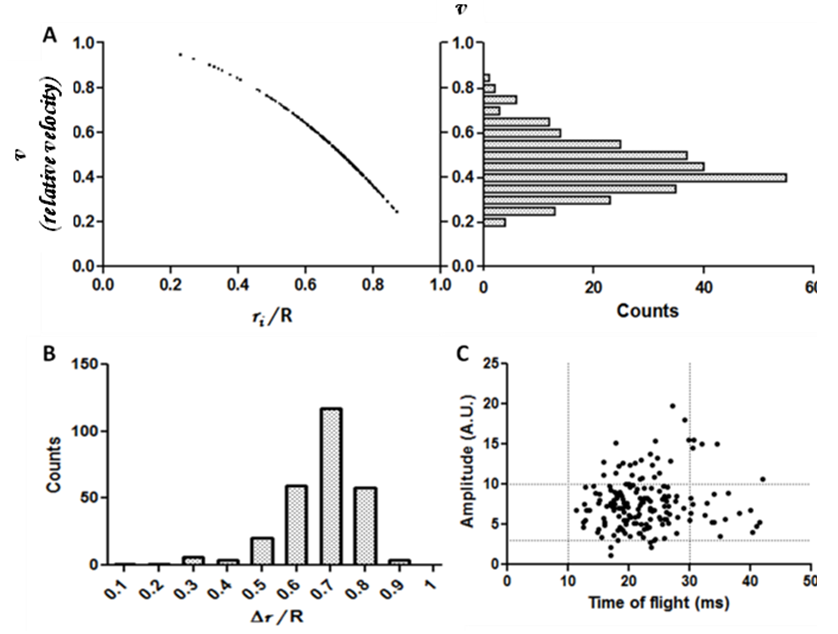 | Figure 4. The relative velocity (computed from the time of flight) is plotted against position; each dot represents a cell (A – left). The velocity distribution (A – right), assumed to be parabolic, allows to calculate the position distribution (B), which shows that most of cells are located between 60% and 80% of the radius. No correlation can be observed between time of flight and amplitude however most of cells are located between 10 and 30 ms time of flight and between 3 and 10 a.u. for fluorescence intensity |
3.5. Doublets Resulting Signals
- We observed different types of specific signals coming from doublets of cells, which were more difficult to interpret. The signal depends both on the energy pattern of the two slits of light (the second one is more intense than the first one) and on the distance between the two cells (dcell-cell) in relation to the distance between the two excitation slits of light (dLASER). If dcell-cell < dLASER, the resulting signal will be a double peak from the first slit of light, and a double peak or very intense peak, which would be the sum of the two peaks from each cell from the second slit of light (Fig. 5-case 1). If dcell-cell = dLASER, the first peak of the second cell and the second peak of the first cell are melted together in a very intense fluorescence peak. This results in a three-peaked signal where the middle peak is more intense than the two others (Fig. 5-case 2). If dcell-cell ∼ dLASER, but dcell-cell > dLASER the signal is close to the previous case, but we can detect the first peak of the second cell at the end of the intense middle peak (Fig. 5-case 3). All those signals, in which the time of flight remains difficult to measure and is operator-dependant, were not taken into account in the velocity – position analyses.
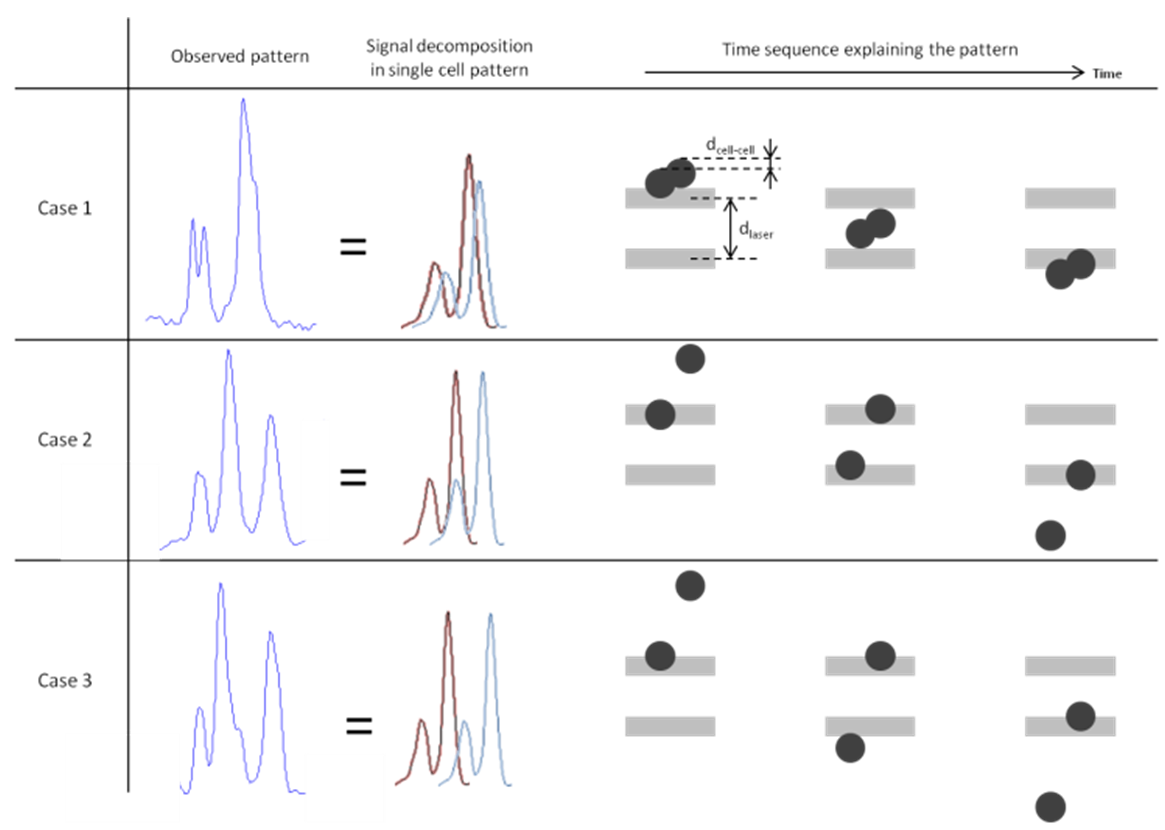 | Figure 5. Different cases of doublet of cells, and their specific signal patterns. Case 1: the distance dcell-cell < dLASER provides two peaks at the beginning and two melted peaks when encountering the second excitation slit. Case 2: dcell-cell = dLASER and the signals from each cell, excited by each slit give a triple-peaked pattern where the intense middle peak is the integration of the peaks of each cell. Case 3: dcell-cell > dLASER but close to dLASER; the pattern is close to the case 2 pattern, but the signal from the second cell at the end of the signal from the first cell can be seen. Those patterns were excluded of the analysis |
4. Discussion
- Using this system, we are able to measure time of flight, but we cannot accurately measure the distance between the two slits of light because we cannot precisely measure the depth of the channel in the silicon phantom. Moreover, the beams that come from the microscope objective are divergent; therefore the distance between the two slits of lights will depend on the distance between the channel and the objective. We cannot thus measure the absolute velocity of cells. This is why, to avoid uncertainty, we choose to work on relative velocities (v).
4.1. Laser Power Distribution and Cell Signal Amplitude
- The amplitude of the signal from a cell first varies because of the power density of each slit of light as already explained, yet other parameters can influence the amplitude of the signal. The laser power distribution is Gaussian, but the size of the slit is around 7 times as bigger as the size of the channel inside the silicon phantom, making the approximation of a constant power density in the channel acceptable. However there is still a slight decrease (due to laser beam geometry (Fig. 1C)) of the laser power along the radius of the channel – the channel is centred with the beam.The signal varies according to excitation light, but also varies according the fluorescent protein expression. In conventional cytometry, this cell population has fluorescence intensity signals that cover about a decade (data not shown). That means that the signal from the most fluorescent cell may be ten times as higher as the signal from the less fluorescent cell, thus inducing variability in the amplitude. We can observe this variability in the amplitude, where the lowest fluorescence amplitude is around 2 arbitrary units (a.u.) and the highest signal is around 20 a.u. (Fig. 4C)
4.2. Laser Beam Modulation and Specific Cell Signal
- A very efficient laser beam modulation system was described in 2012 [19]. The laser was modulated with a mask giving a unique excitation pattern, and thus a very recognizable signal from fluorescent cells. The fluorescence was time encoded and a spectral analysis allowed to extract very efficiently the signal from the background noise. Yet, in the case of our system, the time encoding was not possible.To enhance fluorescence detection, we could have used a two peak Gaussian-shaped function (Bi). Each double peak from a cell would have given three peaks in the “filtered” signal. However, we would have lost the information of time of flight, and the distance between the two peaks of the Gaussian-shaped function would have had to change to fit all the two-peaked cell signals, resulting in very heavy calculations and thus long processing time. That is why we worked with the single-peak Gaussian shaped function, which allows the velocity calculation for a reasonable time of execution, and offers a substantial increase of SNR.
4.3. Computation Method
- The computation method described here is actually a sort of cross-correlation between the raw signal and a reference signal on a very brief time. The Gaussian-shaped function is indeed 120 samples long, which correspond to 15 ms (8000 sample.s-1). Usually, techniques using correlation calculation for velocity measurement require two detectors: the fluorescence light from each excitation slit is independently gathered with two detectors and the inter-correlation of the two signals is then calculated. Here we propose a method that requires only one detector and no additional optics such as separating prisms or filters.In the case where two (or more) very close cells pass under the laser beam, we detect a composite signal (Fig. 5), and it remains difficult to separate the signal coming from each individual cell. Nevertheless, in physiopathological conditions of a cancer, the number of CTCs is very low [20], and the case where two CTCs are at the same time at the same place barely happens.
4.4. Influence of Laser Light on Cells
- We used a 100mW output power blue 488 nm solid state laser. The laser energy is partly deposited in the cells. This might have several effects on cells such as increasing the local temperature or even phototoxicity that may induce cell death. In the case of tumor cells in an in vivo context, cell death is obviously an advantage and even therapies called photodynamic therapy are based this phenomenon [23]. Finally the key question remains on tissue absorption in case of in vivo application. In terms of tissue absorption, blue light more absorbed by tissue than red light. Most of murine models of cancer rely on widely used GFP positive cell lines, although very recent red and far red fluorescent proteins are becoming more and more used, and are more suitable with in vivo experiments.
4.5. Time of Flight, Velocity and Position Measurement
- When a peak from a cell corresponds to the Gaussian-shaped function, the S function (cf Results part) presents a maximum. Estimating the width of a peak to extract the cell’s time of flight remains imprecise and depends on the threshold chosen to define the beginning and the end of the peak. After filtering, the signal from a single cell is a double peak extracted from the noise (Fig. 3). The delay between these two maxima is equal to the time of flight of the cell. There is no more consideration of the beginning or the end of a peak to determine the tof value as it was performed in previous studies [5]. Furthermore, in our system, the energy modulation gives the cell a signature easily distinguishable from an artefact. The width of the peak also depends on the geometry of the beam, which depends itself on the laser wavelength. Changing the wavelength would change the value of tof if calculated using the peak width. With our method, the tof is indeed determined by the delay between two maxima, which correspond each to the best fitting between the whole cell signal and the Gaussian-shaped function; resulting in a more accurate measurement, independently of laser wavelength.
4.6. Relative Velocity Distribution and Cell Adhesion
- The silicon phantom channel edges have clearly different physical properties than the inner surface of a blood vessel in terms of elasticity and cell adhesion. The interactions between the cells and the inner surface of the phantom channel are different than the ones between the endothelium of a blood vessel and a CTC. We observed (data not shown) that a single PBS wash for 3 minutes is sufficient to eliminate any remaining fluorescent event, and a microscope control of the channel shows that no cells adhere to the inner surface of the blood vessel phantom. However, in vivo studies on small animals reported a dramatic increase of cell adhesion subsequently to light exposure [24], which could in turn favour the metastatic process. We did not observe this phenomenon in the blood vessel phantom, which obviously have different properties than a real blood vessel. Furthermore, the exposure time in our setting is very low (10ms to 50ms). Those interactions between cells and inner surface of blood vessel might change the rolling properties and thus the velocity distribution – from physiological distributions – as it is well-know that cells flowing in a blood vessel can roll on the inner surface – especially tumor cells [21]. We here described relative velocity distribution circulating cells in a low viscosity medium (e.g. PBS). Nevertheless, flow singularities in vivo can induces punctual changes in the velocity distribution. In this study we assimilated the circulating cells to fluid particles. The limit of this analysis is what happens at the edges of the blood vessel phantom. A rolling cell is likely to have a lower speed than any other flowing cell, whatever would be its position. The method described in this study could identify – by analyzing the velocities – rolling populations from flowing populations. As rolling is the first step of tumor cells extravasation [22] which is critical determinant in most cases of metastasis; analyzing rolling population could help understand metastatic spread mechanisms.
5. Conclusions
- Here we described a method for enhanced detection of circulating tumor cells, and a signal processing method that eliminates the autofluorescence background noise and gives access to a precise value of the time of flight. We linked the time of flight (and the relative velocity) to the cell position within the blood vessel phantom, based on the use of Poiseuille flow equations. The system is based on a single laser-detector couple, and on a quite easy-to-use and not RAM-consuming signal processing method, which can be implemented for real-time background noise elimination.The double-illumination cytometry could be used for in vivo experiment, using wavelength more suitable with living tissues, to access the velocity and increase the signal over noise ratio. The autofluorescence background noise in vivo is indeed very high at 488nm. However, it remains important to work at this wavelength because GFP+ cell lines associated to murine models are still widely used in the field of cancer research.
ACKNOWLEDGEMENTS
- This research was supported by the Institut National de la Santé et de la Recherche Médicale, the Paris Descartes University, the Paris Diderot University, the Pierre & Marie Curie University, the University of Evry Val d'Essonne (UEVE), the Actions Thématiques Incitatives de Genopole (ATIGE), and the France Lymphome Espoir funds. J.C was supported by the Frontiers in Life Science PhD program, and by a fellowship from the INCA (Institut National du Cancer). We wish to warmly thank Catherine Sautès-Fridman and Hervé Fridman for support, Alexandra Fragola and Vincent Loriette, Claude Boccara and Jean-Claude Jeanny for helpful discussion.