Abdessitir Deraoui , Alain Cornet , Pierre Defrance
Institute of Condensed Matter and Nanoscience (IMCN), Nanophysics (NAPS), Université Catholique de Louvain, Belgium
Correspondence to: Abdessitir Deraoui , Institute of Condensed Matter and Nanoscience (IMCN), Nanophysics (NAPS), Université Catholique de Louvain, Belgium.
| Email: |  |
Copyright © 2015 Scientific & Academic Publishing. All Rights Reserved.
This work is licensed under the Creative Commons Attribution International License (CC BY).
http://creativecommons.org/licenses/by/4.0/

Abstract
The most vivid colors in nature arise from the interaction of light with surfaces that exhibit periodic structure on the micro- and nanoscale. In the wings of butterflies, for example, a combination of multilayer interference, optical gratings, photonic crystals and other optical structures gives rise to complex color mixing. Although the physics of structural colors is well understood, it remains a challenge to create artificial replicas of natural photonic structures [1-3]. Here we use a combination of microfabrication techniques, to fabricate hemispherical photonic structures that mimic the color mixing effect found on some natural species. The idea of this work is to show that it is possible to perform laboratory surfaces with hemispherical cavities whose properties are similar to these natural structures.
Keywords:
Optical properties, Thin film, Hemispherical cavity, Microfabrication, Bioinspired structures
Cite this paper: Abdessitir Deraoui , Alain Cornet , Pierre Defrance , Optical Properties of Bioinspired Hemispherical Structures, International Journal of Optics and Applications, Vol. 5 No. 6, 2015, pp. 187-192. doi: 10.5923/j.optics.20150506.02.
1. Introduction
Optical interference coatings have always been used to control light and waves, and the community of thin films has today reached a high level of expertise for all design, production and characterization techniques of these micro-components. However most of these filters are produced on plane substrates, and are hence designed for the control of specular light which is reflected and transmitted according to the Snell/Descartes relationships. For some biophotonic applications [4], a demand exists to overcoat hemispherical structures in order to reach specific properties similar to those of natural cavities with spectacular properties. However, the analysis of certain insects using the optical microscope provides interesting results. Indeed, the microstructure in the wings of an Indonesian male butterfly Papilio palinurus [5], for example, generates an extraordinary combination of two iridescent colors: yellow and blue. These colors are results from a modulation imposed on the multilayer, the production of the blue component as a result of a retro-reflection process. Their surfaces comprise two dimensions network of concavities responsible of these colors. Another interesting example is the Calidea panaethiopica [6]. The insect’s cuticle is not smooth, but covered with small hemispherical holes. These cavities have two distinct colors, namely a central point of yellow surrounded by a blue-turquoise color disc. Between these cavities, the bright surface of the insect is yellow. We distinguish the presence of a multilayer thanks to the electronic microscopy. We found a relatively conventional multilayer structure, commonly found in iridescent insects. In fact, this periodic multilayer comprises layers of chitin and mixed layers composed of chitin and air. The idea of this work is to show that it is possible to perform laboratory surfaces with hemispherical cavities whose properties are similar to these natural structures. In the current paper, the fabrication process of a proposed hemispherical polysilicon shell standing on a hemispherical silicon cavity is demonstrated. This micro fabrication process combines both bulk and surface micromachining, which include the isotropic wet etching, a mask design, the thick photo resist coating and exposure, and high-aspect-ratio curved sacrificial technique. These structures were overcoated by an artificial multilayer in order to produce the iridescence observed on Chrysochroa vittata [1].
2. Microfabrication of the Structures
This section describes methods and major steps for producing samples with cavities based on natural structures where optical properties can be interesting. We will review typical bio-inspired photonic structures and focus on the biomimetic fabrications.
2.1. Photolithography
Photolithography is the process of transferring geometric shapes on a mask to the surface of a silicon wafer. The wafer is uniformly coated with a thick light sensitive liquid called photoresist. Portions of the wafer are selected for exposure by carefully aligning a mask between an ultraviolet light source and the wafer. In the transparent areas of the mask, light passes through and exposes the photoresist. Photoresist hardens and becomes impervious to etchants when exposed to ultraviolet light. This chemical change allows the subsequent developer solution to remove the unexposed photoresist while leaving the hardened, exposed photoresist on the wafer. The wafer is subjected to an isotropic etch process (either wet acid or plasma dry gas etch) to remove that portion of the nitride layer that is not protected by the hardened photoresist. This leaves a nitride pattern on the wafer with quasi-hemispherical structures under the openings of the mask. The hardened photoresist is then removed (cleaned) with another chemical.
2.2. Wet Etching Silicon
We used a solution of hydrofluoric acid and nitric acid, the proportions are as follows: 49% of HF, 70% of HNO3 and deionized H2O.
2.3. Etching Parameters
The wet etching technique allows etching according to u and v-directions to obtain hemispherical shapes.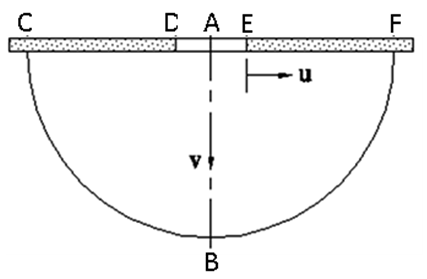 | Figure 1. The schematic diagram illustrates the relation of etching rate and diameter |
The table below shows the steps of etching the silicon versus time.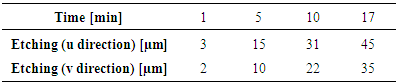 The cavity’s parameters are: [A-B] = 45 µm, [C-F] = 115 µm.The horizontal etch rate is different from the speed of vertical etching, which was obtained the hemispherical form.
2.4. The Coating
The structures were finally overcoated by an artificial multilayer in order to produce the iridescence observed on Chrysochroa vittata [1]. Indeed, the chitin plate (n=1.56) present in natural structures was replaced by a layer of silicon monoxide SiO (n=1.9) and the nickel Ni (n=1.85) replaced the air layer. The purpose of choosing nickel is simply to produce a periodic perturbation in order to open the one-dimensional photonic gaps. The multilayer alternates a silicon monoxide layer 170nm thick with 10nm layer nickel spacer.The deposition of SiO was made by evaporation from an electrically heated (by Joule effect) tantalum crucible, and the coating of nickel was applied by the evaporation of a nickel cathode, impacted by accelerated electrons driven by the static magnetic field of a permanent magnet.
3. Measurement
3.1. Materials and Methods
The spatial distribution of the light scattered by the surfaces was visualized with a scatterometer (figure 2) widely described [1] [7]. The imaging scatterometer projects the full hemispherical scattering on a digital camera.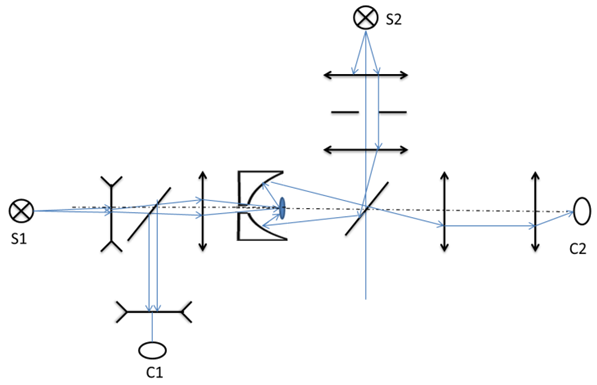 | Figure 2. Diagram of the imaging scatterometer |
The primary beam is supplied by first light source S1, focused by lenses at the sample. The axially back-scattered (reflected) light that returns throughout a small hole in the reflector is then, via a half-mirror, focused at a first digital camera C1 (near field scattering). A secondary beam reaches the sample via beam splitter and an ellipsoidal reflector. The angle of incidence of the secondary light beam at the sample can be varied. Light that is back-scattered by the sample in off-axis directions is reflected by the ellipsoid. The sample’s far-field scattering pattern thus is imaged in the back-focal plane and focused at a second digital camera C2. Furthermore, using only the primary beam with camera C2 allows the measurement of the scattering pattern as a function of the angle of incidence, however only for light incident in a plane perpendicular to the rotation axis. The dependence of the scattering pattern from any angle of incidence can be measured by using the secondary light beam.
3.2. Imaging Scatterometry and Spectrometry
A spatial and spectral analysis of the reflectance samples with hemispherical cavities was made by the scatterometer (figure 2). The object was illuminated with the primary beam, delivered by light source S1 via diaphragms and lenses, and/or by the secondary beam, from light source S2 via diaphragms, lenses and half-mirror (figure 2). The light scattered by the object into the frontal hemisphere was focused by the elliptical mirror in its second focal plane and imaged by lens in its back focal plane, which thus received the object’s spatial distribution of scattered light. The scattered light pattern of plane was imaged by lens onto camera C2. (figure 2)We have characterized two samples having the same structure of hemispherical cavities, but with differently treated surfaces. There are two structured silicon substrates periodic hemispherical cavities, untreated and the second on which we filed a multilayer as described above. We characterized the sample without multilayer for comparison.Microscopic imaging gives us a glimpse of these two samples (figure 3).  | Figure 3. 0ptical microscope imaging samples microstructured (a) without multilayer surface (The white line represents a scale of 100). (b) surface with multilayer. Focus on the flat portion of the sample. (c) surface with multilayer. Focus on the sample hemispherical cavity. (d) with polarizing filter |
Analysis of the samples studied using an optical microscope provides useful results. Indeed, as we can see from the images in figure 3, the sample surface is covered with hemispherical holes. For normal incident light, the flat areas between two hemispherical cavities and bottom of each of them appear orange for the sample with the multilayer. The characterization by the scatterometer was made in two steps: - First, we illuminated by the quasi-parallel primary beam, open to the dimension of one hemispherical cavity, and we have observed in the perpendicular illumination, blue light into two narrow strips, and passing through the center (figure 4).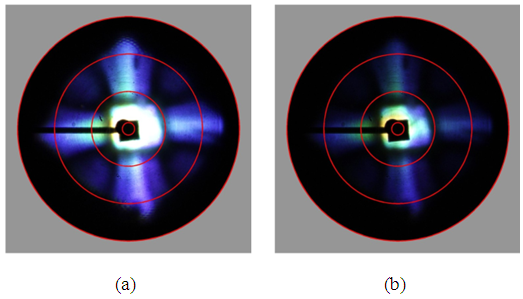 | Figure 4. Near field distribution diagram of the hemispherical cavity created by the primary beam with different angular apertures (a) wide light spot (b) small light spot |
The blue color cannot be retro-reflected by one inclined multilayer system at 45° to the incident direction. The effect is in fact caused by a pair of multilayer surfaces that are on opposite sides in each concavity. The incident light reflected from a surface inclined at 45°, is directed to the second side located on the opposite side, where it is returned back along the direction of incidence. These pairs of inclined surfaces with identical multilayer allowed to change the characteristics of the spectral reflectivity; causing a reflectivity of less intense blue color after this double reflection. To demonstrate that this phenomenon is due to polarization, we noticed that when we put two crossed polarizers (a linear input polarizer and output analyzer) when viewing the sample under a normal incident light, reflected orange color disappeared, in contrast to the blue color that is visible and apparent, proving that the blue color of the reflected light has undergone a polarization conversion. (Figure 5).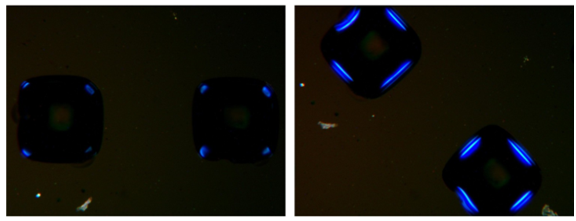 | Figure 5. Microscopic image of the microstructured surface with crossed polarizers |
- After that, we illuminated an area of the sample surface, comprising a grating period of hemispherical cavities, with an opening angle of 180° (secondary beam) that gives color to each angle of incidence on the flat surface. It’s a characterization of the multilayer according to the angle and the wavelength.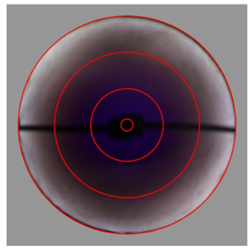 | Figure 6. Far-field distribution sample without coating at all angles created by the non-polarized secondary beam. The black object in the middle is the glass micropipette holding the sample. Red circles indicate the distribution of angles θr = 5°, 30°, 60° and 90° with a non-polarized light, reflected by the surface of the sample without coating. Violet-blue is characteristic of silicon nitride color that ranges from 0° to 45°, and that changes to gray for larger angles |
From the reflectance spectra measured on different sample regions (figure 7), we can see that the reflectance spectrum measured on the flat part (figure 7 spectrum shown in red) in our sample corresponds perfectly to the characteristic reflectance spectrum of silicon and confirms the color perceived by the naked eye. We find a more red color that comes from the edges of the hemispherical concavities (figure 7 spectrum shown in green) and a scattering of white light throughout the visible spectral range (figure 7 spectrum shown in blue) coming from the bottom of the cavities.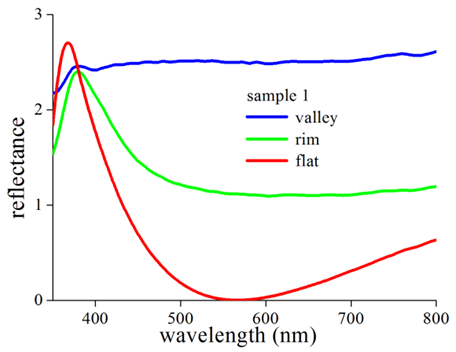 | Figure 7. Reflection spectra measured on different regions; red spectrum: flat part. Green spectrum: the edge of the hemispherical concavity. Blue spectrum: bottom of the cavity |
Regarding the second sample with the multilayer, the model of the angular distribution is substantially circular and symmetrical. There is a scattering of light at all angles, confirming the phenomenon of iridescence. Figure 8 confirm that the multilayer is at the origin of the phenomenon of iridescence. The dominant color at normal incidence was orange which changes to yellow and then to green by increasing the angle of incidence. For larger wavelengths, we see a large white reflective strip.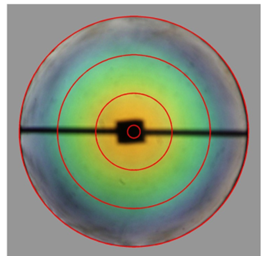 | Figure 8. Dissemination in the far field of the sample with multilayer at all angles created by the non-polarized secondary beam |
The variation of the color is evident from optical microscopy. For normal incident light, flat areas between two hemispherical cavities and bottom of each of them appear in orange, and the inclined sides of each concavity appear with less intense blue color (figure 9), which explains the no blue reflections in fig.8. It is the juxtaposition of these orange and blue regions that synthesizes the orange-green color seen by the human eye, because they are too small to distinguish separately. It is indeed the "additive synthesis" of light: red, green and blue are the three primary colors of this synthesis.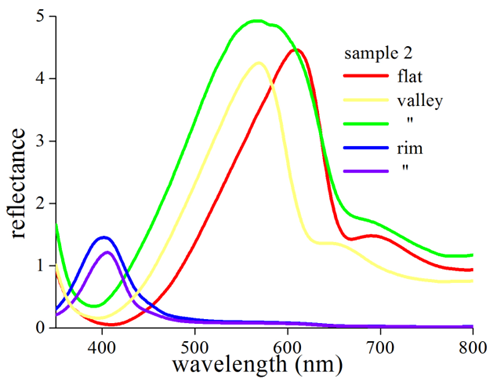 | Figure 9. Reflection spectra measured on different areas of the sample with multilayer |
These experimental measurements will be compared in detail with theoretical results in the following part.
4. Modeling and Simulation Results
Reflectance calculations are numerically modeled from experimental topographic measurements. The “physical” aspect of our simulation work therefore consists in using experimentally measured data, and not the creation of a purely theoretical model. For this, we measured the 3D profile of a pattern of a hemispherical cavity and then we determined the ratio of the thicknesses of the layers deposited on the flat part and concave structure to adjust the theoretical coating.Ray-tracing modeling a hemispherical cavity was conducted using facets. It also corresponds to a period of the network constructed to model the surface of the sample.Once a beam comes in contact with the modeled surface, Maxwell's equations are solved locally to the same multilayer we introduced experimentally whose parameters are encoded in the program, using the transfer matrix method.The result of the simulation for hemispherical concavities is a double reflection of blue (spectrum shown in black in figure 11). Against by the spectrum shown in red in figure 11 shows the specular reflectance of the flat portion of the sample.These theoretical spectra will be compared with experimental spectra. The main peak of the flat portion (figure 11) represents an orange color (558nm). This confirms that the multi-layer is responsible for the color of our sample. The multireflection in the concavity is represented by the secondary peak at 395 nm with low intensity. As shown in figure 10 the existence of hemispherical cavities has the effect of causing the double reflection of part of incident rays, ie those which face the curved edges of these cavities. An interesting property follows: iridescence is a reverse effect.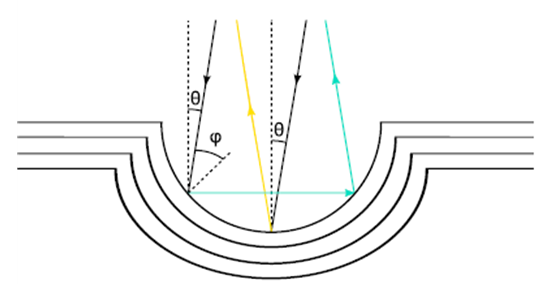 | Figure 10. Schematic representation of hemispherical cavity. The incident rays are either reflected once by the flat bottom of the structure, is reflected twice by the edges of the cavity producing the blue color |
The relationship between the local angle of incidence  and the overall incidence angle
  is given by the equation (1):
 | (1) |
The position of the secondary peak, linked to the double reflection, can be found by adapting the equation (2). It is given by the equation (3):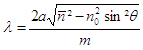 | (2) |
 average refractive indexa is the sum of the thicknesses of thin films
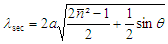 | (3) |
Therefore, if the angle of incidence  increases, the wavelength of this secondary peak also increases. The color appearance of sequence is reversed as the angle of incidence increases. Indeed, usually in the case of a multilayer, the fact of increasing the angle of incidence has the effect of causing a blue shift of the reflectance, or a shift towards smaller wavelengths.Returning our case, wherein the incident angle is 5°, we can calculate the positions of the reflectance peaks of the flat portion and curved edges of the hemispherical cavities. In terms of the main peak, corresponding to the flat part of the hemisphere, its position is given by the equation 2 (for m = 1):
 As for the secondary peak, its position is given by equation 3:
 These two values to be compared to those obtained from the spectra of the simulation. The agreement is almost perfect because the experimental main peak was around 558 nm. These values correspond to a yellowish green color. We also notice a contribution from the right side of the main peak (fig.11) that corresponds to the color red. The orange color is perceived by the naked eye is actually due to the contribution of these two peaks.
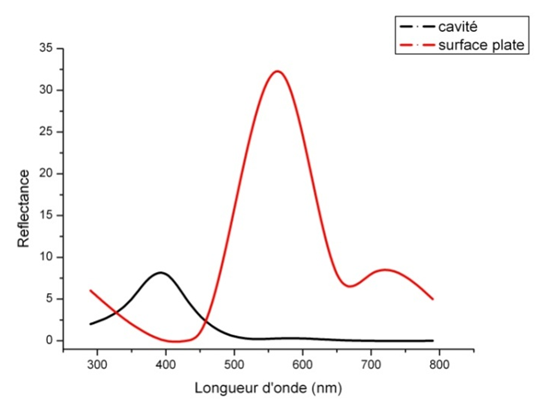 | Figure 11. Theoretical reflectance spectra of bio-inspired 5° incidence structure; red spectrum: sample flat surface. Black Spectrum: hemispherical cavity |
These experimental results are in good agreement with theoretical calculations (fig.11).
5. Conclusions
Modeling the hemispherical shaped structure combined with a multi-layer wide wavelength of the incident rays, causes beyond the orange color due to the multilayer, a blue color on the edges of the cavities. This is due to the fact that the rays striking the edges of these cavities encounter a curved multilayer, which has the effect of modifying the orange blue coloration caused by the phenomenon of multiple reflection. These rays, undergoing a double reflection, are less intense, which is why the secondary peak intensity is lower than the main peak. They also have the peculiarity of having an iridescence reversed as we have demonstrated above.This is a phenomenon of iridescence structures combining two separate scales. First, a multilayer on a scale close to the wavelength of the incident rays. On the other hand, a surface structure at the micrometer scale. The ray tracing program was used to model the interaction of light with this multi-level structure, in perfect harmony with the experimental measurements.
ACKNOWLEDGMENTS
This investigation was conducted with the support of Communauté Française de Belgique through ARC project 10/15-033 “Propriétés optiques des structures naturelles et artificielles”. We thank Prof. Doekele G. Stavenga for the scattering measures performed within the University of Groningen, Department of Applied Physics.
References
| [1] | A. Deraoui, K. Mallat, A. Cornet, P. Defrance, “Optical properties of micro and nanostructured bioinspired materials”, International Journal of Optics and Applications, 4(2): 31-39 (2014). |
| [2] | D. L. Fox, Animal Biochromes and Structural Colors (University of California Press, Berkeley, CA, 1976). |
| [3] | M. Srinivasarao, Chem. Rev. Washington, D.C. 99, 1935(1999). |
| [4] | J.P. Vigneron, J.-F. Colomer, N. Vigneron and V. Lousse, “Natural layer-by-layer photonic structure in the squamae of Hoplia coerulea (Coleoptera),” Phys. Rev. E 72, 061904 (2005). |
| [5] | Mathias Kolle, Pedro M. Salgard-Cunha, Maik R. J. Scherer, Fumin Huang, Pete Vukusic, Sumeet Mahajan, Jeremy J. Baumberg & Ullrich Steiner “Mimicking the colourful wing scale structure of the Papilio blumei butterfly”, Nature Nanotechnology 5, 511–515 (2010). |
| [6] | Jean Pol Vigneron, Moussa Ouedraogo, Jean-François Colomer, and Marie Rassart, “Spectral sideband produced by a hemispherical concave multilayer on the African shield-bug Calidea panaethiopica (Scutelleridae)”. |
| [7] | D. G. Stavenga, M. A. Giraldo, and B. J. Hoenders, ''Reflectance and transmittance of light scattering scales stacked on the wings of pierid butterflies,'' Opt. Express 14, 4880-4890 (2006). |
| [8] | Stavenga, D. G., Leertouwer, H. L., Pirih, P. & Wehling, M. F. 2009 Imaging scatterometry of butterfly wing scales. Opt. Express 17, 193–202. (doi:10.1364/OE.17. 000193). |
| [9] | Stavenga, D. G., Giraldo, M. & Leertouwer, H. L. 2010. Butterfly wing colors: glass scales of Graphium sarpedon cause polarized iridescence and enhance blue/green pigment coloration of the wing membrane. J. Exp. Biol. 213, 1731–1739. (doi:10.1242/jeb.041434). |

 Abstract
 Reference
 Full-Text PDF
 Full-text HTML