-
Paper Information
- Paper Submission
-
Journal Information
- About This Journal
- Editorial Board
- Current Issue
- Archive
- Author Guidelines
- Contact Us
International Journal of Optics and Applications
p-ISSN: 2168-5053 e-ISSN: 2168-5061
2015; 5(5): 147-150
doi:10.5923/j.optics.20150505.01
Optical and Dielectric Properties of Co Doped TiO2 as Judged by Simulation Analysis
 Abstract
 Reference
 Full-Text PDF
 Full-text HTML
Yasaman Abed1, Fatemeh Mostaghni2, Mostafa Khosravi1
1Department of Physic, Payam Noor University, Iran
2Department of Chemistry, Payam Noor University, Iran
Correspondence to: Fatemeh Mostaghni, Department of Chemistry, Payam Noor University, Iran.
| Email: |  |
Copyright © 2015 Scientific & Academic Publishing. All Rights Reserved.
In this paper, anatase TiO2 has been doped with three different concentrations of cobalt. Absorption, dielectric and the consequent optical nano-composite refraction constants have been calculated according to density function theory (DFT) and by using castep calculation method. LDA+U approximation has been used for correlation and exchange effects and results have been compared by experimental method. The calculations showed that by increasing Co concentration, dielectric constant will increase and structure of the main spectrum goes toward less energy which satisfies the corresponding experimental data result. Also the results showed that band gap of Co-doped TiO2 decreases with an optimal doping concentration of 20% as a result of the overlap among the Co 3d, Ti 3d, and O 2p states, which enhances photocatalytic activity in the visible light region.
Keywords: Molecular simulation, Castep, Elastic, Dielectric constant, Optical properties
Cite this paper: Yasaman Abed, Fatemeh Mostaghni, Mostafa Khosravi, Optical and Dielectric Properties of Co Doped TiO2 as Judged by Simulation Analysis, International Journal of Optics and Applications, Vol. 5 No. 5, 2015, pp. 147-150. doi: 10.5923/j.optics.20150505.01.
Article Outline
1. Introduction
- Titanium dioxide is an important member of the II-VI semiconductor family, with a band gap of 3.23 eV. Titanium dioxide has attracted the attention of many researchers because of its unique physical properties for electrical and photoelectrical applications. Under UV light illumination, TiO2 undergoes charge-transfer processes and produces electron-hole pairs on the surface. Nowadays solar cells are produced based on titanium dioxide, which can be named as the new generation of photovoltaic cells. It can be proposed as an alternative to solar cells due to its low cost [1-2].To improve its efficiency, great efforts have been made to reduce the band gap of TiO2, most of those are through doping of foreign elements such as Cr, Fe, Co, Mo, N, and C [3-5]. The titanium dioxide has three different structures, anatase rutile and brookite. It should be noted that the shapes of the crystallites vary with preparation techniques [6]. TiO2 will be usually crystallized in anatase form at low temperature. As temperature goes up, the metastable anatase phase will be changed to a stable rutile phase in a transformation. Size and morphology are two important parameters for measuring and identifying physical properties of nanoparticles which are affected by the production method. Nowadays, the development of ab initio molecular dynamics methods 1–3 within the density functional local density approximation has lead to a significant improvement in the understanding of material properties on an atomistic level [7, 8].In this study, the effect of increasing of cobalt to titanium dioxide anatase and the impact of dopant concentration have been investigated by using molecular simulations on optical and dielectric properties of nanocomposites. To investigate these properties, we performed ab-initio pseudopotential calculations with the local density approximation (LDA+U) of the density functional theory (DFT).
2. Computational Details
- Castep software has been used in this study and the calculations have been done based on density functional theory [9, 10]. To calculate the exchange-correlation energy in the Cohen-Sham equations, LDA+U approximation has been used [11]. The number of K points used to study of the optical properties is 3,000 points. TiO2 anatase has space group of 141/AMD and a tetragonal form. Titanium and oxygen atom coordinates in this crystal was at (0,0,0) and (0,0,0.23) respectively. The orbital atom structures in compounds are for titanium: 3S23P63d24S2, oxygen: 2S22P4 and cobalt: 3d74S2. Lattice parameters used for this cell were a = b = 3.7834 and c = 9.4841. The super cell 4 × 4 × 2 has been used in this study.
3. Results and Discussion
3.1. Optical Properties
- One of the optical quantities which is greatly affected by impurities is energy gap. The energy gap determines the threshold for absorption of photons in semiconductors. Here, the effect of different concentrations of cobalt dopant on energy gap has been examined. For this purpose, the absorption spectrum of cobalt doped titanium dioxide with three concentrations (15-20-25) has been simulated in the UV-Vis wavelength range, 200-800 nm. To calculate the energy gap, we use following equation [12]:
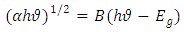 | (1) |
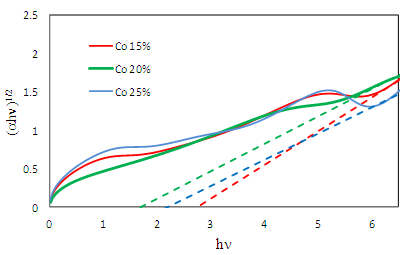 | Figure 1. UV-Vis diffuse reflectance spectra and plot (αhv)1/2 vs. photon energy of Co/TiO2 15% , 20% and 25% |
|
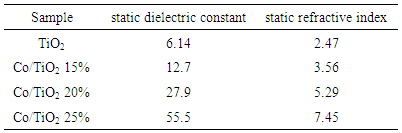
3.2. Dielectric Constant
- Complex dielectric function describes optical properties of a compound. These dielectric functions have contributions from interband (inter) and intraband (intra) electron transitions, which can be written as below [15]:
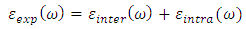 | (2) |
 | (3) |
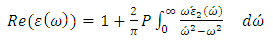 | (4) |
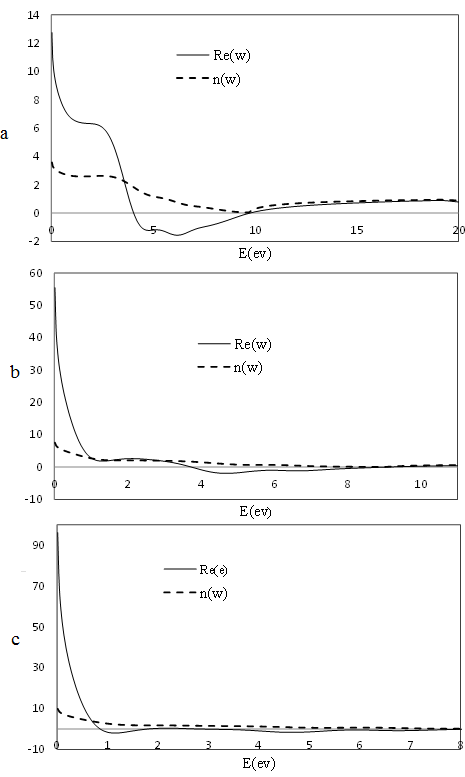 | Figure 2. The real part of the dielectric function and refractive index of Co/TiO2 15% (a), 20% (b) and 25% (c) |
|
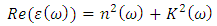 | (5) |
 | (6) |
4. Conclusions
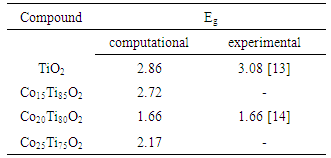
- According to the energy gap, we find that at first energy gap decreases by increasing cobalt until it reaches 20% concentration, its best rate, and the energy gap increases by increasing the concentration. Also, as cobalt increases, dielectric constant increases and structure of the main spectrum goes toward less energy. In addition, our calculations showed that the most absorption in visible region belong to Co doped TiO2 20%.
ACKNOWLEDGEMENTS
- We are thankful to the Payam Noor University for their support and encouragements.