-
Paper Information
- Next Paper
- Paper Submission
-
Journal Information
- About This Journal
- Editorial Board
- Current Issue
- Archive
- Author Guidelines
- Contact Us
International Journal of Optics and Applications
p-ISSN: 2168-5053 e-ISSN: 2168-5061
2015; 5(3): 58-64
doi:10.5923/j.optics.20150503.02
Analysis of Total Harmonic Distortion in an APD Receiver Circuit
 Abstract
 Reference
 Full-Text PDF
 Full-text HTML
Faramarz E. Seraji
Optical Communication Group, Iran Telecom Research Center, Tehran, Iran
Correspondence to: Faramarz E. Seraji, Optical Communication Group, Iran Telecom Research Center, Tehran, Iran.
| Email: |  |
Copyright © 2015 Scientific & Academic Publishing. All Rights Reserved.
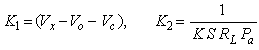
This paper presents a simple analysis on the nonlinear behavior of a practical APD receiver circuitry, by considering a silicon APD photodetector as an optical receiver. The analysis presents the effects of received input power by the photodetector and the load resistance at the receiving end on the total harmonic distortion (THD), consisting of second- and third harmonics. The behavior of the THD is formulated and graphically illustrated in terms of the input power and load resistance. Typically, for a given circuit, the second HD was found to be -71 dB, for load resistance of  and optical input power of
  If a high impedance preamplifier is used with
  the second HD will worsen to a value of -11 dB for
  The analysis is given in an easy-to-understand manner that can be readily applied to a practical system and would be useful when dealing with analog optical fiber communication systems and optical fiber sensing systems.
Keywords: Total harmonic distortions (THD), APD receiver, Load resistance
Cite this paper: Faramarz E. Seraji, Analysis of Total Harmonic Distortion in an APD Receiver Circuit, International Journal of Optics and Applications, Vol. 5 No. 3, 2015, pp. 58-64. doi: 10.5923/j.optics.20150503.02.
Article Outline
1. Introduction
- In fiber sensor circuits, particularly when operating at a wavelength of 633 nm or 830 nm, a silicon avalanche photo diode (APD) is often used as a detector in the receiver. At higher wavelengths Ge and InGaAs type of APD's with moderate gain are used for detection purposes [1-3].In analog optical communication links, in interferometric optical fiber sensors, and in analog radio-over-fiber systems, the performance at the receiving end is limited by second order nonlinearity, which is induced by the photodiode acting as the photodetector [4-13]. That is, the degree of nonlinearity of the photodiode is determined by the total harmonic distortion appearing at the output power which in particular includes the second and third order harmonic components [13]. Works have been reported to improve the linearity of photodiodes for the frequency range of 1-2 GHz. [14, 15]. In another attempt, a method was used to improve higher frequency performance of photodiodes by using Mach-Zehnder modulator (MZM) at quadrature bias with balanced detection to nullify the second order nonlinearity of photodiode at high frequencies [16].In a recent report, yet another method used dual parallel MZM to cancel out the photodiode-induced second harmonic distortion [17]. It was shown that the second harmonic generated by this method was 180 deg. out of phase of that of the photodiode nonlinearity. Recently, the nonlinearity of a commercial photodiode was measured, using three setups of a one-tone heterodyne, two-tone heterodyne and three-tone MZM designs. Mathematically developed data on multiple devices are compared to find under which conditions the measurements by three setups are comparable [18]. A new method is reported theoretically with experimental results to cancel even-order distortion induced by photodiode in microwave photonic links. A single Mach-Zehnder modulator, biased slightly away from the quadrature point, is shown to suppress photodiode second-order intermodulation distortion in excess of 40 dB without affecting the fundamental power [19].In an another report, a measurement of the nonlinearity responsivity of two commercial photodiodes of types p-n Ge and p-i-n InGaAs, used in optical fiber power measurements, was presented. The photodiodes in measurements were under high irradiance levels. It was shown that the photodiodes nonlinearities were of the saturation type, which depended on the beam diameter of the radiation source [20]. In newly reported work, a model of simulating photodiode microwave nonlinearities is proposed, which includes the effects of non-uniform absorption in three dimensions and self-heating of the photodiode. The saturated output power and third order output intercept points of two different waveguide photodiodes are simulated, with excellent agreement between measurement and theory [21].In an early work, a simple method was used to obtain harmonic distortion levels of a pin photodiode at different frequencies from the microwave reflection coefficient of the photodiode under dc illumination for different incident optical powers [22].The gain of the APD is a function of the actual bias voltage across the diode, and if the output voltage across the load resistance changes corresponding to a change in the received optical power, the bias voltage of the APD gets modulated leading to a non-linear response of the overall APD receiver. However, when receiving weak optical signals, this non-linearity will be acceptably small [23].In this paper, a simple analysis on the nonlinear behavior of a practical silicon APD photodetector circuitry is presented, by considering the gain characteristics of the APD photodiode. The analysis of the total harmonic distortion (THD), which is an indication of degree of nonlinearity in an APD photodetector, includes the effects of received input power and the load resistance at the receiving output. The behavior of the THD is formulated and graphically illustrated in terms of the input power and load resistance.The analysis is given in an easy-to-understand manner that can be readily applied to a practical system and would be useful when dealing with the optical fiber sensor systems and analog optical fiber communication systems.
2. Distortion in APD Receiver
- Figure 1 shows a practical circuit diagram of an APD receiver using a silicon APD. The resistor
 is being used to protect the avalanche photodiode from an accidental break-down, if any, by limiting the maximum possible current flow. The capacitors at the cathode of the APD keeps the voltage at the cathode
  at ac ground. Figure 2 shows the plot of the APD gain
  as a function of the bias voltage, obtained experimentally. Around the break-down voltage of the APD, the gain of the receiver increases rapidly.
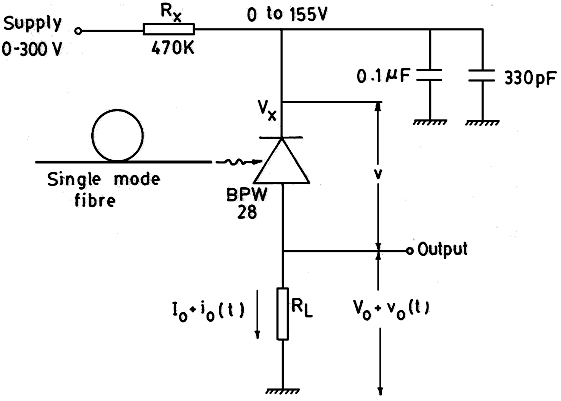 | Figure 1. Circuit diagram of the APD receiver |
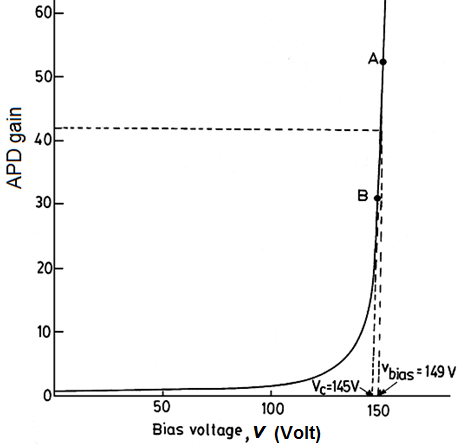 | Figure 2. Characteristic curve of the APD gain at 5 kHz as a function of APD bias voltage for a peak ac optical input power  |
 and the ac output voltage
  For a given dc bias voltage
  at the cathode of the APD (in Fig. 1), the actual voltage
  across APD changes with the output voltage as
 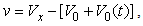 where
where  is the dc voltage across
  At a given average optical power level,
  and
and  will remain constant but
  will change with the modulation in the optical power. Since
  itself is a function of the actual APD bias voltage, distortion results when the output voltage modulates the APD gain. This effect will be worse whenever the load resistance and the optical signal level (and hence the electrical output signal voltage) are high.The APD gain characteristic curve of Fig. 2 can be assumed to be linear over a small range of the APD bias voltage and accordingly can be expressed by a straight line equation. This assumption is valid when receiving a small optical signal and helps in simplifying the distortion analysis. For example, the curve AB of Fig. 2 can be expressed as:
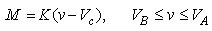 | (1) |
 is the gain of the APD,
  is the instantaneous bias voltage across the APD,
  is a constant equal to the slope of curve AB, and
  is the voltage as indicated in Fig. 2, obtained by extending the line passing through points A and B. Equation (1) is valid only for points along the curve AB. The value of
  for Fig. 2 was calculated to be about 11.197
  and
and  was equal to 145
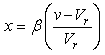
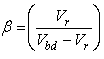
  .An expression for the current multiplication factor
  has been given as [24]:
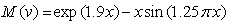 | (2) |
 | (3) |
 | (4) |
 is the instantaneous reverse bias voltage,
  is the reverse voltage at which avalanche multiplication becomes significant, and
  is the reverse breakdown voltage of the APD. In this case the slope,
  of the characteristic curve is given by:
 | (5) |
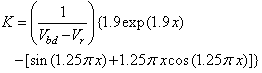 | (6) |
 For a given bias voltage of
  the value of
  can be evaluated from Eq. (6) along a linear segment PQ shown on the curve in Fig. 3. The value of
  on the
  -axis can then be evaluated by:
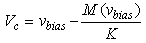 | (7) |
 | Figure 3. A general characteristics curve of APD for evaluation of  and and  from the equation of from the equation of  |
 up to 0.8 [24]. More accurate expression for
  , if any, can be used instead of Eq. (2) without any loss of generality.
3. Derivation of Harmonic Distortion in APD
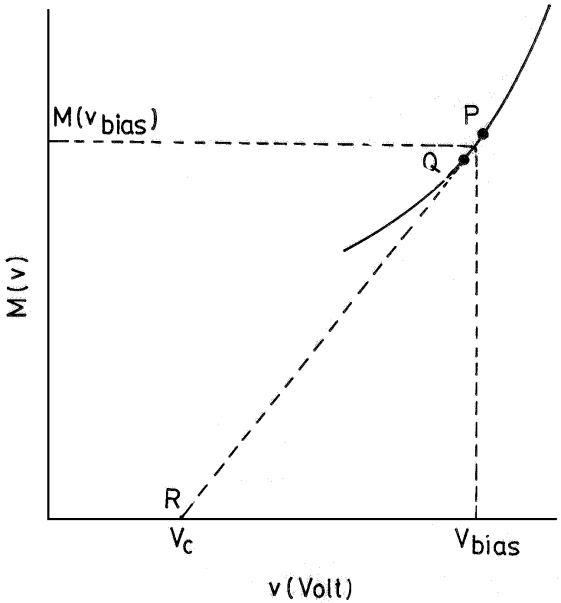
- To derive the expression for harmonic distortion in the APD circuit, we will consider the linearized characteristic curve (AB in Fig. 2) over a small range around the operating point of the APD voltage. The expression for the instantaneous ac current
 generated by the APD receiver corresponding to an ac input optical power
  can be written, referring to Eq. (1), as:
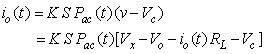 | (8) |
 is the responsivity of the photodiode (with gain equal to unity). After rearranging Eq. (8) we obtain:
 | (9) |
 at an angular frequency
  expressed as:
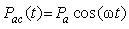 | (10) |
 is the peak amplitude of the ac optical power. The optical power
  does not contain any dc component and is equal to the instantaneous optical power minus the dc component of the optical power
  . Substituting for Pac(t) in Eq. (9), we get:
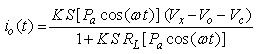 | (11) |
 can be alternatively shown as:
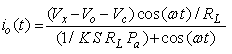 | (12) |
 by the load resistance
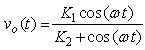
  the instantaneous ac output voltage
  can be obtained as:
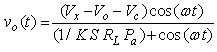 | (13) |
 | (14) |
 | (15) |
3.1. Fourier Series Expansion of the ac Output Voltage of the APD
- In general, the Fourier transform of the periodic signal
 (Eq. 14) in interval
  can be expressed as:
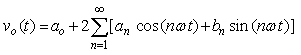 | (16) |
 is an even function, the coefficient
  ; then Eq. (16) simplifies to:
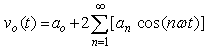 | (17) |
 is the average value of
  given by:
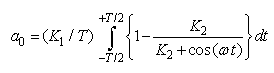 | (18) |
 is given as:
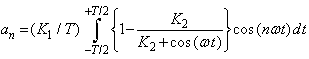 | (19) |
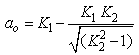 | (20) |
 one obtains
  To determine the value of
  we proceed as follows. From Eq. (19), we can write:
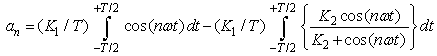 | (21) |
 to
to  is zero, then we have:
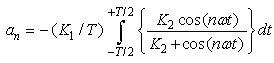 | (22) |
 | (23) |
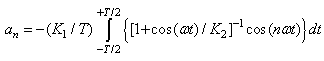
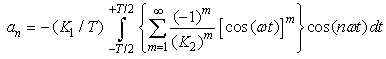
 we can expand the term in the bracket in Eq. (23) as:
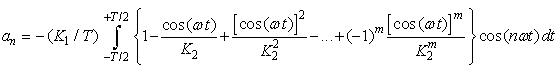 | (24) |
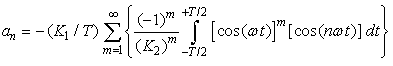
 to
to  the first term in Eq. (24) is zero. Therefore,
  can be reduced to:
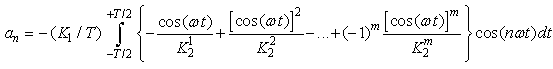 | (25) |
 | (26) |
 | (27) |
 tends to zero for high values of
  by assuming
  the expression for
  can be approximated by limiting the maximum value of
  to 5. The total harmonic distortion (THD), which indicates the degree of nonlinearity of an APD receiver, can be characterized by an analysis of the output spectral components with an input driven by a pure sinewave. Therefore, the THD in dB and percentage (%) can be defined, respectively, as [25-27]:
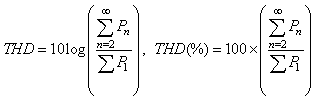 | (28) |
 and
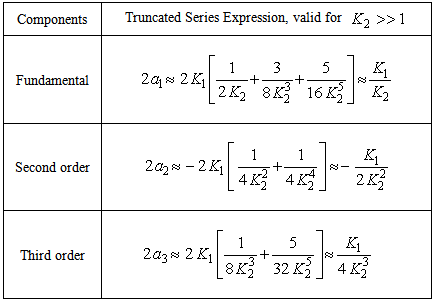
and  are total signal powers and fundamental signal power, respectively.Table 1 lists the approximate expressions for the different Fourier coefficients in terms of fundamental, second- and third harmonics components. From these expressions, second- (HD)2 and third harmonic distortion (HD)3 in dB, with respect to the fundamental, can be calculated, respectively, as:
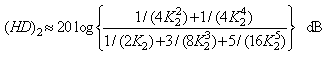 | (29) |
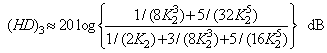 | (30) |
|
 can be determined from Eq. (15) for a given values of
  and
and  The harmonic distortion will be low, if the value of
  is high. In other words, the distortion value will be low, when either the APD receiver's load resistance
  or the peak optical power
  is small.
4. Results of the Distortion Analysis
- The harmonic distortion values were computed for load resistance of
 for different peak values of ac optical power
  . The plot is shown in Fig. 4, at
  for which
  and
and  . The second HD was about -71 dB (below fundamental) at
  which increased to -31 dB at
  for
for  . The corresponding theoretical value of third HD was -142 dB and -62 dB, respectively. The corresponding THD values are -214 dB for
  and -93 dB for
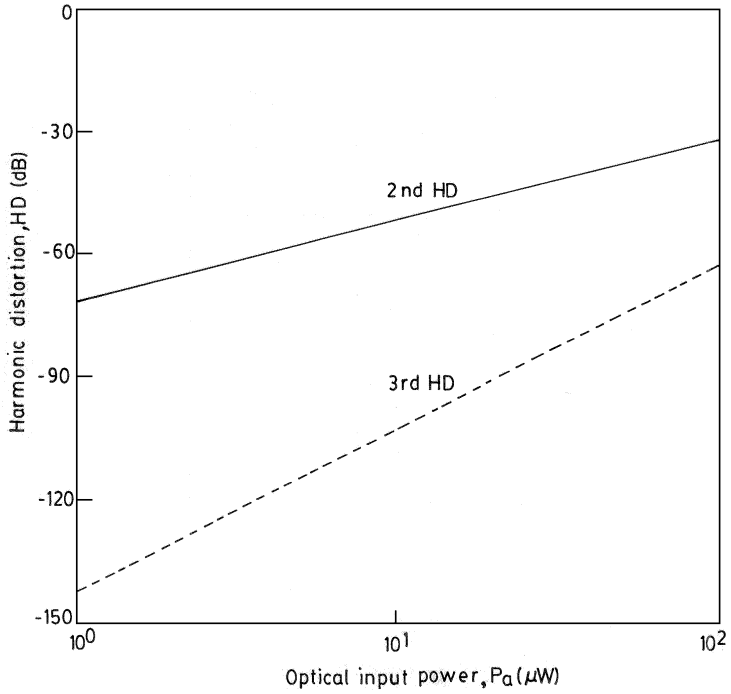 | Figure 4. Theoretical harmonic distortion of the APD receiver versus peak optical input power  for load resistance for load resistance  |
 and
and  At
At  , the second HD increases from a value of about -51 dB for
  to a value of about -11 dB for
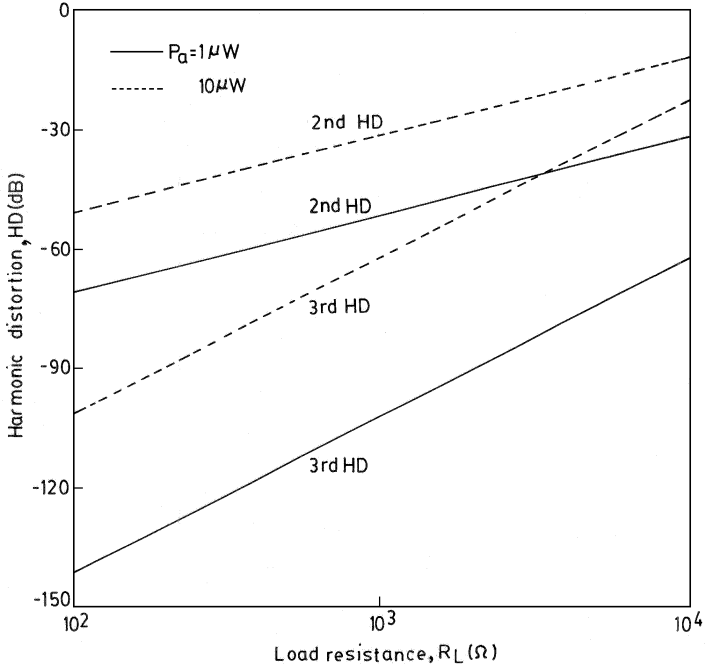 | Figure 5. Theoretical harmonic distortion of the APD receiver versus load resistance  for peak optical input power for peak optical input power  and and  |
 and
and  The results indicate that when the load resistance is lower, the THD is also lower for a specified received optical power.
|
 and
and  . For low load resistance, when received power has increased 10 times, the THD only increased to 9 dB, i.e. 4.7% degradation, whereas for high load resistance, the same power increase would cause an increase of 53 dB in the THD, which corresponds to 61% degradation of the THD. That is to say for a high load resistance, a 10 order of magnitude increase in received power, would result in 13 order of magnitude degradation in the THD. For a general APD characteristic
  given by Eq. (2), the value of
  and
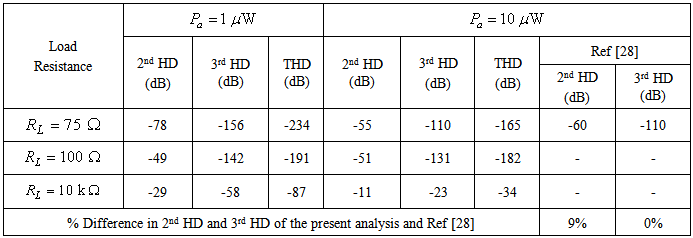
and  at different APD bias voltages can be theoretically evaluated, and from Table 1, the harmonic distortion values can be accordingly calculated.For sake of comparison, to the best of our knowledge a newer than the Ref. [28] was not traced to have reported an experimental replica of the present analysis. The then experimental results showed that for an optical input power of 10
  the second order (HD) and third order harmonic distortions were found to be -60 dB and -118 dB, respectively. The biasing voltage was 155 V, the gain was 76, and the load resistance was 75
  In the present analysis, for a gain of 42, biasing voltage of 145 V, and input power of 10
  the second order HD and third order HD are found to be -55 dB and -110 dB, respectively, for the same load resistance at 75
 In Table 2, it shown that the percentage differences between 2nd HDs of the present analysis and Ref [28] is 9% and for 3rd HDs is nil.
5. Conclusions
- In this paper, a simple model is proposed to compute the total harmonic distortion in an APD receiver circuit. The model is explained, by using the gain characteristic curve of an experimental circuit. For making the approach more general, a procedure is given so that the whole analysis could be based on an analytical equation of the gain
 Direct expressions, for the second and third harmonic distortions in dB (with reference to the fundamental), are derived.It is shown that when input power increases, the 2nd HD and 3rd HD would increase, and at a given input power, the 2nd HD is higher than 3rd HD. Typically, for the given circuit, the THD was found to be -191 dB, for
  and
and  If a high impedance preamplifier is used with
  the THD will become worse to a value of -34 dB for
  The results of the analysis indicates that for low THD, the load resistance and the received optical power at the output end should be at low level. In a given comparison shows that the obtained results almost tally with a reported experimental results.The analysis presented here will be useful for analog optical fiber transmission systems and optical sensor applications.