-
Paper Information
- Paper Submission
-
Journal Information
- About This Journal
- Editorial Board
- Current Issue
- Archive
- Author Guidelines
- Contact Us
International Journal of Optics and Applications
p-ISSN: 2168-5053 e-ISSN: 2168-5061
2015; 5(2): 33-49
doi:10.5923/j.optics.20150502.02
Optical and Structural Characterization of Diffuse Reflectance Standards
 Abstract
 Reference
 Full-Text PDF
 Full-text HTML
Antonio Parretta1, 2, Maria Luisa Addonizio3
1Physics and Earth Science Department, University of Ferrara, Via Saragat 1, 44122 Ferrara (FE), Italy
2ENEA Centro Ricerche “E. Clementel”, Via Martiri di Monte Sole 4, 40129 Bologna (BO), Italy
3ENEA Centro Ricerche Portici, P.le Enrico Fermi, 1, 80055 Portici (NA), Italy
Correspondence to: Antonio Parretta, Physics and Earth Science Department, University of Ferrara, Via Saragat 1, 44122 Ferrara (FE), Italy.
| Email: |  |
Copyright © 2015 Scientific & Academic Publishing. All Rights Reserved.
In this paper, we describe the optical properties of Labsphere diffuse reflectance standards of different nominal reflectance. Specifically, we analyze their properties of hemispherical total reflectance and angular distribution of scattered light intensity, as function of the angle of incidence and wavelength of a laser beam. Our main objective is to find the difference between the optical behavior of a real diffuser of given average reflectance and that of an ideal Lambertian diffuser. The optical characterizations were carried out by using original methods and apparatus, and were followed by SEM-EDS analysis with the aim to relate the optical properties with the morphological and structural characteristics. The optical characterizations demonstrate that the standards with high nominal total reflectance approach better the Lambertian behavior. This result is confirmed by SEM analysis, showing, for these samples, the most rugged surfaces and a porous material.
Keywords: Reflectance standard, Optical diffuser, Optical characterization, Integrating sphere, SEM analysis
Cite this paper: Antonio Parretta, Maria Luisa Addonizio, Optical and Structural Characterization of Diffuse Reflectance Standards, International Journal of Optics and Applications, Vol. 5 No. 2, 2015, pp. 33-49. doi: 10.5923/j.optics.20150502.02.
Article Outline
1. Introduction
- Reflectance standards are commonly used in commercial spectrophotometers for calibration purposes and the most widely used ones are those with high reflectivity (close to 99%) in the visible and near-infrared range, showing almost ideal reflection properties, those of a Lambertian diffuser [1]. Reflectance standards are also key components in optical laboratories devoted to the characterization of materials and devices for solar energy research [2-13]. In this work we investigate the optical properties of standards with very different nominal reflectivity, in particular a series produced by Labsphere, which cover the range of values from about 2% to about 99%. Our interest for these light diffusers comes from their intensive use with the innovative equipments developed in the past years at ENEA-Portici and Ferrara University labs, and devoted to the non-destructive optical characterization of photovoltaic materials and devices [4-20]. These devices are realized with textured surfaces, to better absorb solar radiation, and have been studied in terms of total or diffuse reflectance and spatial distribution of the diffused light [21-25]. Since these devices are very little reflective, it is advantageous to perform the calibration measurements with standards of similar reflectivity in order to improve the accuracy of measurements. We used reflectance standards also to analyze the flux distribution on cross-sections of focused solar beams produced by CPV (Concentrating Photovoltaics) systems, following the so called camera-target or light scattering-CCD method [26-28]. Here, the standard diffuser intercepts the light beam while a CCD camera records the image of the irradiated surface. The analysis of the image allows, after appropriate processing [28], to recover the flux density distribution on the crossed surface. It is a fact that a correct reconstruction is made possible only by the use of a diffuser with good Lambertian properties [1]. It is the main objective of the present work to investigate the optical behavior of Labsphere diffuse standards of different nominal reflectivity, in order to check how much these real diffusers deviate from the ideal Lambertian behavior. The optical characterizations were performed by using original methods and instrumentations. In particular, the total hemispherical reflectance was measured by a reflectometer, the CAR (Continuous Angle Reflectometer) apparatus, designed to vary the angle of incidence of a laser beam in a continuous way, at three different wavelengths in the visible and infrared spectrum. The optical characterizations of Labsphere samples were followed by SEM-EDS characterizations for investigating their morphological and structural properties.
2. The Diffuse Reflectance Standards
- We investigated the set of Labsphere diffuse reflectance standards of the type Spectralon® [29]. They are durable, chemically inert standards with typical reflectance values ranging from 2% to 99% and are quite spectrally flat over the UV-VIS-NIR spectrum. All Spectralon materials are optically flat to +/- 4% over the range of 250÷2500 nm and +/- 1% over the photopic region of the spectrum.Labsphere declares that Spectralon Diffuse Reflectance Standards are highly Lambertian, with Spectralon SRM-99 reflectance material being the most Lambertian reflector available for use over the wavelength range 250÷2500 nm. The Spectralon diffuse reflectance standards were in a set consisting of a diffuse white standard and a selection of diffuse gray standards. The samples are composed of a polymer resin based on fluoropolymers, with high reflectivity. The mixture of this material with particles of carbon black, used as a black pigment, reduces the surface reflectivity in a controlled manner and then allows to obtain the series of standard samples characterized by a different nominal reflectance. The Spectralon reflectance standards are available in diameters of 1, 2 and 3 inches, and are identified as SRS-xx-yyy, where xx is the nominal percent reflectance, roughly corresponding to the average reflectance in the 250÷2500 nm spectral range, and yy.y is the diameter in inches. The standards that have the same nominal reflectance are exactly equal, regardless of the size; then, for the purposes of optical measurements, it is unconcerned the size of the standard. Fig. 1 shows a complete set of the 3 inches diameter set, SRS-xx-030, with xx = 02, 05, 10, 20, 40, 60, 80, 99. Each standard is supplied with a calibration certificate reporting the directional/hemispherical (d/h) reflectance data obtained at 8° incidence, in the 250÷2500 nm interval, and at 50 nm step. Fig. 2a shows the total hemispherical spectral reflectance curves for the four samples in the low reflectivity range (2%, 5%, 10%, 20%), whereas Fig. 2b shows the same quantity for the four samples in the high reflectivity range (40%, 60%, 80%, 99%).
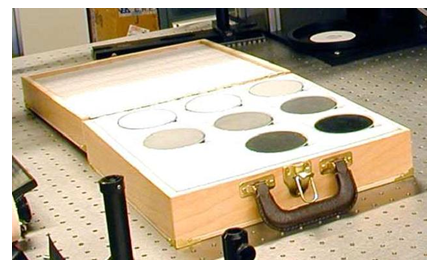 | Figure 1. The complete set of the SRS-xx-030 series samples |
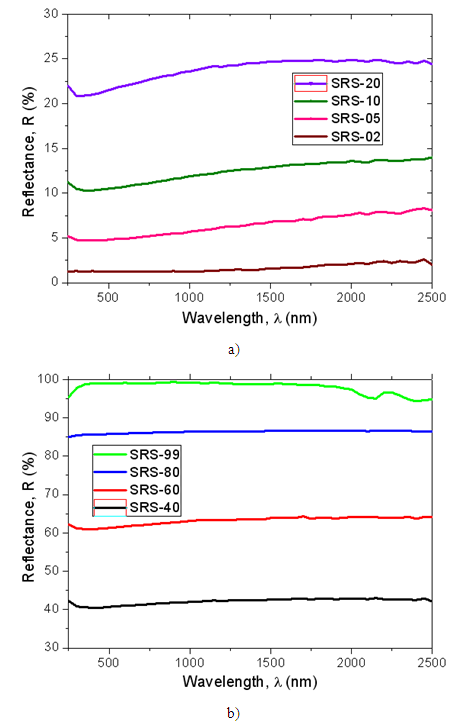 | Figure 2. Total hemispherical spectral reflectance curves, at 8° incidence, in the 250÷2500 nm range, of the 2, 5, 10, 20% nominal reflectance standards (a), and of the 40, 60, 80, 99% nominal reflectance standards (b) |
3. Optical Characterization Methods
3.1. The CAR Reflectometer
- Before describing the CAR reflectometer, it is useful to recall here that the first Lambert’s law establishes that a Lambertian diffuser, when irradiated by a parallel beam, manifests a total reflectance constant with respect to the incidence angle [1]. This law can be stated in equivalent way saying that the flux reflected by the unit area varies as the cosine of the angle of incidence. For this reason, this law is also known as the first cosine law. The second cosine law regards the behavior of diffused light intensity and is discussed in Section 3.2. The CAR apparatus was realized at the ENEA-Portici labs and is the evolution of the ROSE (Reflectometer for Optical measurements in Solar Energy) apparatus [4-9, 13, 18, 20], equipped with a series of windows to address the incident beam towards the sample at variable angles with 10° steps. Unlike ROSE, the CAR reflectometer was designed to vary continuously the angle of incidence of the beam. For this purpose, the integrating sphere of the CAR, of 40-cm diameter as that of ROSE, was designed with a slit (sl), 1-cm wide, that extends to a 180° arc onto the equatorial plane and works as input port for the laser beam. The CAR apparatus is schematically shown in Fig. 3 and illustrated in the photos of Fig. 4. In the following, we describe the measure on a generic Labsphere standard as if it were a test sample (sa) to be compared to a reference standard (ref), eventually coincident with the test sample itself.
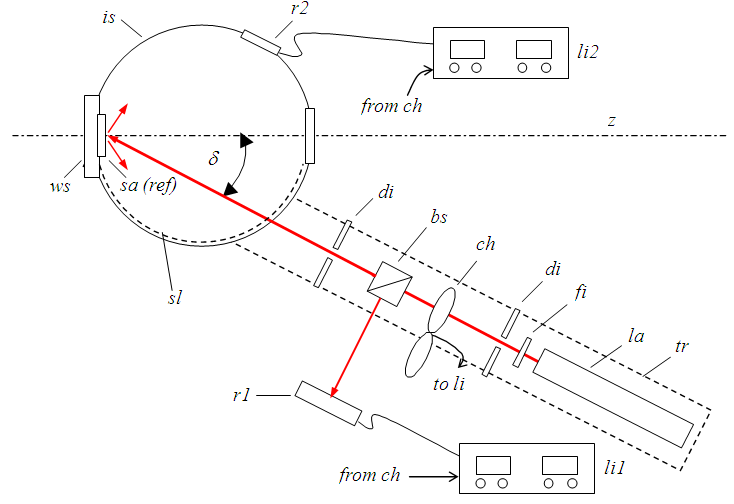 | Figure 3. Schematic top view of the CAR apparatus |
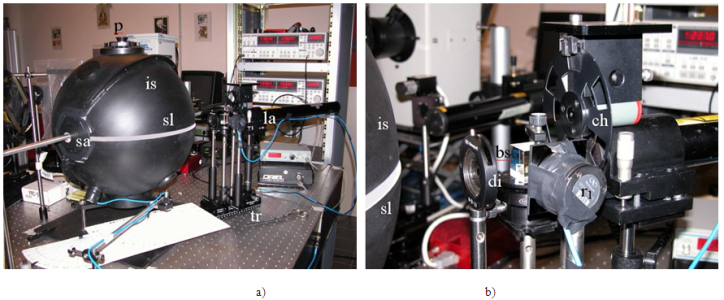 | Figure 4. Overall view (a) and details (b) of the CAR apparatus |
3.2. The Optical Scatterometer
- The second Lambert’s law establishes for a Lambertian diffuser a reflected light with constant radiance L(θ) (W/sr·m2) as function of the polar scattering angle θ ; this is equivalent to say that the radiant intensity I (θ ) (W/sr) must follow a cosθ behavior. For this reason, this law is also known as the second cosine law [1]. The angular distribution of scattered light has been investigated on the plane of incidence of the laser beam. In this way, it is represented by a curve, the “reflectance indicatrix” [1], which describes the variation, with the observation, or scattering angle of the radiant intensity of light, I (θ). For a Lambertian diffuser the indicatrix (in) is a circle that we have drawn tangent to the test surface in Fig. 5. For measuring the indicatrix, it was set up the scatterometer schematically shown in Fig. 5 and illustrated in the photos of Fig. 6. In the same way as for the CAR, the collimated and unpolarized beam from the laser source (la), spatially selected by the diaphragm (di), is mechanically modulated by chopper (ch), monitored by detector (r1) and lock-in amplifier (li1), after being splitted at beam splitter (bs) and attenuated by the neutral filter (fi); finally it crosses a second diaphragm (di) and strikes the sample (sa) at the incidence angle δ. The radiant intensity is measured rotating detector (r2) around the sample (sa), keeping it oriented towards (sa) and at a constant distance. As the solid angle of collected light is constant, the photocurrent from (r2) is proportional to the radiant intensity I (θ). The scattering angle θ is varied from -90° to +90°, being the indicatrix curve not generally symmetric respect to ñ, the normal to sample surface. The polarization degree of light diffused along direction θ is obtained by placing a polarizer (po) in front of (r2) and taking several measures of intensity to draw the polarization ellipse. The polarization degree is reported in terms of inverse ellipticity. As for the CAR apparatus, the signal from (r2) and (li2) is normalized to the signal from (r1).
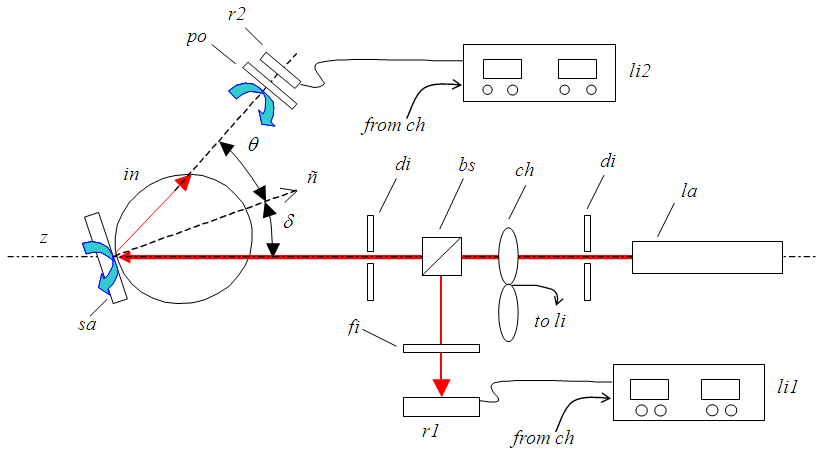 | Figure 5. Scheme of the apparatus for the measurement of angular distribution of intensity and polarization of scattered light |
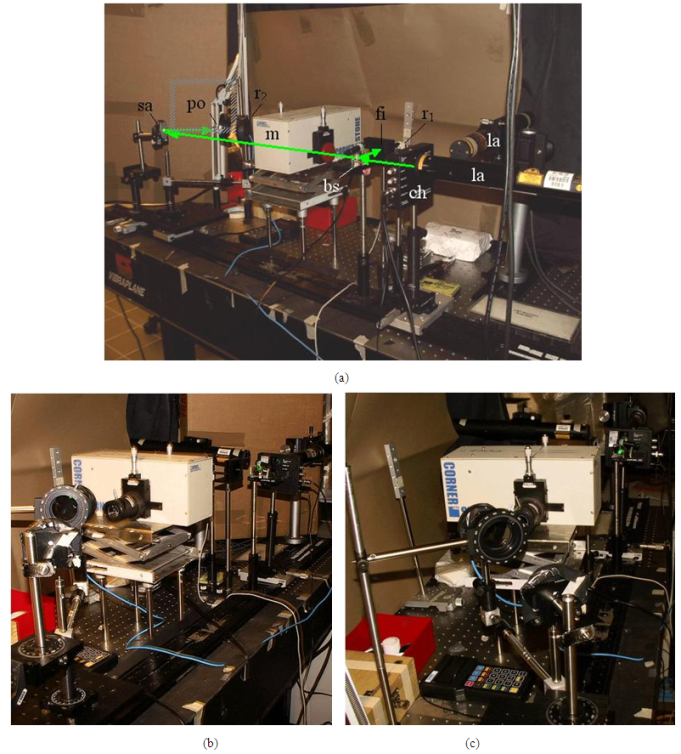 | Figure 6. Photos of the apparatus for measurement of the angular distribution of intensity and polarization of light scattered by the sample (sa). In (a) it is shown the path of a ray of green light (λ = 543 nm). The laser of red light is also shown. In (b) and (c) photos of other details of the scatterometer |
4. Theoretical Aspects of Reflectance Measurements
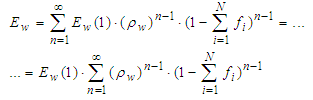
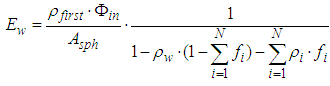
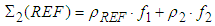
- The theory of reflectance measurements by the CAR apparatus is derived by that of an integrating sphere [30-34]. The formula for the correct value of reflectance is derived by the expression of the stationary irradiance incident on the sphere wall. We briefly outline here the procedure for obtaining the stationary irradiance in the simple case of an integrating sphere, of radius r, of homogeneous wall reflectivity
 , and provided with a series of N openings, or ports, with zero reflectivity and relative area fi (see Fig. 7).
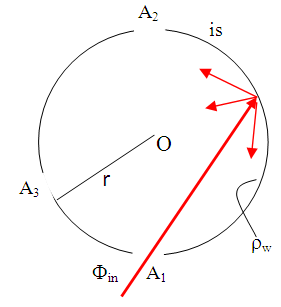 | Figure 7. Schematic representation of a simple integrating sphere, of r diameter and  wall reflectivity, provided with three open ports wall reflectivity, provided with three open ports |
 , impinging on the sphere wall, we have that the reflectivity of the first impact surface is:
  . The first reflected flux is therefore:
 | (1) |
 given by:
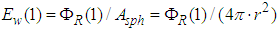 | (2) |
 is the total area of the sphere. The irradiance
  produces a second reflected flux given by:
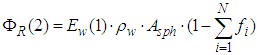 | (3) |
 , is a contribution that adds to
 and is given by:
 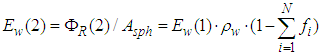 | (4) |
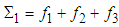
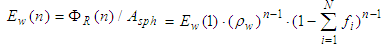 | (5) |
 | (6) |
 and
and  , the final expression for
  becomes:
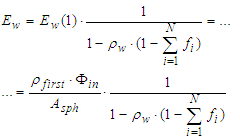 | (7) |
 :
: | (8) |
 induces a proportional current signal S on the photodetector (r2) (see Fig. 3), that is measured by the lock-in amplifier (li2) and normalized to the signal on (r1). The sphere of the CAR in the configuration of Fig. 3, for example, can be modeled as provided with a port for the sample (sa) (i=1), a port for the photodetector (r2) (i=2) and an opening for the slit (sl) (i=3). The measure of reflectance is carried out in the following way: i) the sample under test (sa), of reflectivity
  , is placed at the sample port (ws) (i=1); ii) the signal
  from (r2) is measured by the lock-in amplifier (li2); iii) a “reference” standard of reflectance (ref), of reflectivity
  , is placed at the sample port (ws) (i=1) in place of the test sample (sa); iv) the signal
  from (r2) is measured by the lock-in amplifier (li2). Then we have, when measuring the test sample:
 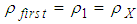 , whereas, when measuring the reference standard of reflectance:
  . In both cases we have:
  , because the slit behaves as an open port. By applying Eq. (8) to the case of test sample, we have:
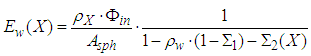 | (9) |
 is a constant and known quantity,
 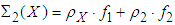 is an unknown quantity. By applying Eq. (8) to the case of the reference standard, we have:
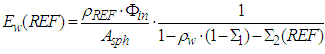 | (10) |
 is a known quantity.As the photodetectors (r1) and (r2) operate in a linear regime, the signals to the lock-in amplifier, corresponding to the test sample and to the standard, become, respectively,
 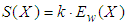 and
and 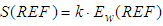 .By calling R the ratio between the two measurements, we have:
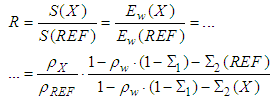 | (11) |
 | (12a) |
 . In some cases, however, the long formula (12a) is not required. This is true whenever the area of the sample port is negligible respect to the sphere area
  , or when the reflectance of the standard is similar to that of the test sample. This will be clear writing Eq. (12a) in the following way:
  | (12b) |
 , in both cases we have that the second addendum of the denominator vanishes and then the expression for the unknown reflectivity
  reduces to:
 | (13) |
5. Results and Discussion
5.1. Total Hemispherical Reflectance
- The angle-resolved total directional / hemispherical reflectance,
 , was measured on a complete set of Labsphere Spectralon samples of 3-inches diameter: SRS-02-030 (2%), SRS-05-030 (5%), SRS-10-030 (10%), SRS-20-030 (20%), SRS-40-030 (40%), SRS-60-030 (60%), SRS-80-030 (80%) and SRS-99-030 (99%) (the nominal reflectance is in parentheses). Measurements were carried out at three wavelengths: 543 nm (green), 633 nm (red), 1064 nm (NIR), and the results are reported in Figs. 8 (a-c), respectively. Remembering that “Lambertianity” requires a constant reflectance vs. the incidence angle [1], we observe that most of the samples show quite good characteristics of Lambertianity, as declared by Labsphere; however, this condition is better respected here by the samples with high nominal reflectance. The reflectance curves at the three different wavelengths for the standards with 40%, 60%, 80% and 99% nominal reflectance are compared in Fig. 9.
 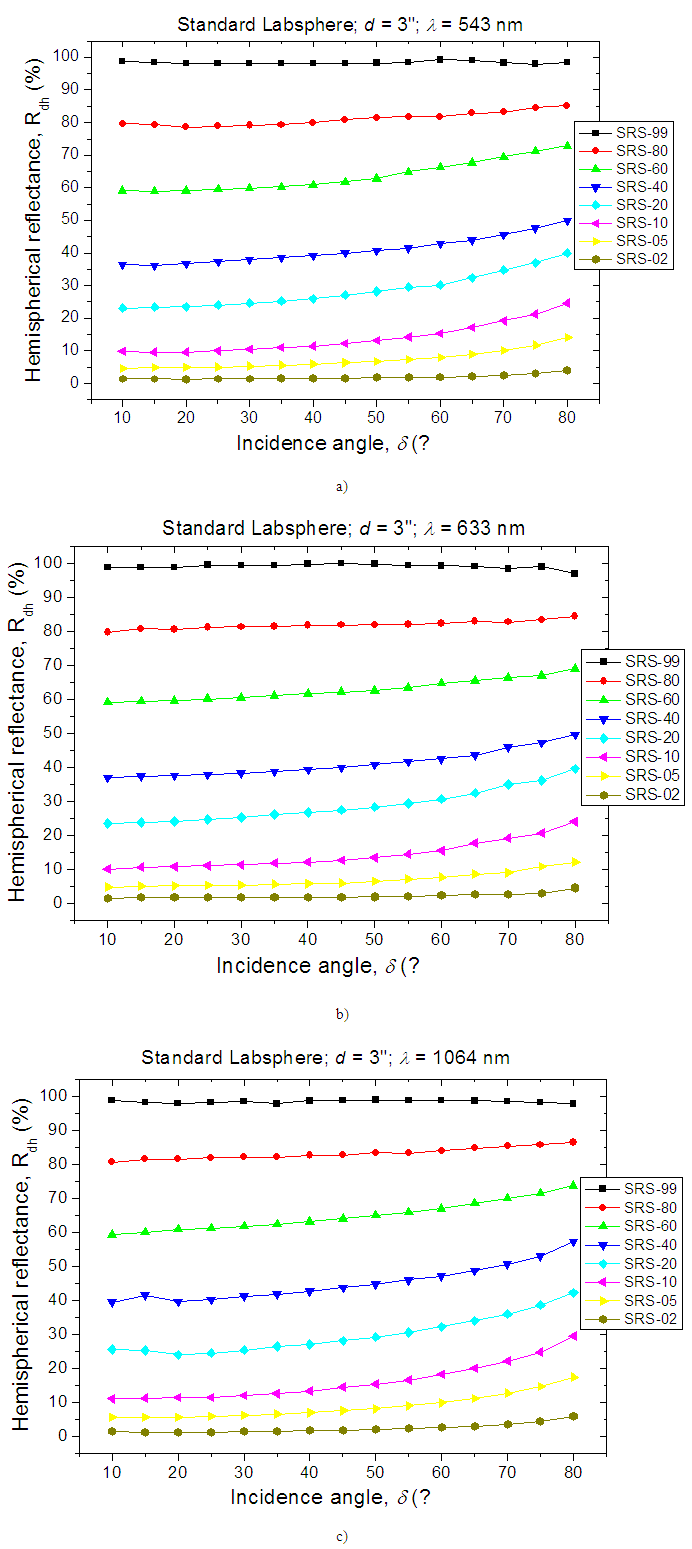 | Figure 8. Total hemispherical reflectance vs. the angle of incidence (δ) for the set of 3-inches Labsphere Spectralon standard samples: (a) λ = 543 nm; (b) λ = 633 nm; (a) λ = 1064 nm |
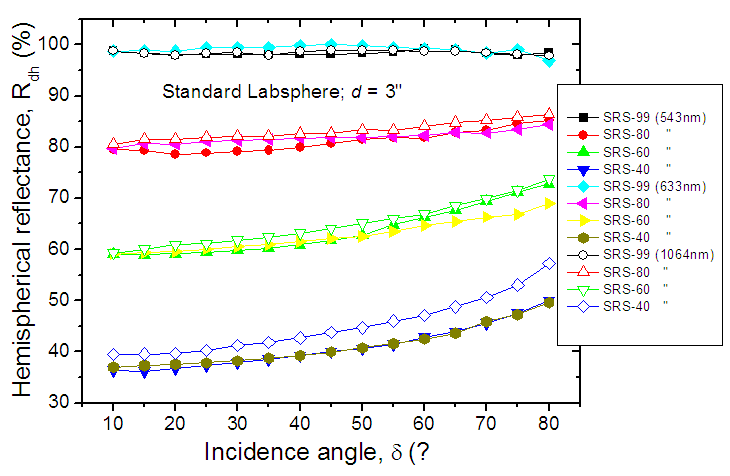 | Figure 9. Comparison of reflectance curves obtained at 543 nm, 633 nm and 1064, for the 3-inches Labsphere standards of higher nominal reflectance (40%, 60%, 80%, 99%) |
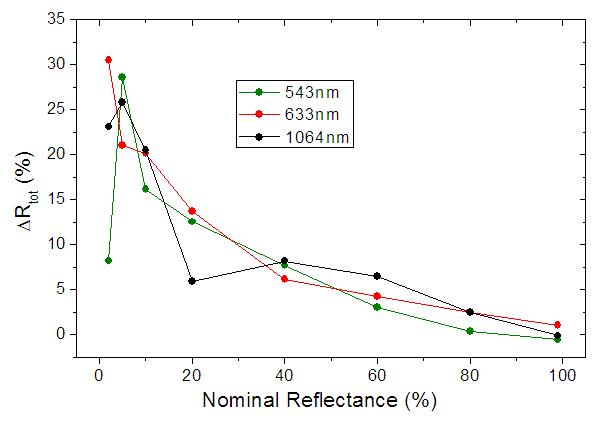 | Figure 10. Relative increase of total reflectance moving the incidence angle from δ = 10° to δ = 40°, calculated at wavelengths: λ = 543, 633 and 1064 nm |
5.2. Analysis of the Scattered Light Intensity
- The angular distribution of the intensity of scattered light (radiant intensity) was measured at λ =543 nm on the samples SRS-02-020, SRS-10-020, SRS-40-020, SRS-60-020, SRS-80-020 and SRS-99-020, choosing, for the angle of incidence, the values: δ= 0°, 10°, 20°, 30° and 40°. The results are reported in Figs. 11(a-e), together with the curve of cosθ, which represents the behavior of a Lambertian diffuser (as discussed in Section 3.2), to show how much the experimental curves deviate from the ideal behavior. In the figures, the negative angles are angles measured from the incident beam side, and then are affected by a shadow zone produced by the photodetector, while the positive ones represent the angles measured from the side of the “specular” beam, imagining the sample like a mirror.
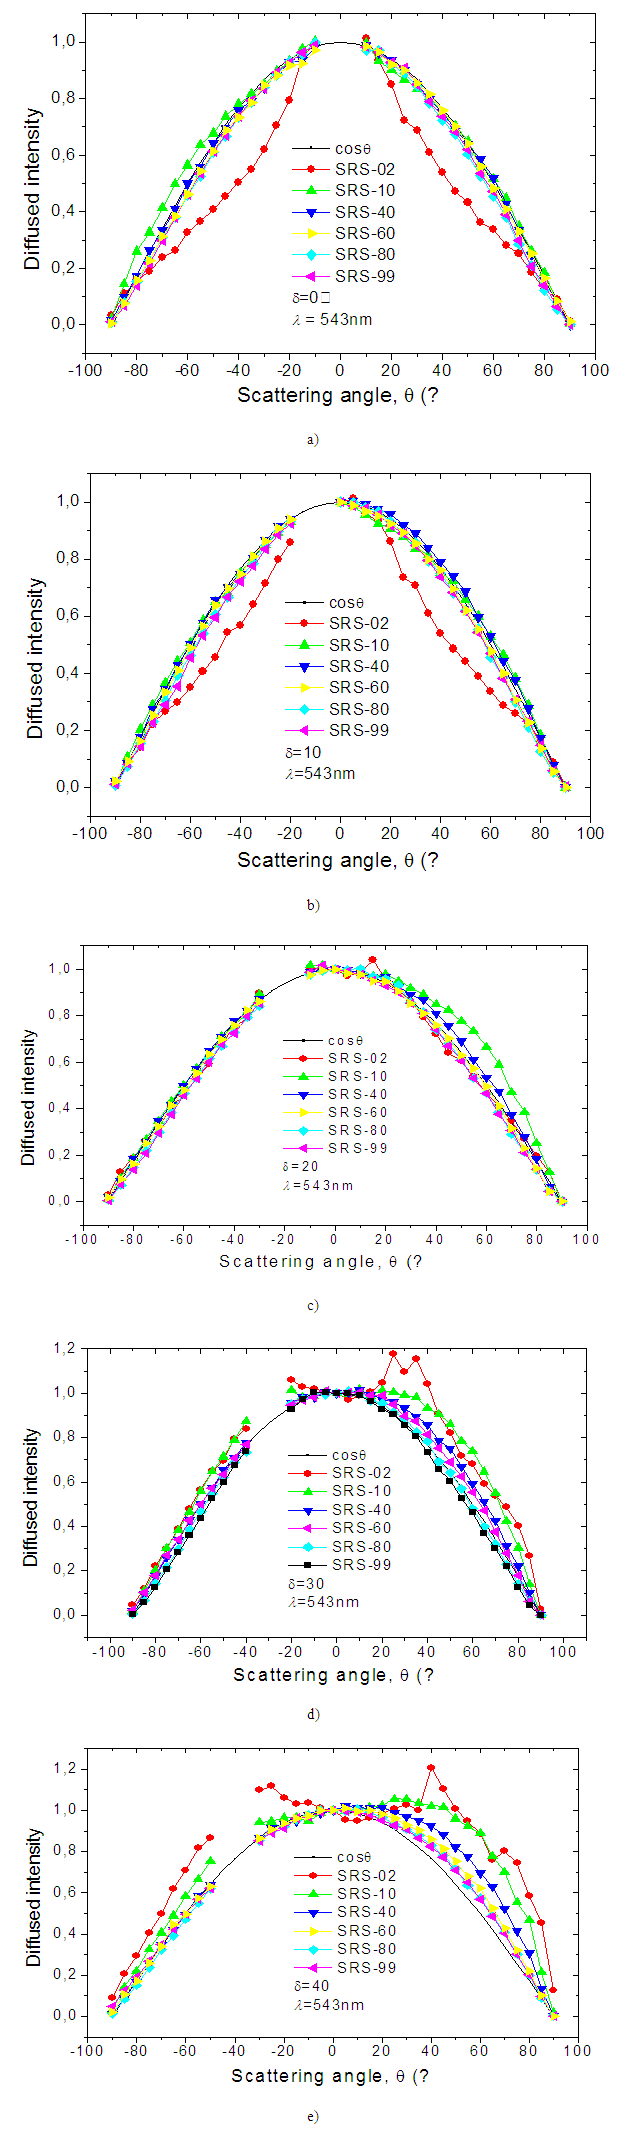 | Figure 11. Relative radiant intensity curves of some Spectralon standards SRS-xx-020 vs. the scattering angle θ, obtained at λ = 543 nm and at incidence angles: (a)δ = 0°; (b) δ = 10°; (c) δ = 20°; (d) δ = 30°; (e) δ = 40° |
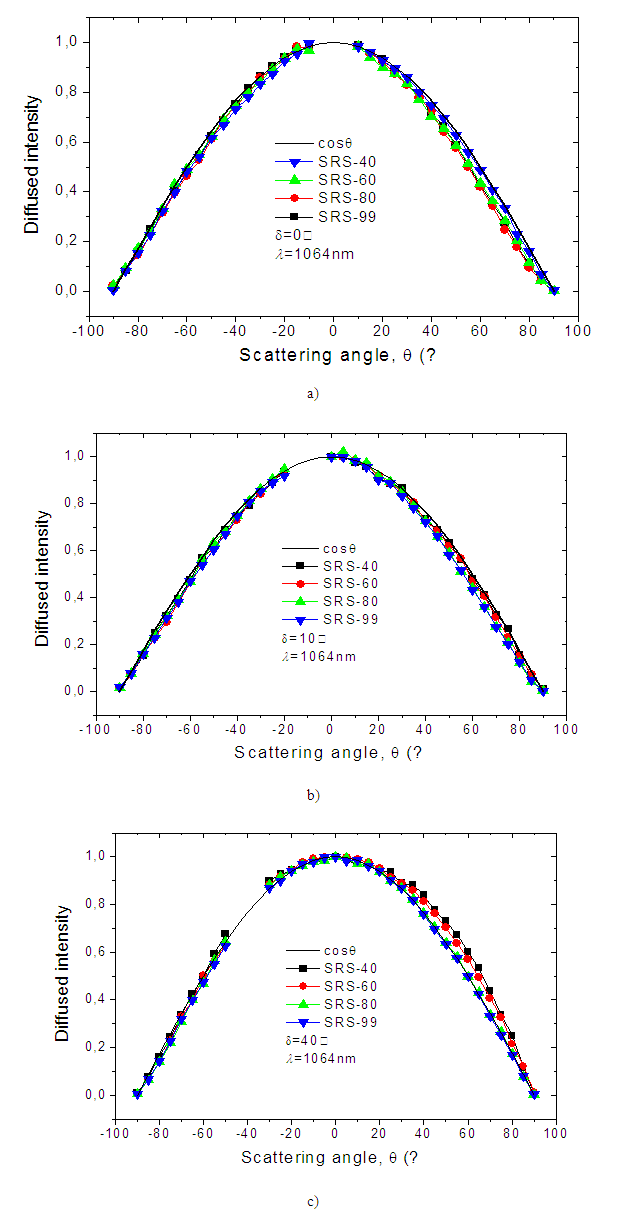 | Figure 12. Relative radiant intensity curves of the Spectralon standards SRS-40-020, SRS-60-020, SRS-80-020 and SRS-99-020, vs. the scattering angle θ, obtained at λ = 1064 nm at incidence angles: (a) δ = 0°; (b) δ = 10°; (c) δ = 40° |
5.3. Analysis of the Scattered Light Polarization
- The polarization of the scattered light was analyzed for the Labsphere samples of the SRS-xx-020 series, that is of 2-inches diameter, and at the wavelength λ = 543 nm. The degree of polarization is normally expressed in terms of “ellipticity", defined as the ratio b/a between the major and the minor axis of the polarization ellipse. Here we use the quantity “inverse ellipticity” a/b in order to have always values smaller than one (a/b = 0: maximum polarization; a/b = 1: absence of polarization). In Fig. 13 it is shown, by way of example, the polarization ellipse measured for the SRS-02-020 standard at an angle of observation θ= 50°. The inverse ellipticity, a/b, measured on some samples of the series SRS-xx-020 at an angle of incidence δ= 0°, is reported in Fig. 14. This figure shows that only the less reflective samples, SRS-02, SRS-05 and SRS-10, cause a polarization in the diffused light. The SRS-02 sample induces a strong polarization on the diffused light; less polarization is induced by the SRS-05 and SRS-10 samples. The inverse ellipticity tends to decrease at increasing the scattering angle, then the polarization tends to increase at increasing the scattering angle. This is particularly evident for the SRS-02 sample.
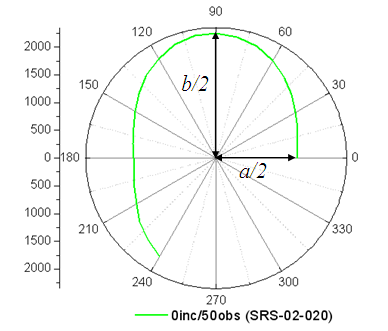 | Figure 13. Polarization ellipse of diffused light (λ = 543 nm) measured for the SRS-02 standard at incidence angle δ = 0° and observation angle θ = 50° |
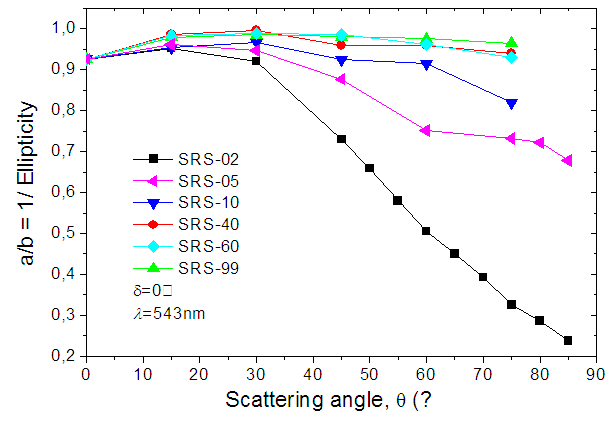 | Figure 14. Inverse ellipticity of the light scattered by some samples of the SRS-xx-020 series, measured as function of the observation angle, at incidence of δ = 0° and at λ = 543 nm |
5.4. Morphological and Structural Characterization
- The characterization of surface morphology and internal structure of diffuse reflectance standards Labsphere was made by scanning electron microscopy (SEM), and the compositional analysis, to identify the elemental constituents of the material used, was made by x-ray microanalysis (EDS). The measurements were performed on the samples SRS-02-020, SRS-40-020 and SRS-99-020 (2%, 40% and 99% of nominal reflectance, respectively). The surface morphology of the three samples is shown in Figs. 15 (a-c). The surface is in all cases extremely wrinkled. In the sample SRS-02 it looks like a conglomerate of rounded grains of varying sizes (from a few micrometers to a few tens of micrometers), while the standards with higher reflectivity are characterized by roughness of fractal type, accentuated in the sample of highest reflectivity. All specimens show a high internal porosity.
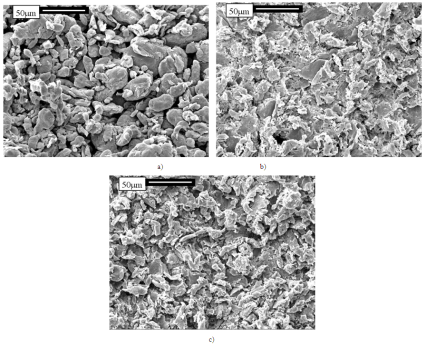 | Figure 15. SEM images of surface morphology of (a) SRS-02, (b) SRS-40 and (c) SRS-99 samples |
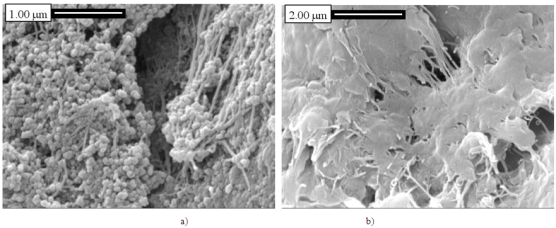 | Figure 16. High magnification SEM images of the structure of samples: (a) SRS-02 and (b) SRS-99 |
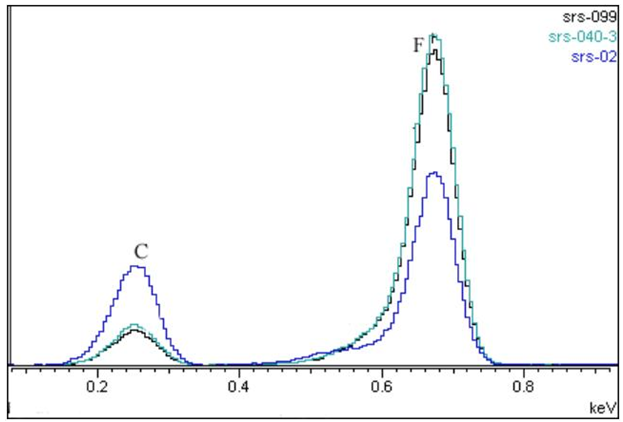 | Figure 17. EDS spectra of the three Labsphere standards |
6. Conclusions
- Spectralon Labsphere standards with different nominal reflectance were characterized by investigating their optical, morphological and structural properties. The optical characterizations were performed analyzing the angle-resolved total reflectance at different wavelengths, the intensity and polarization of the diffused light as function of the scattering angle. The results of optical measurement show that higher is the nominal reflectance of the standard, better is its behavior as Lambertian diffuser. The reason for this is that the average reflectance of a standard is obtained by mixing a fluoropolymer, of very high reflectivity and highly diffusing, with various amounts of carbon black particles, highly absorbing and with smooth surface. As a consequence, the SRS-02 standard, of 2% nominal reflectance, is the farthest from the Lambertian behavior, whereas the SRS-99 standard, of 99% nominal reflectance, and made of pure fluoropolymer, shows the best optical properties and can be considered, in practice, an ideal Lambertian diffuser. The standards with reflectance between 2% and 99% show optical properties intermediate between these two extremes. Despite this, it is possible to find, for any standard, the restricted conditions in which each of them can work as a Lambertian diffuser. All the standards therefore can find applications in optical apparatus, provided that their use be made taking account of their properties, as found by this study, and the limitations imposed by the experimental conditions.