-
Paper Information
- Next Paper
- Previous Paper
- Paper Submission
-
Journal Information
- About This Journal
- Editorial Board
- Current Issue
- Archive
- Author Guidelines
- Contact Us
International Journal of Optics and Applications
p-ISSN: 2168-5053 e-ISSN: 2168-5061
2014; 4(2): 54-61
doi:10.5923/j.optics.20140402.05
Analysis of Power Coupling and Losses at Splice Joints of Dissimilar Optical Fibers
 Abstract
 Reference
 Full-Text PDF
 Full-text HTML
Faramarz E. Seraji1, Samira Farsinezhad2
1Optical Communication Group, Iran Telecom Research Center, Tehran, Iran
2Excitonics and Nanostructures Laboratory, University of Alberta, Canada
Correspondence to: Faramarz E. Seraji, Optical Communication Group, Iran Telecom Research Center, Tehran, Iran.
| Email: |  |
Copyright © 2014 Scientific & Academic Publishing. All Rights Reserved.
Analysis of losses at splice joints of dissimilar single-mode fibers (SMF), with three types of photonic crystal fibers (PCFs) are presented, using full-vectorial effective index methods and scalar effective index method. The effects of air-hole diameter (d), air-hole spacing (Λ), the air-filling factor d/, dopant concentration in the core of PCFs on power coupling ratio and coupling losses at splice joints are analytically investigated. The results of the analysis may be used by network designers to predict over all splice joints losses when employing PCF-based devices in the optical networks.
Keywords: Power coupling, Losses, Splice joints, Single-mode fiber, Photonic crystal fiber
Cite this paper: Faramarz E. Seraji, Samira Farsinezhad, Analysis of Power Coupling and Losses at Splice Joints of Dissimilar Optical Fibers, International Journal of Optics and Applications, Vol. 4 No. 2, 2014, pp. 54-61. doi: 10.5923/j.optics.20140402.05.
Article Outline
1. Introduction
- One of the bottlenecks in implementing an optical network is the well-known splice losses between transmission fibers and fiber-based devices, such as optical dispersion compensators, optical attenuators, optical filters, etc. Numerous works, using numerical analysis, are reported to determine the splice losses between similar, dissimilar standard single-mode fibers (SMF) [1, 2], and photonic crystal fibers (PCF) used as devices that are inserted in an optical link.Using different methods such as GRIN (Graded Index) lens coupling, gradient index fiber lenses, tapered fibers [3], and two-ring PCF with different radius [4], arc-fusion [5], the amount of losses have been considerably reduced [6, 7] from 1.5 dB [8] to 0.7 dB [9].In our previous report, we have investigated loss effects on splice joints between SMF and PCF-based devices [10], where the analysis was based on spot size at bending and straight conditions of spliced fibers. In the present paper, by using full-vectorial effective index method (FVEIM) and scalar effective index method (SEIM), the parameters of conventional PCF (CPCF), all silica based photonic crystal fiber (ASB-PCF), and raised-core PCF (RCPCF) in conjunction with splicing to dissimilar SMFs, are optimized under different parametric conditions [11]. In Section 2, splice of dissimilar optical fibers are analyzed to optimize the power coupling and the coupling losses, by considering the affecting parameters of the fibers. In subsections 2.1, 2.2, and 2.3, splice joints of SMF with CPCF, ASB-PCF, and RCPCF are analyzed to determine the splice losses at different parametric conditions. Subsections 2.4 devotes to analysis of different PCFs when spliced to dispersion shifted fibers (DSFs) and non-zero dispersion shifted fibers (NZDSFs).
2. Dissimilar Splice Joints
- Photonic crystal fibers (PCFs) with peculiar characteristics are presently being used in fabrication of optical devices [12]. For utilization of optical devices in an optical fiber link, we need to splice them to transmission fibers. Splicing of fiber to fiber and fiber to optical devices should be done in such a way that the loss at splice joints be at minimum level to ensure a quality optical transmission. The affecting parameters on the loss of splice joints are spot size, core radius, numerical aperture, and different types of misalignments [13]. For the first time in 1977, loss of splice joints in single-mode fibers was investigated. In the latest reports, amongst affecting parameters on the splice joints, only mode field diameter (MFD) was investigated and other parameters were ignored [12, 14, 15, 16]. For the first time, PCF was spliced to conventional dispersion shifted fiber (DSF) by a modified commercial splicer. The splice loss at the joint was 1.5 dB at 1550 nm [17]. Theoretically, it was shown that splice losses could be obtained as low as 0.2 dB at 1550 nm between PCFs [12]. The results of simulation using finite difference frequency domain method showed splice losses of 0.7 to 1.1 dB [18].
2.1. Splice Joint of SMF and CPCF
- In this section, optimization of splice loss of joints between two dissimilar fibers SMF and CPCF is carried out. For the analysis, we use two solvers SEIM and FVEIM, and codes written by MATLAB software.In using effective index method (EIM), PCFs are usually approximated to an equivalent step index SMF. For a perfect splice joint between two fibers, the transmission coefficient of fundamental fields of spliced fibers
 and
and  at the splice joint can be expressed as [12, 19]:
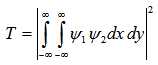 | (1) |
 and
and  as follows:
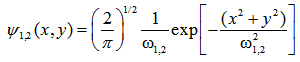 | (2) |
 and
and  are the spot sizes of two spliced fibers. Now, by using Eq. (2) in Eq. (1), and after integration and some mathematical simplifications, we obtain:
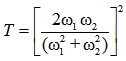 | (3) |
 and
and  effective spot sizes of an SMF and a CPCF, respectively, we can express maximum transmission coefficient of spliced SMF to CPCF as follows:
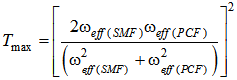 | (4) |
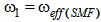
 is a constant at a given wavelength while the value of
  is functions of
  and
and  , where
  is the center-to-center spacing between air-holes located along the cladding,
  denotes air filling factor of the PCF, and
  is the air-hole diameter. By considering a perfect splice joint (with no misalignments) between a transmitting CPCF to a receiving SMF (say, Corning SMF-28e), and vice versa, the power couplings in terms of
  and
and  can be depicted, as shown in Fig. (1), which show that in a wide range of parametric changes, the power couplings in both the cases increase to maximum values. The corresponding coupling losses for two coupling cases are illustrated in Fig. (2), which show that in the same range of PCF parameters, the loss reduces to minimum values in both the cases. Actually, the discrepancy between Fig. (1a) and Fig. (1b) is due to differences in core radii of the SMF and the CPCF, when the transmitting and receiving direction are interchanged.
 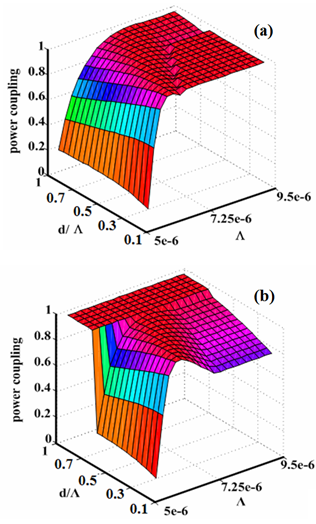 | Figure 1. Power couplings as functions of  and and  . (a) Between a CPCF and an SMF-28e and (b) Between an SMF-28 and a CPCF . (a) Between a CPCF and an SMF-28e and (b) Between an SMF-28 and a CPCF |
 | Figure 2. Coupling losses (a) between a CPCF and an SMF-28e (b) between an SMF-28 and a CPCF as functions of  and and  |
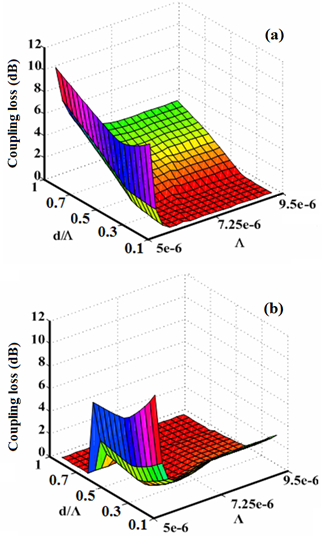
 | Figure 3. Loss of splice joint of a CPCF in an optical network with an SMF as a transmission medium, when two propagation directions are considered |
 and
and  , as shown in Fig. (3). As the value of
  increases, the loss values approach to a minimum value at higher values of
  When
When  reaches at 6.41μm and
  the loss value is found to be a negligible value of 0.0003 dB.Meanwhile, analytically, one can accurately determine the values by considering the following conditions:Condition I: Since the core radius is directly proportional to
  , thus for determination of optimum loss value, first the value of
  is calculated. The core radius of the standard SMF is normally in the range of 4.1μm to 5μm and the effective core radius of the CPCF is
  therefore, for equalizing SMF and CPCF core radii, the value of
  should lie in the range 6.41 to 7.81 μm. By considering unequal spot sizes and power couplings, the coupling loss is plotted in Fig. (4), using SEIM and FVEIM solvers for splicing of SMF-28e to CPCF for two spot sizes of Gaussian approximation [10, 21] and Peterman II [22]. The results of two methods almost coincides on each other except at maximum and minimum points, the losses have different values.
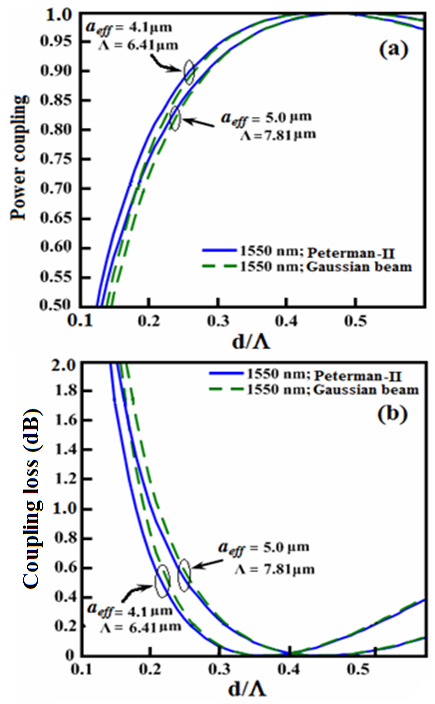 | Figure 4. Determination of (a) Power coupling and (b) coupling loss at splice joint of SMF-28e to CPCF as functions of  at at  and and  , ,  and and 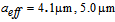 , using SEIM and FVEIM solvers , using SEIM and FVEIM solvers |
 and
and  , the values of
  are found to be 0.375 and 0.345 by SEIM and FVEIM, respectively. The minimum calculated loss is of the order of 10-4 dB. Moreover, in Fig. (4), in the ranges of
  and
and  based on FVEIM and SEIM analyses, respectively, the loss value is less than 1%, while in the corresponding ranges of
 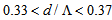 and
and 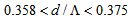 , the loss value is less than 0.1%. Photonic crystal fibers are not single-moded for all values of
  , so to keep the loss values as small as possible due to difference in number of modes, the ratio
  should be constrained in a desired ranges [23].Condition II: It is well-known that higher the value of
  , smaller will be the spot size, and more will be the light confinement in the core region of the CPCF [24], hence a reduction in the loss due to larger spot size with respect to core radius. Of course, this reduction of spot size is for that reason whatsoever
  increases, the distance between air-holes will decrease and the amount of propagating power from core region will leak lesser into cladding region. Therefore, in the range
 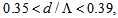 the macrobending loss, the spot size, and other affecting factors are at minimum values.The variations of power coupling and coupling loss of a perfect (without any misalignments) splice of SMF-28e to CPCF, analyzed by FVEIM, are depicted in Fig. (5) as a function of
  for two spot sizes of Peterman II and Gaussian beam for
  We note that at two peaks
  and
and  the coupling losses at the splice joint reach to minimum levels. For
  , the spot size does not affect the coupling losses. The corresponding fundamental modal intensities (LP01) of an SMF-28e and a CPCF are shown in Fig. (6). We note that the modal intensity of the SMF-28e is less than that of the CPCF for almost equal mode field diameters.
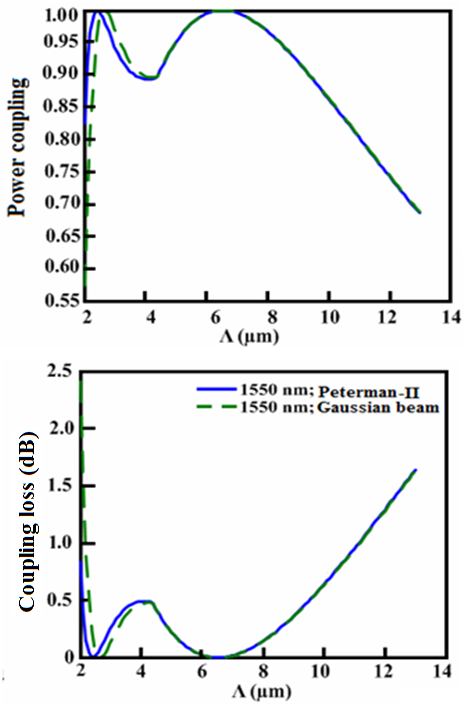 | Figure 5. Determination of (a) Power coupling and (b) coupling loss at splice joint of SMF-28e to CPCF as functions of  with with  and and  at at  using FVEIM solver using FVEIM solver |
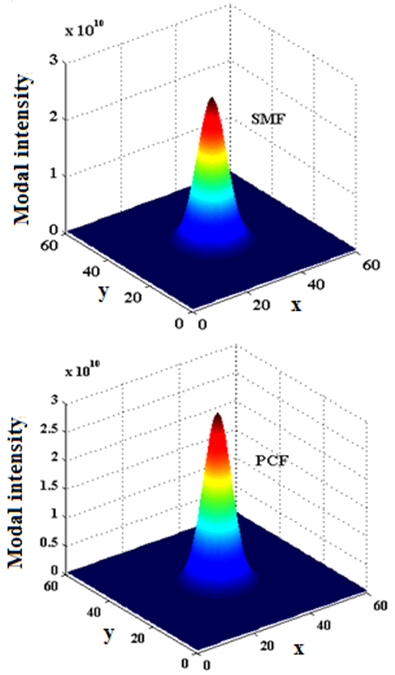 | Figure 6. Comparison of the fundamental modal intensities of an (a) SMF-28e and (b) a CPCF with  and and  |
2.2. Splice Joint of SMF and ASB-PCF
- All silica based photonic crystal fiber (ASB-PCF) is another type of PCF that contains three refractive index regions: (1) refractive index of air-holes in the cladding
 , (2) refractive index of core made from pure silica, and (3) refractive index of cladding
  with
with 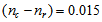 [25].By assuming the effective core radius
  and
and  , for a minimum coupling loss between an SMF-28e and an ASB-PCF, the optimum value of the ratio
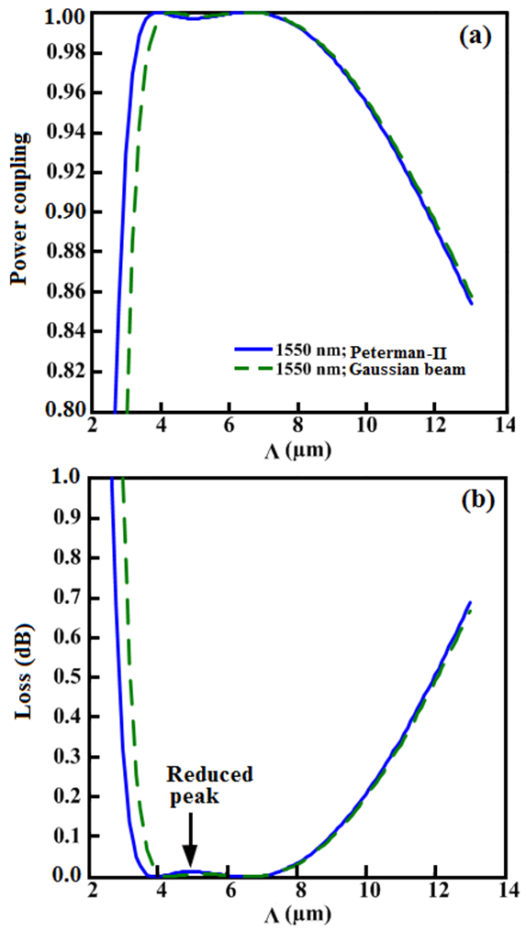
  is obtained in the range 0.61 to 0.68, using SEIM, as shown in Fig. (7).The reason for coupling loss increase is that when the dopant concentration in the core region increases, the power confinement in the core of the RCPCF will be more, resulting in a change of the MFD. This later change causes a mismatch between MFDs of the two spliced fibers.By using FVEIM for the analysis, the optimized value of the ratio
  is obtained at 0.5, at which the coupling loss is 0.16 dB, as depicted in Fig. (7b), where for the same value of
  , the loss is reduced as compared with splicing SMF-28e to CPCF in Fig. (4b).
 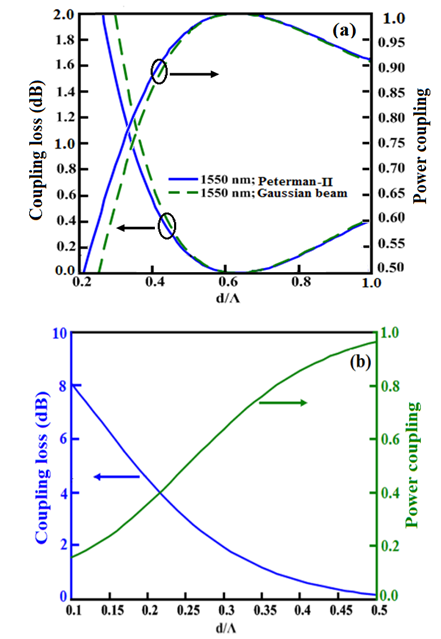 | Figure 7. Power coupling and coupling loss between SMF-28e and ASB-PCF with  as function of as function of  using (a) SEIM for two cases of Peterman II and Gaussian beams and (b) using FVEIM at 1550 nm using (a) SEIM for two cases of Peterman II and Gaussian beams and (b) using FVEIM at 1550 nm |
 with two different spot sizes at
  , using SEIM solver. We note that in this case the power coupling becomes flatter in the given range of
  with an increase in
  value. It shows that the loss of 0.16 dB occurs at
  .
. | Figure 8. Determination of (a) Power coupling and (b) coupling loss between SMF-28e and ASB-PCF as function of  with with  , using SEIM solver , using SEIM solver |
2.3. Splice Joint of SMF and RCPCF
- Raised-core photonic crystal fiber (RCPCF), in contrary to CPCF, has dopant such as GeO2 in the core region, which keeps the core refractive index at higher level than the cladding index [26]. By using the same calculation procedures performed in above analyses, the effects of dopant concentrations of the core region on coupling loss of RCPCF and SMF-28e as functions of
 are investigated and illustrated for unequal spot sizes in Fig. (9).The figures from Fig. (9a) to Fig. (9f) show that when the dopants’ concentration in the core of RCPCF increases, the value of
  at which the coupling loss is minimum, approaches to smaller values. The power couplings at the splice joint of RCPCF and SMF-28e decrease linearly and accordingly the corresponding coupling losses increase with a linear nature.
 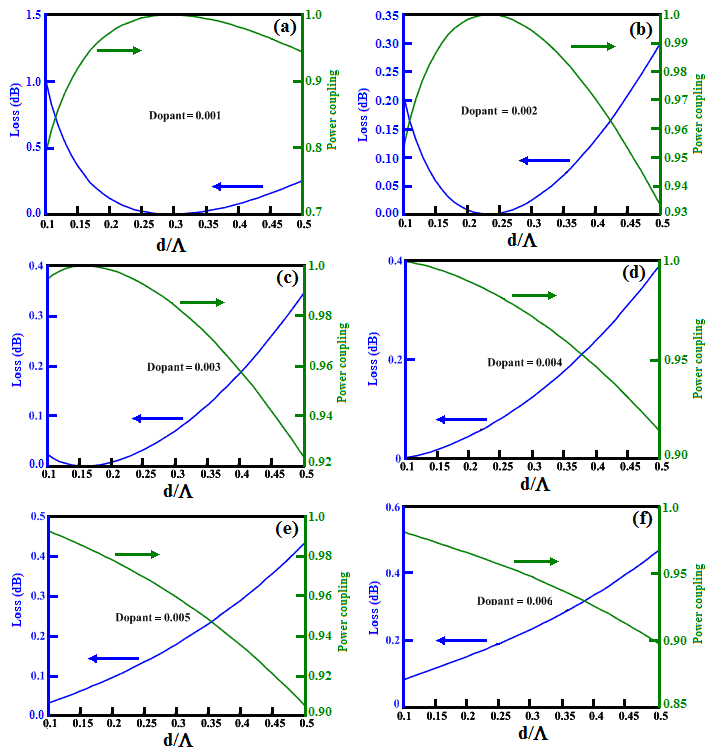 | Figure 9. Effects of dopant concentrations of the core region on coupling loss of RCPCF and SMF-28e as functions of  |
 (see Fig. 6). It shows that for a maximum power coupling of 0.992, the maximum coupling loss is 0.036 dB, which occurs at dopant concentration of 0.01%. The reason for reduction of maximum power coupling is that when dopant concentration increases, the power confinement in the core becomes higher, causing decrease in MFD of RCPCF with respect to that of SMF. This is an instance of MFD mismatch between two spliced fibers which results in increase in coupling loss.
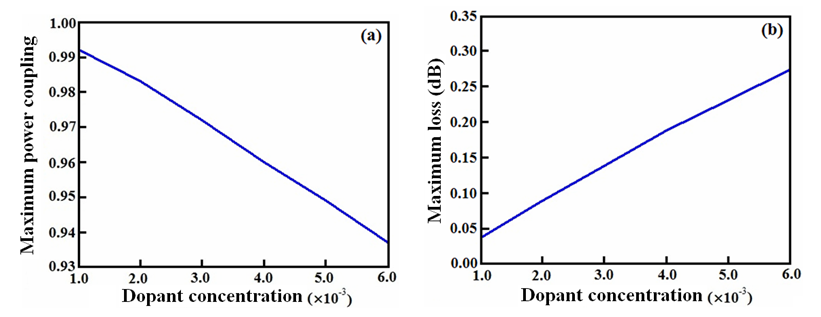 | Figure 10. (a) Variation of power coupling and (b) Corresponding coupling loss as a function of dopant concentration |
2.4. Splice Joint of PCF with DSF and NZDSF
- In continuation of our analysis, two cases of splicing of dispersion-shifted fiber (DSF) and non-zero dispersion-shifted fiber (NZDSF) with CPCF and RCPCF are investigated. Power coupling and coupling loss between DSF with CPCF and RCPCF as function of
 with
with  at
at  using Gaussian approximation are depicted in Fig. (11). The radius of DSF is and dopant concentration in case of RCPCF is 0.3%. For highest power coupling at
  the coupling losses for splicing of DSF with CPCF and RCPCF are 0.175 dB and 0.05 dB, respectively.
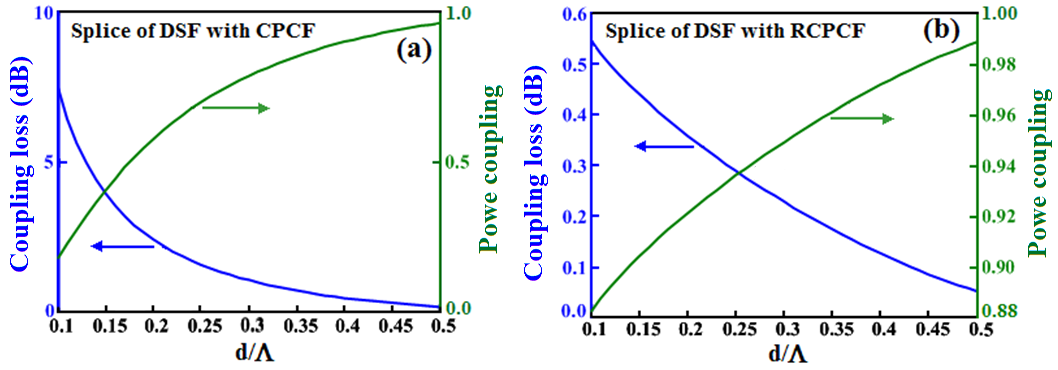 | Figure 11. Power coupling and coupling loss between DSF and (a) CPCF and (b) RCPCF as function of  with with  at at  , using Gaussian approximation , using Gaussian approximation |
 and
and 
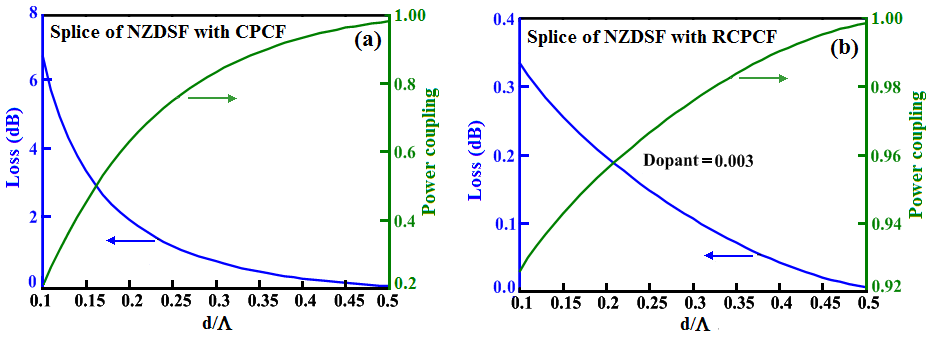 | Figure 12. Power coupling and coupling loss of NZDSF with radius of  spliced with CPCF and RCPCF with spliced with CPCF and RCPCF with  at 1550 nm at 1550 nm |
 we will find that the power couplings and coupling losses are in opposite levels of lowest and highest values and vice versa, respectively. On other words, using RCPCF based devices in optical networks of having DSF/NZDSF as a transmission medium, the coupling losses considerably reduce from 0.175 dB to 0.05 dB. In general, by comparing Figs. (9), (11), and (12), we observe that when using standard SMF-28e fiber spliced with RCPCF, by increasing dopant concentration, the minimum coupling loss occurs at low values of
  , whereas using DSF and NZDSF fibers, the minimum losses are obtained at higher values of
  .
.3. Conclusions
- This paper presented an analysis of losses at splice joints of dissimilar single-mode fibers (Conventional SMF, DSF, and NZDSF) with three types of photonic crystal fibers (Conventional PCF, raised-core PCF, and all silica based PCF), using improved full-vectorial effective index methods and scalar effective index method. It is shown that when the dopants’ concentration in the core of RCPCF increases, the power couplings at the splice joint of RCPCF and SMF-28e decreases linearly and accordingly the corresponding coupling losses increases with a linear nature. On other words, using RCPCF based devices in optical networks of having DSF/NZDSF as a transmission medium, the coupling losses considerably reduce at a particular case from 0.175 dB to 0.05 dB.On comparison of two cases of DSF and NZDSF spliced with CPCF reveals that loss of 0.175 dB in case of DSF reduces to 0.0785 dB for NZDSF, and on splicing with RCPCF the lowest value changes from 0.05 dB to 0.0065 dB.In general, by comparing all the obtained results, we observe that when using standard SMF-28e fiber spliced with RCPCF, by increasing dopant concentration, the minimum coupling loss occurs at low values of
 , whereas using DSF and NZDSF fibers, the minimum losses are obtained at higher values of
  .
.