-
Paper Information
- Next Paper
- Paper Submission
-
Journal Information
- About This Journal
- Editorial Board
- Current Issue
- Archive
- Author Guidelines
- Contact Us
International Journal of Optics and Applications
p-ISSN: 2168-5053 e-ISSN: 2168-5061
2014; 4(1): 16-19
doi:10.5923/j.optics.20140401.03
Highly Repeatable Polarization Maintaining Optical Fiber Evanescent Sensor Fabrication Method
 Abstract
 Reference
 Full-Text PDF
 Full-text HTML
Nawfel Azami1, Driss El Idrissi1, 2, Mohammed Harmouchi2, Azeddine Mouhsen2
1National Institute of Telecommunications, Optoelectronics Lab, Rabat, Morocco
2FST de Settat, Km 3, B.P. 577 Route de Casablanca, Morocco
Correspondence to: Nawfel Azami, National Institute of Telecommunications, Optoelectronics Lab, Rabat, Morocco.
| Email: |  |
Copyright © 2014 Scientific & Academic Publishing. All Rights Reserved.
We present a new method for controlling the cladding thickness of etched Polarization Maintaining Fiber based sensor in order to precisely control the sensitivity and the optical characteristics of the sensor. This method is based on the experimental measurement of the chemical etching rates of the fiber materials by measuring longitudinal etching rates of doped materials by perpendicular immersion of a polarization maintaining optical fibre probe under the same operating conditions and manufacturing of the sensors. Computer blob tracking are used to precise measurement of both cladding and stress parts etching rates of Panda-type polarization maintaining optical fibre. The experimental etching rates are used in an algorithm to simulate the geometry of the etched fibre sensor in real-time. A high degree of sensor sensitivity repeatability has been achieved with a resolution on the cladding thickness better than 0.4um.
Keywords: Sensors, Fibre, Evanescent field, Polarization, Image processing
Cite this paper: Nawfel Azami, Driss El Idrissi, Mohammed Harmouchi, Azeddine Mouhsen, Highly Repeatable Polarization Maintaining Optical Fiber Evanescent Sensor Fabrication Method, International Journal of Optics and Applications, Vol. 4 No. 1, 2014, pp. 16-19. doi: 10.5923/j.optics.20140401.03.
Article Outline
1. Introduction
- Optical fiber evanescent sensors (OFES) are playing more and more important roles in detecting chemical, bacilli, toxin, and environmental pollutants for their high efficiency, good accuracy, low cost, and convenience. Optical fiber evanescent sensors currently show a high degree of performances where the mechanical flexibility and the ability of optical fiber to transmit signal on a long distance make them very attractive to use. In general, these sensors exploit the interactions between evanescent field of the sensing fibers and the surrounding analyte under investigation. Concentrations of analyte can be related to the power attenuation caused by these interactions, and the more energy interacted with the analyte, the higher the sensitivities of the sensors. In order to expose the evanescent filed of the fiber to the analyte, the fiber cladding is often removed and the fiber core is surrounded by the detecting material. Several kind of optical fibers have been used for both chemical and physical analytes detection. Sensors based on multimode optical fiber exhibit a limited resolution mainly due to modal noise causing the strength of the interaction between the fiber guided light wave and the analyte to fluctuate. Single mode fibers have shown better performances. However light wave polarization fluctuation during its propagation in the fiber is a limiting factor, particularly for optical sensors based on the excitation of surface Plasmon (SP). In that case, polarization of light in the optical fiber needs to be precisely controlled to ensure stable interaction and to avoid output fluctuations. Polarization Maintaining Optical Fiber have been used to overcome output sensitivity to light polarization Most of evanescent sensing Polarization Maintaining optical fibers are based on polishing [1,2] or chemical etching [3]. In polishing technique, the fiber is glued into a curved slot in a silica block such that the polarization axis of the fiber is normal to the silica blocks surface. However, fiber alignment cannot be controlled precisely even by using the elasto-optic method [4]. The error of alignment of fiber birefringent axis with respect to the surface of the silica block surface is estimated to be within 1 degree, which limits polarization diversity sensitivity to -35 dB. The chemical etching method is undoubtedly the simplest and the most inexpensive optical fiber evanescent fabrication technique. Chemical etching of polarization Maintaining optical fiber, owing to its ease of operation and polarization axis alignment preservation is preferred to the polishing method. The etching depth is the main factor that determines the interaction strength of guided light wave and the analyte. Hence, etching depth has to be precisely controlled in order to optimize the sensing system sensitivity and performances according to their applications. However, the relationship between the etching depth and etching parameters (e.g. nature and concentration of etchant, choice of organic solvent, etching temperature…) is not clear, and there is no technique that is both simple and effective that can control the shape of the etched fiber. The strong dependence of the sensitivity of interaction between light wave and analyte requires robust methods for controlling the etching depth. Various methods have been reported to control etching depth of silica optical fiber [5, 6] and D-shape optical fiber [7]. However none of these methods can be applied to control etching process of Polarization Maintaining optical fiber. In this paper, we present a simple, novel, repeatable and controllable approach to fabricate Polarization Maintaining Optical fiber evanescent sensor. The method consists on continuous real time experimental measurement of etching rates of both cladding and stress rods during the etching process of the Polarization Maintaining optical fiber sensor by using a transversally immersed optical PM fiber probe in acid. The approach is based on microscopic image acquisition of this polarization maintaining optical fiber probe during etching process with correlation tracking of the fiber cladding and stress rods. Image processing with blob detection analysis and centroid tracking allow precise determination of etching speeds. Calculated etching rates are then used for real time simulation of the optical fiber shape by using diffusion equations. The resulting power loss of the fiber for different refractive index liquid is compared to a model to determine the polish depth. As has been reported, the resolution depth does not exceed 1 µm. In this paper, we present an in-situ method for determining the cladding thickness of the etched side of (PM) fiber type PANDA, based on real time experimental measurement of the chemical etching rate of the cladding and stress rods during etching process. Using experimental data and numerical modeling, we show high improvements on the control of the etching PMF process with experimental resolution depth better than 0.2 um.
2. Experimental Set up
- The optical fibers used in this study were PANDA-type Polarization Maintaining Optical fibers with a Ge-doped core, pure silica cladding and Bore-doped stress rods. The core of the optical fiber diameter was 10 um and the cladding of the optical fiber was 125 um. Before dipping into HF solution, roughly 1.5 cm of the polyacrylate coating was stripped away by a fiber stripper, and then the fiber was cleaned by ethanol to remove the debris from the jacket. A fiber cleaver cut the fiber into 1 cm lengths and then the even end of the fiber was selected to be studied under optical microscopy. The cut fiber was perpendicularly immersed into a hydrofluoric acid etching solution. Figure 1 shows the schematic of the experimental set up.
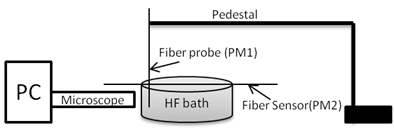 | Figure 1. Experimental set up |
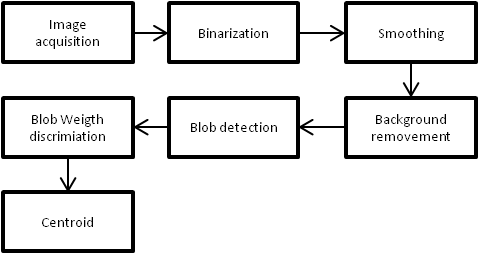 | Figure 2. Flow chart of optical fiber image processing |
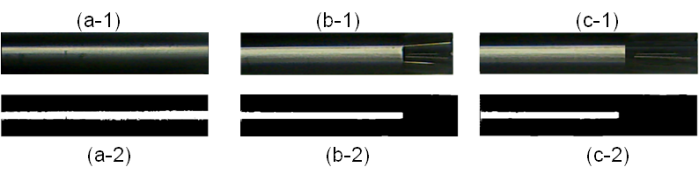 | Figure 3. (a.1) Non etched PM fiber. (b.1) PM fiber after 5 minutes of HF etching. (b.2) PM fiber after 10 minutes of etching. (a.2), (b.2), (c.2) binarization of microscope images with fixed threshold |
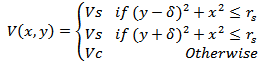 Where Vc and Vs are respectively the etching rates of cladding and stress rods. The profile of the fiber during the chemical etching is given by the simulator as shown in the Fig.4.
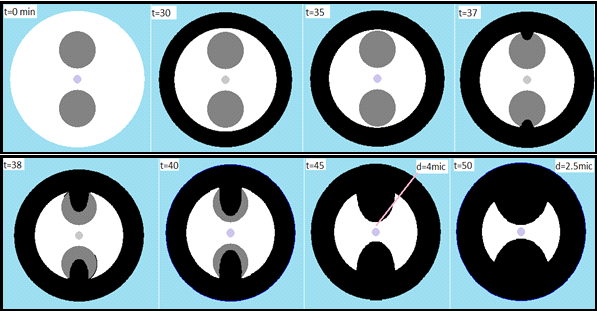 | Figure 4. Simulation of the Transverse section of etched PANDA –type PM fiber during chemical etching |
3. Experimental Results and Discussions
- Matched refractive index liquid has been dropped on the fibre to optically characterize the sensitivity of fabricated sensors. The attenuated optical power is detected in order to analyze the repeatability of the fiber sensor. The cladding thickness is then derived from theoretical model of Leminger and Zengerle [9]. Several theoretical models have been developed for giving an expression of light attenuation inside polished optical fibers as a function of the cladding thickness such as Vasallo [10], Leminger, Zengerle [9], and Sharma et al [11]. Leminger and Zengerle derived optical attenuation coefficient as a function of opto-geometrical parameters of single mode optical fibre with an approach of coupling between the fundamental mode of the single-mode fiber and the radiation modes in the external medium. This model has been adapted to our etched (PM) fiber geometry which exposes the two sides of the fiber core as shown in Fig 3. We found an excellent experimental repeatability higher than 0.4 um, even in a dynamic parameters environment. The experimental results are obtained by considering a light source at 1550nm wavelength. A matched refractive index liquid with n = 1.47 is deposed on different cladding thickness etched PM fibres.One of the reasons of the deviation between experimental and theoretical cladding thickness is due to the theoretical model which is not perfectly adapted to the exotic geometry of etched polarization maintaining optical fibres as well as to the error in the etching rates measurement. Although image processing and blob tracking are used to minimize the error in etching rates, the binarization with a simple threshold approach or even with an adaptive threshold is actually limited in the resolution. The error can be minimized by adaptative filtering of noise and improvements on microscopic images quality.
4. Conclusions
- We have presented a new method for determining the cladding thickness of etched (PM) fiber type PANDA under the same operating conditions and manufacturing of the sensor. The experience is based on a perpendicular immersion of a polarization maintaining optical fibre probe and by real time measurement of etching rates of both cladding and stress parts. Geometry of the fiber has been controlled by using an algorithm based on diffusion equations. The comparison between the experimental and the theoretical data show that the cladding thickness is determined by a maximum error that not exceed 0.4 µm. the major advantage of this method is the knowledge of the cladding thickness of the sensor during its chemical etching without disturbing the fabrication process. A future development of such technique consists on improvements on image processing techniques to reduce the deviation between theoretical and experimental results. This technique can also be used and experimented on photonic crystal fibres, D-fibres, bow-tie fibres, air core optical fiber and other exotic fibres to control more precisely the etching process.