Mohammed Bailich1, Mustapha Bahich2, Benaissa Bellach1, Mohammed Rahmoun1
1Equipe d’électronique et télécommunications, École Nationale des Sciences Appliquées, Université Mohammed Premier, Oujda, Morocco
2Equipe d’optique appliquée et traitement d’images, Faculté des sciences Ben Msik, Université Hassan II Mohammedia, Casablanca, Morocco
Correspondence to: Mohammed Bailich, Equipe d’électronique et télécommunications, École Nationale des Sciences Appliquées, Université Mohammed Premier, Oujda, Morocco.
| Email: |  |
Copyright © 2012 Scientific & Academic Publishing. All Rights Reserved.
Abstract
The optical methods of metrology are widely used in science and engineering to measure a wide range of parameters (such as deformations) that are related to the optical phase information coded in the intensity images. Two of mostly used techniques, namely a phase shifting algorithm (PS) and a wavelet transform algorithm (WT), are applied in order to estimate optical phase information, after an initial set of fringe patterns acquirement using the fringe pattern technique. In this paper, the 2D wavelet approach used to the phase retrieval problem for surface shape and object’s defect measurement is presented and comparatively evaluated. Aim of this paper is the in-depth investigation of the advantages of the 2D wavelet approach and the gain of a better insight on its use in the industrial context. Extensive work has been conducted for investigating the influence of several factors (such as the noises, the surface variation, the modulation rate, etc.) on the performance of the wavelet phase retrieval technique, while a detailed analysis of the obtained results is also given.
Keywords:
Computer vision, Defect detection, Fringe projection technique, Phase retrieval, Wavelet transform
Cite this paper: Mohammed Bailich, Mustapha Bahich, Benaissa Bellach, Mohammed Rahmoun, A Directional Space-scale Based Analysis Method for Three-dimensional Profile Detection by Fringe Projection Technique, International Journal of Optics and Applications, Vol. 3 No. 5, 2013, pp. 111-117. doi: 10.5923/j.optics.20130305.05.
1. Introduction
The phase retrieval in optical metrology is very important process for many industrial applications[1]. Many phase retrieval algorithms have been conceived which differ in the adopted approach such as Fourier transform method[2], phase shifting[3], direct phase detection and wavelet transform method[4]. It is well known in the digital signal processing theory that the wavelet transform and time- frequency analysis techniques are more suitable to analyze non-stationary signals than stationary ones[5]. One of the time-frequency analysis techniques that have been used successfully in fringe pattern demodulation is the wavelet transform. This technique has been dilated to exploit its suitability for fringe pattern demodulation. Two-dimensional continuous wavelet transform (2D-CWT) techniques have been used successfully to demodulate fringe patterns and retrieve the phase even when the recording process is accompanied by the presence of noise[6]. In this paper we propose the use of the 2D-CWT algorithm to demodulate fringe patterns and the study of some environmental parameters effects on the accuracy of results. In the following section, the fringe pattern technique is introduced. The background theory of the 2D-CWT fringe pattern demodulation algorithm is discussed in section 3. Computer-generated and real fringe patterns are used to test and discuss the effects of previously mentioned parameters on the phase retrieval algorithm reliability, and we conclude in sections 4 and 5 respectively.
2. Fringe Projection Technique
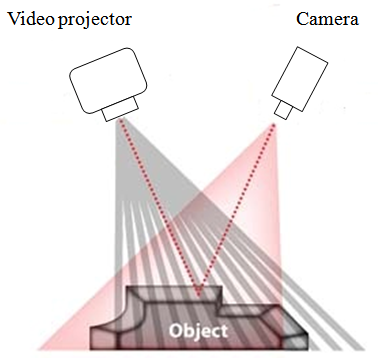
The fringe projection is an optical metrology technique that offers a topographic description of an illuminated surface (the object of test).This technique is based on the projection of a rectilinear fringes network from a video projector on the studied surface (or the object) which its distortions appear as a modification of the fringes orientation in the x & y axis[7]. This modification results from a variation of the phase distribution that is directly related to the object distortions: | (1) |
Where  is the phase, p is the interfringe, z is the distortion of interest and θ is the angle the CCD camera and the video projector.Therefore, to determine the z distortion we should retrieve first the phase distribution that codes the projected fringe pattern. There are many algorithm that can be used to demodulate fringe patterns, such as Fourier transform based algorithm, phase stepping, digital phase locked loop, direct phase detection and wavelet transform based method[8].
 | Figure 1. Fringe projection principle |
3. Wavelet Fringe Pattern Analysis Problem
Generally the intensity of a fringe pattern can be expressed as follows: | (2) |
Where  ,
,  and m are the average intensity, the fringe visibility and the modulation rate respectively.
  is the phase of fringe pattern and x&y are the simple indices for the x and y axis respectively.A fringe pattern tends to resemble to non-stationary signals. This motivates researchers to investigate wavelet transform as a time-frequency technique for fringe pattern demodulation problem. The wavelet transform can detect the local characteristics of signals and obtain a time–frequency description of it[9].A wavelet is an oscillating function with a compact width and a zero mean. A family of 2D analyzing wavelets are generated by translating the mother wavelet via the location parameter
 , dilating it with the scale parameter s>0 and rotating it by the angle
 . It can be expressed as[10]:
 | (3) |
 designates the rotation matrix by the angle α
 | (4) |
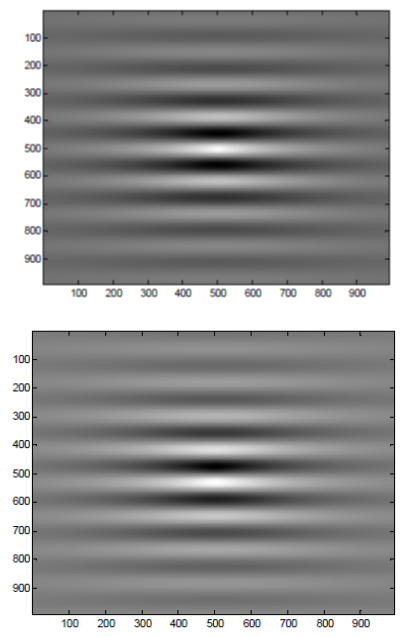
The complex Morlet wavelet that will be used in this work is essentially a plane wave within a Gaussian window and is given by  | (5) |
With α is the rotation angle. The Fourier transform of this wavelet is | (6) |
 | Figure 2. 2D Morlet wavelet, (a) Real part, (b) Imaginary part |
The 2D-CWT of a two-dimensional signal  is given by:
 | (7) |
Where  In 2D-CWT, the fringe pattern
  is projected onto the wavelets
  basis and the resulted wavelet coefficients
  reach their maximal value when the two dimensional analyzing wavelet and the fringe pattern are locally more similar and their frequencies are very close. To demodulate a fringe pattern, its wavelet transform is first calculated. Then, the ridge of the wavelet coefficients array
  for each pixel in the fringe pattern with the coordinates
  is detected and its corresponding coefficient argument will be taken as the pixel’s phase:
 | (8) |
 | (9) |
Where  and
and  are the scale and rotation angle corresponding to ridge value.
4. Results and Discussions
In the numerical simulation, a computer generated phase that is shown in Fig.3-a and is described by the following equation is generated. | (10) |
The resultant modulated fringe pattern by the phase distribution is shown in Fig.3-b and given by the equation  | (11) |
With the modulation rate m is set to 0.6 radian/pixel.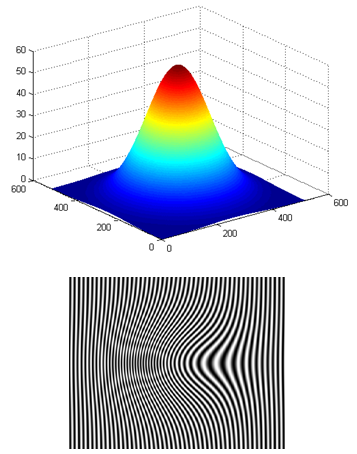 | Figure 3. (a) A computer-generated object, (b) its corresponding fringe pattern |
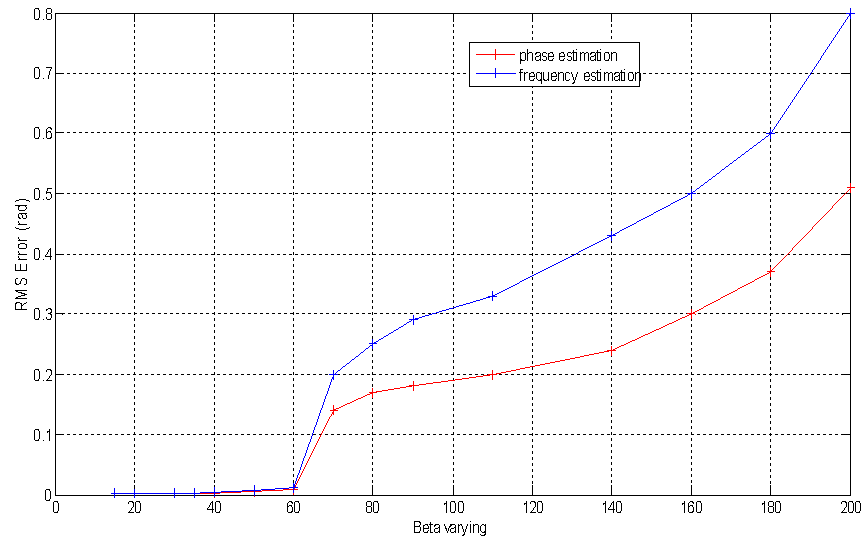
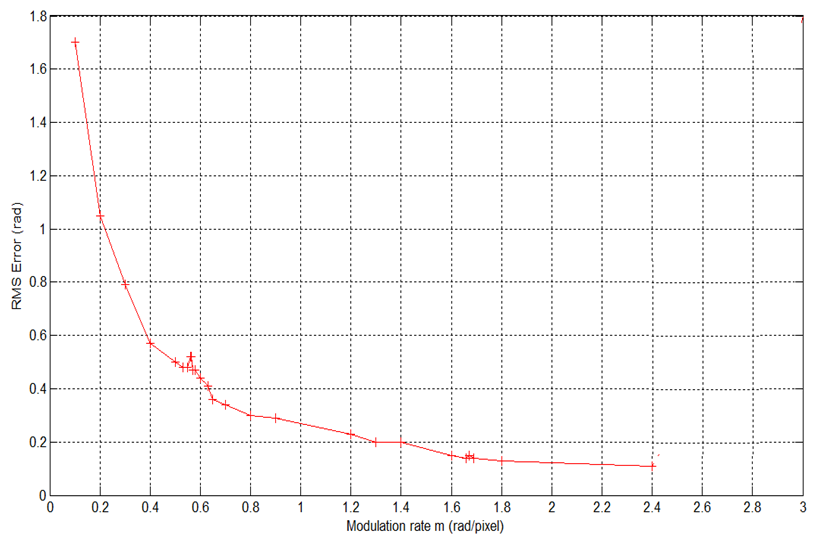
We suppose that the acquisition of the fringe pattern is made by a CCD camera with resolution 512 x 512 and the pixel dimension equals to 7.4 x 7.4 μm.There are different noise types in real world. Multiplicative noise is common beside additive noise. Multiplicative noise, that is naturally dependent on the image data, is multiplied by (not added to) the original image. In this study, the multiplicative noise that will be used is the known as speckle noise.To analyze the noise immunity of the wavelet analysis algorithm, we apply it to several examples of the previous fringe pattern with both additive and multiplicative increasing Gaussian noise levels. The fig.4-a presents, in the case of additive noise, the plots of RMS (Root mean square) errors of the estimated phase distributions with the noise variance for the both frequency and phase based algorithms. The Fig.4-b presents the obtained RMSE results in the multiplicative noise case.The analysis of these results shows clearly that the phase based wavelet analysis algorithm gives the best values of the phase distribution with less error values. This is certainly due to the fact that the phase distribution is slowly variable and it presents small spatial frequencies values that are very affected by noise and especially in the presence of multiplicative one.Another issue that affects the performance of the fringe pattern demodulation algorithm is the high spatial frequencies variance of the surface object. Fig.5 shows the RMS error values of the obtained phase with the object spatial frequency increment β. With increasing values of β, as shown in Fig.5, the RMSE values of the estimated phase increase for both of algorithms. It can be seen that RMSE goes on reducing as the object surface is slowly variant and while β value keeps under 60 where can be observed that the algorithms lead to an accurate phase computation.Notice that in this part, we fix the modulation rate with varying the maximal spatial frequency that the phase distribution contains. The results analysis confirms the theoretical claim that for small values of the maximal spatial frequency that are less than the modulation rate m the wavelet phase retrieval method exhibits a higher precision, whereas for the higher values of the maximal spatial frequencies than m the method couldn’t estimate accurately the phase map. Fig.6 shows effect of the variation of carrier frequency[11] (i.e modulation rate) on the accuracy of the estimated phase map. In Fig.6, which is the case where the maximum spatial frequency containing in the phase distribution is 1.6 rad/pixel, the RMSE is considerably high when the modulation rate is less than the maximum high frequency. When the modulation rate is higher than 1.6 rad/pixel, the obtained RMS error is constant as can be seen from Fig.6 and has an average of 0.1 rad. The phase recovery will remain accurate if a spatial carrier is added so as to remove the deformation sign ambiguity, and at the same time, to reduce the noise effect.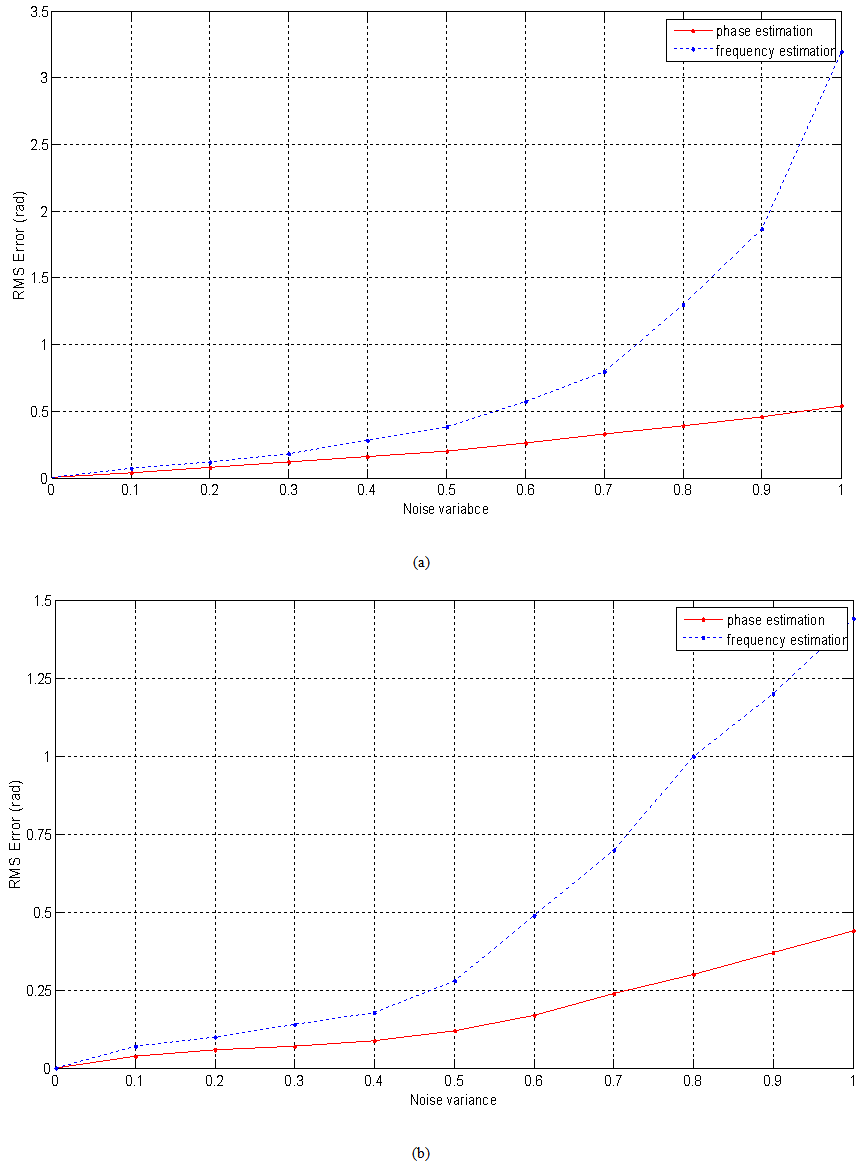 | Figure 4. RMS Errors versus noise variance. (a) additive noise, (b) multiplicative noise |
 | Figure 5. RMS Error versus maximal spatial variation |
 | Figure 6. RMS Error versus modulation rate |
In the experimental work, a main part of a doll body was used as test object to measure its height profile (Fig.7). To obtain the height variation of reference plane and the carrier frequency of the projected fringes in the image plane, the CCD camera was focused to the center of the projected fringe pattern and then reference image was stored to camera’s memory as RGB image. After this, the main part of the doll’s body was put on the reference plane and object image stored into the camera as shown in Fig.8. These stored two images later downloaded to computer for analysis.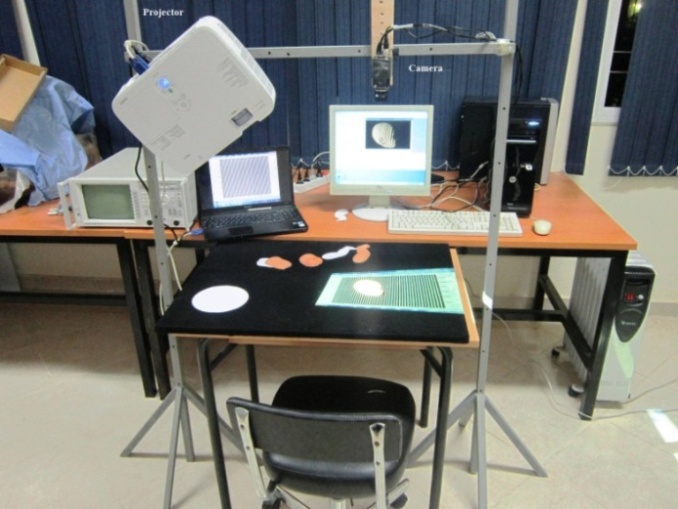 | Figure 7. The fringe projection setup |
The fringe projection system sensitivity increases with the projection angle; however, a large angle between the projection and viewing directions may produce an unwanted shadow on the object. This shadow will lead to areas with missing data where the object cannot be contoured. To overcome this problem and provide the best results, an angle no larger than the largest slope on the surface should be chosen, and also by using an appropriate phase unwrapping algorithm that can identify the low quality shadow areas in the wrapped phase map and produce an almost optimal result for them. The use of multiple projectors in fringe projection profilometry has also been reported very useful to solve some problems like the accurate 3D estimation in presence of local shadows[12].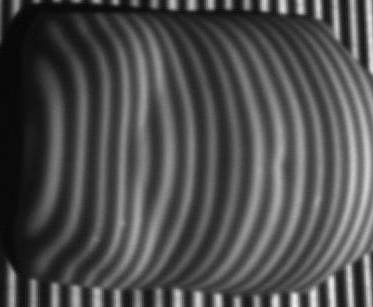 | Figure 8. Projected sinusoidal fringes on main part of the doll |
The procedure outlined above was used to extract the phase from the real image that is shown in Fig.8. The 2D continuous wavelet transform of reference image and object image were first calculated in the Matlab environment. The wrapped phase of the reference fringe image and object fringe image were calculated from their complex values and an appropriate unwrapping procedure was used to correct discontinuities in the wrapped phases. Finally phase distribution of object is calculated by subtracting the carrier using the reference phase and the height distribution of the object that was calculated using experimental parameters is shown in Fig.9.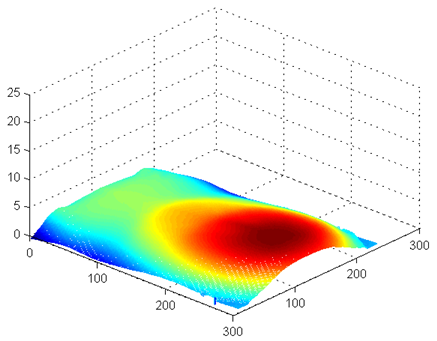 | Figure 9. 3D height profile of main part of the doll |
5. Conclusions
This paper has studied the wavelet phase retrieval technique and has evaluated and compared its capabilities in terms of demodulating projected fringe patterns. Two-dimensional continuous wavelet transform has been used to retrieve the phase distribution of a fringe pattern. We conclude that the wavelet phase based algorithm should be used when the signal to noise ratio of fringe pattern is high and also when the rapid variations (i.e high spatial frequencies) present. We has also seen that the accuracy of the estimated phase is satisfactory for the cases where the signal to noise ratio of the projected fringe pattern is low, even without fringe pattern filtering. The detailed investigation of the technique presented here has revealed that the Morlet wavelet, in conjunction with the high frequency carrier (i.e high modulation rate) performs better in terms of noise immunity and accuracy in demodulating fringe patterns. In conclusion, both simulation and physical experiments show that the directional wavelet based fringe analysis algorithm is able to provide surface height measurements with a better reliability using one single fringe pattern that can easily be recorded by the detection system. As a future work, we tend to investigate more directional transforms for fringe pattern processing and metrological problems solutions.
ACKNOWLEDGEMENTS
The authors want to show gratitude to the reviewers for their helpful comments and suggestions.
References
| [1] | A. Patil and P. Rastogi, Moving ahead with phase, Opt and Lasers in Eng. 45 (2007) 253–257. |
| [2] | M. Takeda, H. Ina and S. Kobayashi, Fourier-transform method of fringe-pattern analysis for computer-based topography and interferometry, JOSA. 72 (1982) 156-160. |
| [3] | Song Zhang, Shing-Tung Yau, High-resolution, real time 3D absolute cordinate measurement based on phase-shifting method, Opt. Express 14 (2006) 2644-2649. |
| [4] | M. Afifi, A. Fassi-Fihri, M. Marjane, K. Nassim, M. Sidki, S. Rachafi, Paul wavelet-based algorithm for optical phase distribution evaluation, Optics Comm 211 (2002) 47-51. |
| [5] | C. Torrence and G. P. Compo, A practical guide to wavelet analysis, Bulletin. American Meteo. Soc. 79 (1998) 61–78. |
| [6] | M Bahich, M Bailich, A Imloul, M Afifi, EM Barj, A comparative study of one and two-dimensional wavelet-based techniques for noisy fringe patterns analysis, Opt. Comm. 290 (2013) 43-48. |
| [7] | C. Quan, W. Chen, C.J. Tay, Phase-retrieval techniques in fringe-projectionprofilometry, Opt. Lasers. Eng. 48 (2010) 235-243. |
| [8] | T. Yoshizawa, Handbook of Optical Metrology: Principles and Applications, CRC Press, 2009. |
| [9] | Q. Kemao, H. S. Seah and A. Asundi, Wavelets in optical metrology, Persp. Eng. Optics. (2003) 117-133. |
| [10] | J.-P. Antoine, R. Murenzi, Two-dimensional directional wavelets and the scale-angle representation, Signal Proc. 52 (1996) 259-281 |
| [11] | M Bahich, M Afifi, EM Barj, A numerical spatial carrier for single fringe pattern analysis algorithm, Optik. 122 (2011) 1821-1824. |
| [12] | Y. Cai, X. Su, Inverse projected-fringe technique based on multi projectors, Opt. Laser Eng. 45 (2007) 1028-1034. |


 is the phase, p is the interfringe, z is the distortion of interest and θ is the angle the CCD camera and the video projector.Therefore, to determine the z distortion we should retrieve first the phase distribution that codes the projected fringe pattern. There are many algorithm that can be used to demodulate fringe patterns, such as Fourier transform based algorithm, phase stepping, digital phase locked loop, direct phase detection and wavelet transform based method[8].

 ,
,  and m are the average intensity, the fringe visibility and the modulation rate respectively.
  is the phase of fringe pattern and x&y are the simple indices for the x and y axis respectively.A fringe pattern tends to resemble to non-stationary signals. This motivates researchers to investigate wavelet transform as a time-frequency technique for fringe pattern demodulation problem. The wavelet transform can detect the local characteristics of signals and obtain a time–frequency description of it[9].A wavelet is an oscillating function with a compact width and a zero mean. A family of 2D analyzing wavelets are generated by translating the mother wavelet via the location parameter
 , dilating it with the scale parameter s>0 and rotating it by the angle
 . It can be expressed as[10]:
 designates the rotation matrix by the angle α


 is given by:
 In 2D-CWT, the fringe pattern
  is projected onto the wavelets
  basis and the resulted wavelet coefficients
  reach their maximal value when the two dimensional analyzing wavelet and the fringe pattern are locally more similar and their frequencies are very close. To demodulate a fringe pattern, its wavelet transform is first calculated. Then, the ridge of the wavelet coefficients array
  for each pixel in the fringe pattern with the coordinates
  is detected and its corresponding coefficient argument will be taken as the pixel’s phase:

 and
and  are the scale and rotation angle corresponding to ridge value.


 Abstract
 Reference
 Full-Text PDF
 Full-text HTML