-
Paper Information
- Next Paper
- Paper Submission
-
Journal Information
- About This Journal
- Editorial Board
- Current Issue
- Archive
- Author Guidelines
- Contact Us
International Journal of Optics and Applications
p-ISSN: 2168-5053 e-ISSN: 2168-5061
2013; 3(5): 103-110
doi:10.5923/j.optics.20130305.04
Fringe Analysis and Coding of Holographically Reconstructed Wavefronts for Security Applications
C. Fundi Ominde1, G. Kihara Rurimo1, S. Maina Njoroge2, G. Nyauma Nyakoe3, P. Mwangi Karimi2, D. Mwenda Kinyua2
1Department of Physics, Jomo Kenyatta University of Agriculture and Technology, Nairobi, Kenya
2Department of Physics, Kenyatta University, Nairobi, Kenya
3Department of Mechatronic Engineering, Jomo Kenyatta University of Agriculture and Technology, Nairobi, Kenya
Correspondence to: G. Kihara Rurimo, Department of Physics, Jomo Kenyatta University of Agriculture and Technology, Nairobi, Kenya.
| Email: |  |
Copyright © 2012 Scientific & Academic Publishing. All Rights Reserved.
This study involvesrecording of transmission holograms of various objects which are processed to obtain phase holograms. Good quality holograms are obtained by optimizing the necessary parameters as presented in[29]. After replaying the hologram, distinctive fringes are observed in the reconstructed object wave at the back plane of the holographic plate. The fringes are recorded using a CCD camera interfaced with a computer. Three dimensional wavefront maps of the fringes reveal different surface profiles for all objects used in the study. Various errorsare measured for each recorded fringe pattern and found to varyaccording to the object used during hologram recording. This unique information is used as the input to generate sets of linear and 2–Dimensionalcodes that can be used for product authentication. Special scanners are proposed to read both the hologram and thebarcode for product verification.
Keywords: PhaseHologram, Diffraction Efficiency, Fringe contrast, Barcode
Cite this paper: C. Fundi Ominde, G. Kihara Rurimo, S. Maina Njoroge, G. Nyauma Nyakoe, P. Mwangi Karimi, D. Mwenda Kinyua, Fringe Analysis and Coding of Holographically Reconstructed Wavefronts for Security Applications, International Journal of Optics and Applications, Vol. 3 No. 5, 2013, pp. 103-110. doi: 10.5923/j.optics.20130305.04.
Article Outline
1. Introduction
- Holography is the science of producing holograms. It is a technique of recording the interference pattern between an object wavefront and a reference wavefront on a holographic medium[1]. Holograms are attractive optical elements that are used in security applications because of their unique property of being difficult to counterfeit. In parallel and real-time processing of objects having various dimensions, holograms are usedfor optical information encryption such as phase, wavelength and polarization.Such an encryption process adds integrity to the stored information and thus serves todeter unauthorized access, copying, or falsification of the authentic products and documents. These parameters of the optical waves have been exploited to realize various optical security systems[2, 3]. Representative examples of these systems include image encryption using random phase encoding, optical pattern recognition, fractional Fourier transform, joint transform correlation, phase only encryption amongst others[3, 4, 5]. The systems are excellent but many of them require accurately fabricated complex masks and fine control of the optical axis alignmentto encode and decode information. They also need specific and costly equipment to decrypt the encrypted information. Apart from these, several simple encoding schemes using holograms have been used. Such schemes have usedanencoded reference beam[6, 7, 8], Moire pattern encoding[9, 10, 11], speckle pattern encoding[12] amongst others for authenticity verification and anti-counterfeit purposes.There are two methods of acquiring and measuring fringes for the evaluation and testing of optical surfaces and systems. These are static fringe analysis and phase shift analysis. Static fringe analysis employs a framegrabber to digitally capture fringes produced using standard interferometry techniques andsoftware to analyze the fringes. It typically offers an accuracy of around λ/20 and has the benefit that the software results can be verified manually for simple peak to valley measurements[13, 14]. Phase shift analysis can improve accuracy by capturing the fringes with several different phases of the reference beam. This permits calculation of absolute phase for every pixel within the pupil, which increases accuracy and repeatability of measurements to around λ/100. This also allows anyfringe perturbation to be identified as a wavefront retardation or advance. The technique involves using a piezo transducer to move the reference optic by around λ/2 and utilizing dedicated phase shift analysis software to provide full analysis of circular, multiple, low contrast and nulled fringes[13, 15].The intensity pattern provided by these fringes encodes the physical quantity which is being measured. This intensity varies as the cosine of a phase which is directly proportional to that physical quantity. The processing of the interference fringes allows the extraction of the phase field from one or many intensity fields which have been acquired[14, 15]. The process of phase detection has received considerable attention in the last decade, as video acquisition and computer processing became more powerful and less expensive. An important issue is the assessment of the relation between the phase and the physical quantity to be measured, when this relation is not linear. This is of particular importance in profilometry[16]. Two main tracks can be followed when determining the phase. Theseare referred to as global and local approaches. In the global approach, often called the Fourier transform technique[16,17, 18] the whole intensity field is processed at the same time. The output phase data depend on the whole set of data in the intensity field. A carrier is necessary so that the phase modulation can be identified in the Fourier domain as the broadening of a well-defined frequency peak. This technique has two main advantages: first, only one intensity field is necessary; that is, one image has to be grabbed and dynamic events can be studied, and second, large phase modulations can be detected by extracting the analytic signal from the intensity field. For metrological applications, the main disadvantage of this technique is that the error on the calculated phase is difficult to evaluate, especially near edges. Another disadvantage is that it is not easy to fully automate, as some filtering in the Fourier plane has to be done that may depend on the pattern to be analyzed. The local approach is called phase-stepping or phase-shifting, and the phase is calculated from local intensity information. Two procedures exist, namely temporal and spatial phase-stepping. In temporal phase- stepping[19, 20, 21], a number of images are taken with a constant and known phase shift δ introduced between successive images. There is no requirement on the fringe pattern, and the calculated phase at a given pixel depends only on the intensities recorded at the same pixel, unless spatial smoothing is used. Obviously, dynamic events cannot be studied as the phase-stepping takes some time. In spatial phase-stepping[22, 23, 24], a carrier is necessary so that a given number N of contiguous pixels sample a period of the intensity signal.Once fringe patterns have been acquired and evaluation and testing of optical surfaces and systems is done, a set of unique codes are generated from their surface profile. This unique information is used as the input to generate another set of security codes to be used inverifying hologram authenticity. The security codes generated in our case are the barcodes. Abarcode is an optical machine readable representation of data relating to the object to which it is attached. Originally barcodes systematically represented data by varying the widths and spacing of parallel lines, and were referred to as linear or one-dimensional (1D). Later they evolved into rectangles, dots, hexagons and other geometric patterns in two dimensions (2D). Although 2D systems use a variety of symbols, they are generally referred to as barcodes as well. Originally barcodes were scanned by special optical scanners called barcode readers. Later, scanners and interpretive software became available on devices including desktop printers and smartphones[25]. An early use of one type of barcode in an industrial context was sponsored by the Association of American Railroads in the late 1960s. Developed by General Telephone and Electronics (GTE) and called KarTrak ACI (Automatic Car Identification), this scheme involved placing colored stripes in various combinations on steel plates which were affixed to the sides of railroad rolling stock. Two plates were used per car, one on each side, with the arrangement of the colored stripes representing things such as ownership, type of equipment, and identification number[26] The plates were "read" by a trackside scanner located, for instance, at the entrance to a classification yard while the car was moving past[27] The project was abandoned after about ten years because the system proved unreliable after long-term use in the field. Barcodes became commercially successful when they were used to automate supermarket checkout systems, a task for which they have become almost universal. Their use has spread to many other tasks that are generically referred to as automatic identification and data capture (AIDC). The very first scanning of the now ubiquitous Universal Product Code (UPC) barcode was on a pack of Wrigley Company chewing gum in June 1974[28]. The simplicity, universality and low cost of barcodes have limited the role of other systems in the last 40 years after the introduction of the commercial barcode.
2. Recording and Reconstruction of Holograms
- To record the holograms the set-up presented in[29] was used. A 35mW linearly polarized Helium Neon Laser of wavelength 632.8 nm was used as a light source. Light from the Laser was spatially filtered using a microscope objective lens of magnification X10 and a 30μm diameter pinholelocated at the focal point of the microscope objective lens.Before exposing the holographic plate, the set-up was allowed to stabilize for about 120 seconds and the stability of the Laser beam was ensured by monitoring through a spectrum analyser. The holographic plate was ready for processing after exposing it. The processing involved two major processes namely: the developing process and bleaching process. These were carried out in darkness before the film was allowed to dry in the open. The composition of the developer solution included pyrogallic acid, sodium carbonate and ascorbic acid while the bleaching solution used was madefrom potassium dichromate, sulphuric acid and distilled water as discussed in[29]. To replay the hologram, the dry processed holographic plate was placed back in the holder and illuminated using the reference beam only while blocking the object beam as presented in Figure 1. This way the object beam was reconstructed. In order to determine the quality of the hologram images recorded, the diffraction efficiency of each hologram image was measured by determining the power of the first order diffracted beam and the incident beam of the reconstructed wavefront.
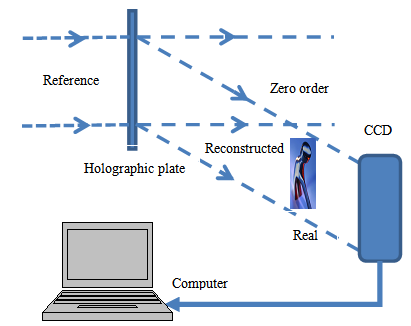 | Figure 1. Schematic illustration of hologram reconstruction set-up and recording of fringes from reconstructed object wavefront using the CCD camera interfaced to the computer |
3. Results and Discussion
3.1. Analysis of the Fringe Patterns
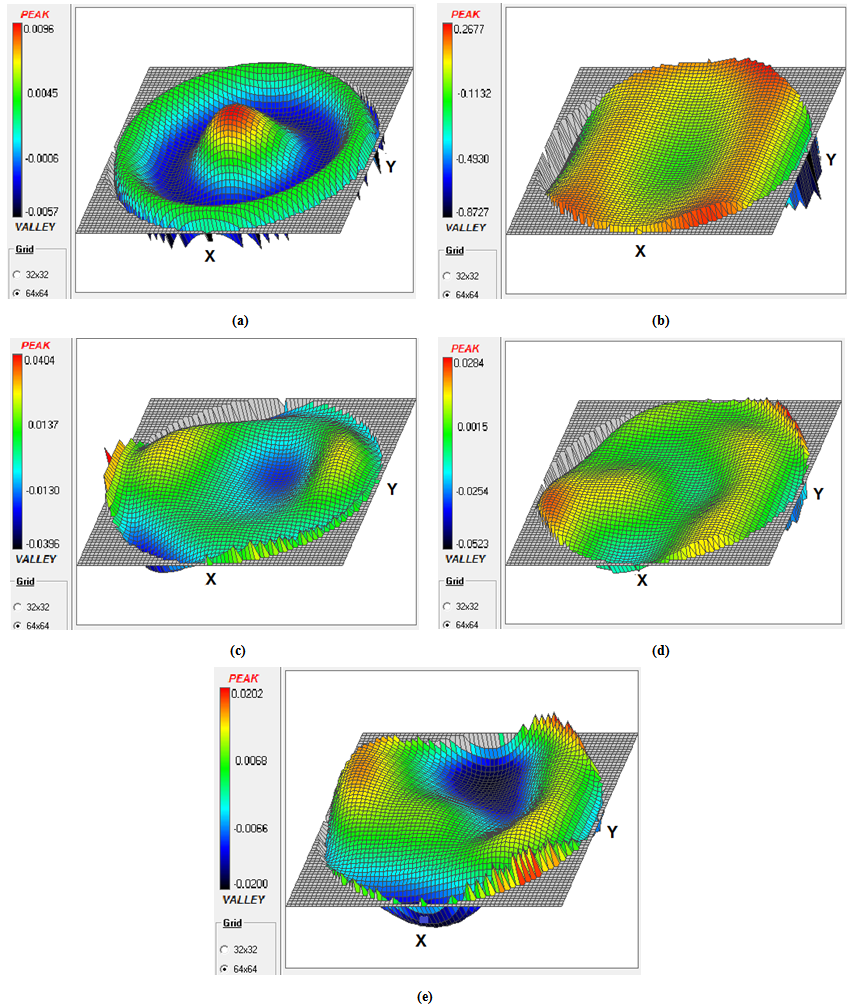
- Hologram images were evaluated by measuring their respective diffraction efficiencies. Determination of hologram diffraction efficiency as a function of exposure time was also done. A maximum diffraction efficiency of 21% was achievedwith plane wave holograms. Digital photographs of the objectholograms taken in this research are presented in[29]. The recorded object holograms haddifferent diffraction efficiencies. This was attributed to the difference in surface profile of the objects used. The object with high reflecting surface (The one Shilling Kenyan coin) gave holograms of high diffraction efficiency in comparison with the other objects whose surfaces were dull. Therefore it implies the higher the diffraction efficiency of the hologram the brighter the hologram. Investigation of the fringes from the holographic plate once illuminated by the reference beam was carried out. Here, a CCD camera was placed on the observation plane behind the holographic plate where the object wavefront was being reconstructed. The fringes on this plane were recorded for each of the objects and are illustrated in Figure 2.
3.2. Error Coding for Security Applications
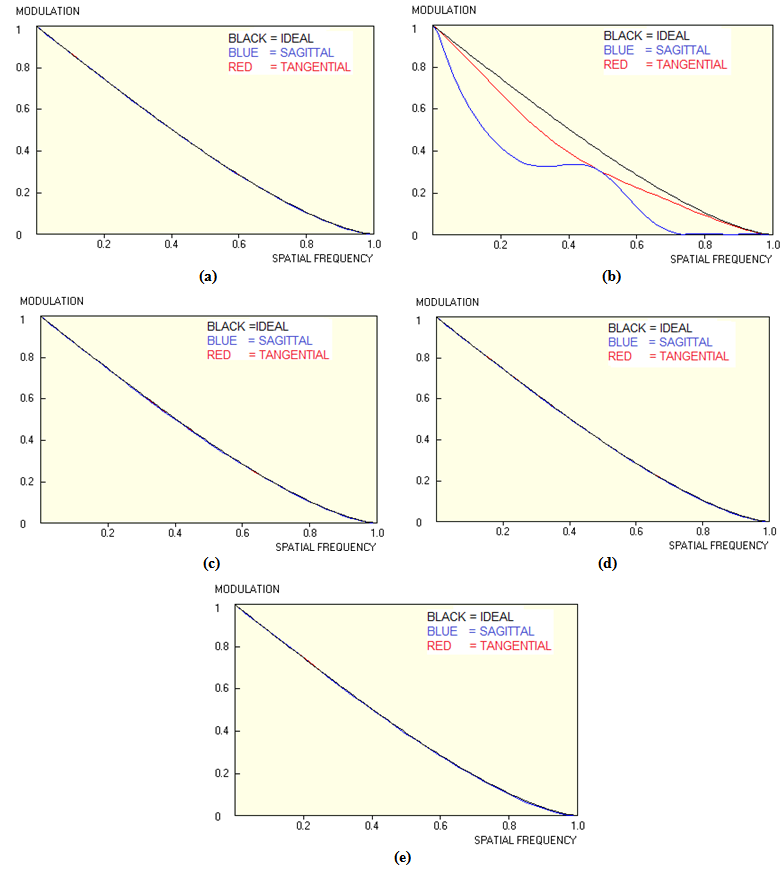
- From Figure4, it is clear that even though most ofthe MTF graphs are similar in their shape, they do notmatch exactly onto one another. A closer look at the sagittal and tangential rays shows slight deviations from one set to another, however, Figure 4 (b) gives out very distinctive characteristics of MTF as compared to the rest. This is attributed to the nature of the surface profile of theKenyan one Shilling coin. It has a crown of the court of arms and other information of different depth on the same surface. Its characteristic aluminium luster alsomakes it a good reflector. With all the above background information, it was important to look for characteristic standards representative of each object hologram. Here, the aberrations of the fringe pattern arising from the holographically reconstructed wavefront; which were very distinctive relative to the objects, were determined. Both the peak to valley, RMS, Strehl ratio, low order Astigmatism, low order Coma and low order Spherical aberrations were measured. It is observed that each object introduced different aberrations on the fringe pattern as confirmed by the different values in Table 1. These characteristic aberration valuesof theobject surface can easily be used as the input to any digital system.The advantage here is that they carry special distinctive information about the surface profile of the hologram already developed.It is these values that were used as the inputs to the bar code studio software to generate different bar codes for the objects holograms already developed. Different bar codes were generated for the different inputs used. This therefore implied that despite the security hologram obtained, a characteristic bar code was generate dusing the aberrations on the fringes as the input values listed in Table 1. Therefore during authentication process, two things will be verified, the hologram and the bar code values which are representative of the aberrations on the hologram surface. However, special scanners should be designed to read both the hologram and the bar code at the same time, compare the two values and either pass or fail the authentication process. Both the one dimensional linear bar codes and two dimensionaldot codes were generated for the set of hologramsdeveloped.
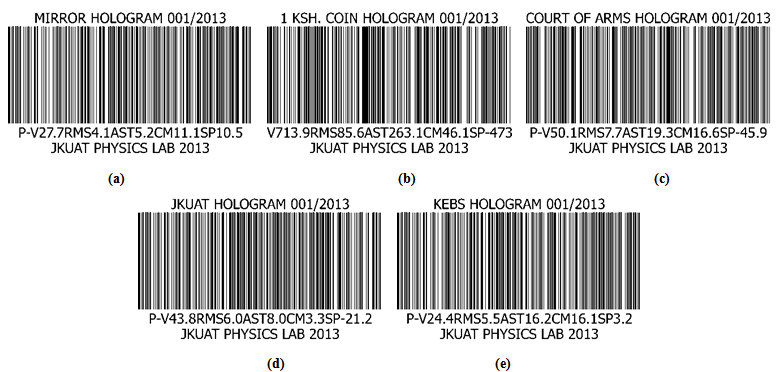 | Figure 5. Telepen Alpha linear bar codes for (a) Plane wave interference hologram. (b) One Shilling Kenyancoin hologram. (c) The Kenyan Court of Arms hologram. (d) Jomo Kenyatta University of Agriculture and Technology (JKUAT) logo hologram. (e) Kenya Bureau of Standards (KEBS) logo hologram |
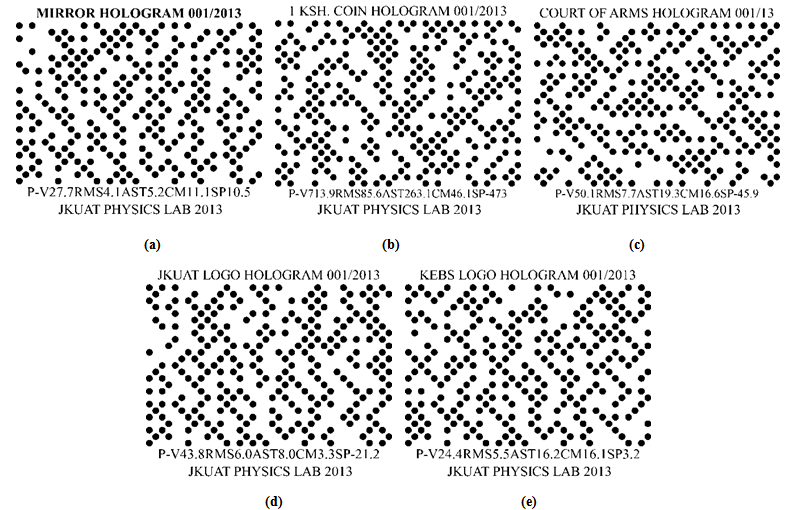 | Figure 6. 2–D dot codes for (a) Plane wave interference hologram. (b) One Kenyan shilling coin hologram. (c) The Kenyan Court of Arms hologram. (d) Jomo Kenyatta University of Agriculture and Technology (JKUAT) logo hologram. (e) Kenya Bureau of Standards (KEBS) logo hologram |
4. Conclusions
- A study was carried out to determine whether the fringes formed on the object plane of phase holograms had same properties or not. The experimental results presented in the paper shows that straight line fringes are produced in all the reconstructed object beam images. However, on analysis, the properties of these straight line fringes were found to be different. Each respective object gave out a distinctive reconstructed wavefront surface profile, Modulation Transfer Function and wavefront aberrations. There also exists a relation between the qualities of the hologram images and their respective diffraction efficiency. High diffraction efficiency hologram resulted to bright hologram images. The surface profile of incident object also affects the diffraction efficiencies of holograms under the same processing conditions. Plane wave interference hologram gave the highest diffraction efficiency of 21% while the Court of arms hologram gave a low diffraction efficiency of 13.75%. From the study, it was found that the reconstructed object beam carried unique information about the incident object. This information was represented inform of surface aberration and Zernike functions. The unique information is encoded and used to generate set of codes that are used as security features on products. Authentic products could feature both the bar code and the hologram. However, special scanners and software would be required for reading and decoding both the hologram and the barcode. On replaying, the special scanner will read both the hologram and the bar code. Decoding the barcode generates the surface aberration values of the said hologram. Similarly, the holographic scanner would read the hologram and the interference pattern on the image plane. This would be decoded via software to generate the aberration on the hologram surface. The two values of aberration would be compared and the system either passes or fails the authentication process of the product.
ACKNOWLEDGEMENTS
- The authors appreciate the government of Kenya for funding this project through the National Council of Science and Technology (NCST).
References
| [1] | M.B. Dongare, V.J. Fulari, and C.S. Pawar, Monitoring intrinsic stress induced in the CdSe thin films deposited by double exposure holographic interferometric technique, Chalcogenide letters, 7, 7, 455-463, 2010. |
| [2] | R. Kumar, D. Mohan, A. K. Aggarwal, Interferometric key readable security holograms with secrete-codes, Pramana, 68, 3, 443-450, 2007. |
| [3] | B.Javidi (ed), Optical and digital techniques for information security, Springer-Verlag, Berlin, 2005. |
| [4] | D. H.Seo and S J Kim, Interferometric phase-only optical encryption system that uses a reference wave, Opt. Lett. 28, 304, 2003. |
| [5] | M. S.Millan, E Perez-Cabre and B Javidi, Multifactor authentication reinforces optical security, Opt. Lett. 31, 721, 2006. |
| [6] | S. Lai, Security holograms using an encoded reference wave, Opt. Eng. 35, 2470, 1996. |
| [7] | A. K.Aggarwal, S K Kaura, D P Chhachhia and A K Sharma, Encoded reference wave security holograms with enhanced features, J. Opt. A: Pure Appl.Opt. 6, 278, 2004. |
| [8] | A. K. Aggarwal, S K Kaura, A K Sharma, R Kumar and D P Chhachhia, Interferometry based security hologram readable with an encoded key hologram Ind. J. Pure Appl. Phys. 42, 816, 2004. |
| [9] | X. Zhang, E Dalsgaard, S Liu, H Lai and J Chen, Concealed holographic coding for security applications by using a moiré technique,Appl. Opt. 36, 8096, 1997. |
| [10] | A. K.Aggarwal, S K Kaura, D P Chhachhia and A K Sharma, Concealed moiré pattern encoded security holograms readable by a key hologram,Opt. Laser Technol. 38, 117, 2006. |
| [11] | S. K.Kaura, D P Chhachhia and A K Aggarwal, J., Interferometric moiré pattern encoded security holograms, Opt. A: Pure Appl. Opt. 8, 67, 2006. |
| [12] | S. L.Yeh, Light-diffusion mark constituted with two-dimensional speckle patterns for enhancing hologram anticounterfeitingcharacteristics,Opt. Eng. 43, 573, 2004. |
| [13] | J. H. Bruning, Fringe scanning interferometers. In D. Malacara, editor, Optical shop testing, 414, Wiley, New-York, 1987. |
| [14] | S. Toyooka, M. Tominaga, Spatial Fringe Scanning for Optical Phase Measurement, Opt. Commun. 51, 68–70, 1984. |
| [15] | T.R. Judge, P.J. Bryanston-Cross, A review of phase unwrapping techniques in fringe analysis, Opt. Eng., 21, 4, 199–239, 1994. |
| [16] | M. Takeda, Spatial carrier fringe pattern analysis and its applications to precision interferometry and profilometry: an overview. Industrial Metrology, 1, 79-99, 1990. |
| [17] | J. B. Liu and P. D. Ronney, Modified Fourier transform method for interferogram fringe pattern analysis. Appl. Opt., 36(25), 6231-6241, 1997. |
| [18] | M. Takeda and K. Mutoh, Fourier transform profilometry for the automatic measurement of 3-D object shapes. Appl. Opt., 22, 3977- 3982, 1983. |
| [19] | J. H. Bruning, D. R. Herriott, J. E. Gallagher, D. P. Rosenfeld, A. D. White, and D. J. Brangaccio, Digital wavefront measuring interferometer for testing optical surfaces and lenses, Appl. Opt., 13, 2693-2703, 1974. |
| [20] | C. L. Koliopoulos,Interferometric optical phase measurement techniques. PhD thesis, University of Arizona, Tucson, AZ, 1981. |
| [21] | K. A. Stetson and W. R. Brohinsky, Electro optic holography and its application to hologram interferometry. Appl. Opt., 24, 3631- 3637, 1985. |
| [22] | M. Kujawinska and J. Wojciak, Spatial-carrier phase-shifting technique of fringe pattern analysis. In W. P. Juptner, editor, Industrial Applications of Holographic and Speckle Measuring Techniques, volume SPIE 1508, 61-67, 1991. |
| [23] | S. Toyooka and M. Tominaga, Spatial fringe scanning for optical phase measurement. Optics Communications, 51(2), 68-70, 1984. |
| [24] | K.H.Womack, Interferometric phase measurement using spatial synchronous detection. Opt. Eng. 23(4), 391-395, 1984. |
| [25] | M. Visich, Bar codes and their applications, State University of New York, Stony Brook, NY 11794, 1990. |
| [26] | Cranstone, Ian, A guide to ACI (Automatic Car Identificaiton)/KarTrak,Canadian Freight Cars.A resource page for the Canadian Freight Car Enthusiast. Ian Cranstone. Retrieved 30 May 2013. |
| [27] | Keyes, John, August 22, 2003, KarTrak, John Keyes Boston photoblogger, Images from Boston, New England, and beyond. John Keyes. Retrieved 30 May 2013. |
| [28] | Fox, Margalit, 15 June 2011, Alan Haberman, Who Ushered in the Bar Code, Dies at 81, The New York Times.Retrieved 30 May 2013. |
| [29] | C. F. Ominde, S. M. Njoroge, G. K.Rurimo, P. M. Karimi, D. M.Kinyua, G. N.Nyakoe,Optimal Conditions for High Diffraction Efficiency Phase Holograms, Int. J. Opt. &Appl., 3, 4, 2013. |
| [30] | C. Rydel, A Fizeau Interferometer, Do it Yourself, astrosurf/ astroptics, SociétéFrançaised’Astronomie. Retrieved 03 Feb 2013. |
 Abstract
 Reference
 Full-Text PDF
 Full-text HTML
