-
Paper Information
- Next Paper
- Previous Paper
- Paper Submission
-
Journal Information
- About This Journal
- Editorial Board
- Current Issue
- Archive
- Author Guidelines
- Contact Us
International Journal of Optics and Applications
p-ISSN: 2168-5053 e-ISSN: 2168-5061
2012; 2(5): 62-71
doi: 10.5923/j.optics.20120205.02
Optical Simulation of PV Solar Concentrators by two Inverse Characterization Methods
 Abstract
 Reference
 Full-Text PDF
 Full-Text HTML
Antonio Parretta 1, 2, Francesco Aldegheri 1, Andrea Antonini 3, Mariangela Butturi 3, Paolo Zurru 3
1Physics Department, University of Ferrara, Ferrara, 44122, Italy
2ENEA Centro Ricerche “E. Clementel”, Bologna, 40129, Italy
3CPOWER Srl, Marano Vicentino, 36035, Italy
Correspondence to: Antonio Parretta , Physics Department, University of Ferrara, Ferrara, 44122, Italy.
| Email: |  |
Copyright © 2012 Scientific & Academic Publishing. All Rights Reserved.
The optical characterization of solar concentrators for photovoltaic applications is increasing its importance with the recent first commercialization of some CPV technologies. In this paper two effective characterization methodologies are presented, applied to a representative optics of concentration. Two “inverse” methods are compared: the firstly presented inverse illumination method and another approach, derived by the inverse luminescence method, operating with electroluminescent light. Both use ideal lambertian sources for producing the inverse light path and can be applied to any type of solar concentrator (photovoltaic or thermodynamic). The optical simulations show their equivalence to get the angular distribution of the transmission efficiency function, but the original inverse illumination method demonstrates a simpler configuration and permits a significantly faster simulation process.
Keywords: Solar Concentrator, Nonimaging Optics, Optical Characterization, Modeling and Analysis
Cite this paper: Antonio Parretta , Francesco Aldegheri , Andrea Antonini , Mariangela Butturi , Paolo Zurru , "Optical Simulation of PV Solar Concentrators by two Inverse Characterization Methods", International Journal of Optics and Applications, Vol. 2 No. 5, 2012, pp. 62-71. doi: 10.5923/j.optics.20120205.02.
Article Outline
1. Introduction
- The concentration of solar radiation plays a key role in the field of renewable energies, as it can be effectively applied to thermal, thermodynamic, photovoltaic (PV) and even hybrid thermal/photovoltaic technologies[1−10]. In concentrating photovoltaic systems (CPV) the size of the photovoltaic receiver (solar cell) is reduced by a factor equal to the geometric concentration ratio, and this has a strong, positive impact on the cost of the total PV concentrator, opening perspectives for the use of more sophisticated and more efficient devices. The concentrating optics is one specific component of the photovoltaic concentrator. It must be designed to transfer the incident solar radiation to the receiver searching the maximal optical efficiency achievable within an angular range limited by physical constrains[11]. The concentrating optics should produce a concentrated flux with reduced non-uniformity on the receiver, in order to minimize ohmic losses[12,13], and should be designed with great attention to many aspects related to its final industrial application. These are, in particular: compactness, tolerance on assembling errors, low cost of manufacturing processes, optimal placement of the receiver for electrical and thermal issues, use of materials which can guarantee high reliability, high durability and low cost, high efficiency at the module and array level. This last point is related to the efficiency parameter, useful for a direct comparison with the standard flat-plate photovoltaics, calculated on the total intercepting area of the array, and not just, as sometimes it is found for CPV products, based on the efficiency of the optically active area. Indeed, this way to indicate the efficiency on the optical active area, useful for the design of the optics, may have a poorer impact on the system installation, where the most interesting aspects are the peak power achievable from each tracker of optimized cost, the land requested for total installed peak power and the achievable kWh/kWp. Pay attention to these aspects could have a fundamental impact on the final project of a CPV system; indeed, arrays with a relevant inactive/active optical area ratio risk to reduce the advantages of the CPV technology. All the previously indicated characteristics must be considered in the design of photovoltaic concentrators; many optical configurations have been proposed during the last years[1−5]; a large spectrum of possible designs, with different levels of effectiveness, can be achieved by applying the “nonimaging” optics[14−16].The fundamental quantities of a PV solar concentrating optics usually considered are the geometric concentration ratio and the optical efficiency, giving the optical concentration ratio, and the flux distribution on the receiver. These quantities are defined on the basis of the irradiation conditions, that is on the angle-resolved radiance of the light source. At mid-high concentration ratios, that means at collecting angles of the order of few degree or less, only the direct component of solar radiation is effective, and the input flux can be approximated by a parallel beam of known spectral irradiance and direction. The optical efficiency and flux distribution on the receiver should be evaluated therefore as function of the orientation of the beam respect to a reference frame joint with the concentrator, and as function of wavelength, if the experimental apparatus is provided for spectral measurements. We have in this way introduced the concept of “optical characterization” of a solar concentrator[17−21]. Different approaches can be followed to perform it; here we recall the most important methods, directly derived by our recent research on this subject[22−30]: the “direct” method and the “inverse” method, depending on the way the concentrator is irradiated, if from the input or the output aperture, respectively. In the “direct” method, the angle-resolved transmission efficiency is obtained irradiating the input aperture by a suitably oriented parallel beam, of known irradiance, and measuring the output flux; this has to be repeated for all the significant directions of incidence, which are strictly dependent on the symmetry of the concentrator. From the transmission efficiency curves obtained for the different azimuthal directions an “acceptance angle” is derived as a parameter that defines the angular limit within which the incident radiation is collected with a minimum value of efficiency. An alternative way to obtain the angle-resolved optical efficiency is the “inverse” method, a very effective method where the concentrator can be tested irradiating it from the output aperture, therefore reversing the light path which occurs during the normal operating conditions. It is characterized by a remarkable rapidity of measurements and by a very simple apparatus with respect to the direct method[22−30]. The main features of this method are summarized in the next section and compared with another “inverse” method, derived from a modification of the original one[31,32]. The two “inverse” methods are applied to a recently developed nonimaging photovoltaic concentrator, used in CPV modules and named Rondine®. The main purpose of this work is to show that, when the two inverse methods are suitably configured, they are able to give, by optical simulation, the same results in terms of the angle-resolved optical efficiency of the Rondine concentrator. Purpose of this work is also to show the advantages of the original inverse method in terms of simplicity and rapidity of simulation measurements. The same advantages of the original inverse method are expected for experimental measurements.
2. The “Inverse” Methods of Optical Characterization
- The original inverse method developed by A. Parretta et al.[22−30] for the characterization of solar concentrators is the most simple among the many methods based on measurements with a CCD camera. It involves the use of a lambertian and unpolarized source of light (ls) to be positioned at the output aperture of the solar concentrator (sc), in place of the receiver, for irradiating it in a reverse way, a planar lambertian screen (ps) to intercept the light at a far distance d, and a CCD camera for recording the image produced on the screen (see Fig. 1a). The inverse method was originally developed for PV solar concentrators, in which the receiver, a solar cell, is a planar device. For receivers with non planar geometry, the lambertian source has to be shaped to reproduce the profile of the receiver surface. When the inverse method is simulated, the planar screen is configured as an ideal absorber and the measured incident irradiance
 (see Fig. 1b) is converted into the radiance distribution function of the concentrator, ,
 by the
  factor. Indeed, if
  is a point on the screen,
  the corresponding incident irradiance and dS an elementary area around
  , the flux through area dS is
  and it is confined within the solid angle
  given by:
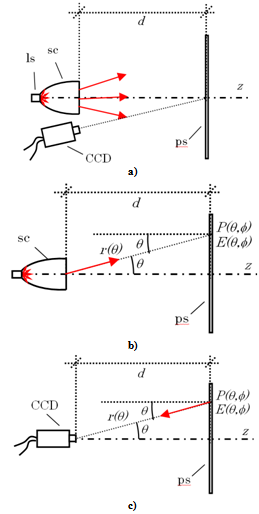 | Figure 1. (a) Schematic of the original “inverse” method; (ls): lambertian source; (sc): solar concentrator; (ps): planar screen. The CCD is shown inclined respect to the optical axis, but in reality it is almost aligned with it and close to the concentrator. (b) Schematic of the irradiation of the screen (ps) by the inverse light produced by the concentrator (sc). (c) Process of recording by the CCD of the image produced by the irradiance map on the planar screen (ps).  is a point on the screen and is a point on the screen and  is the corresponding incident irradiance is the corresponding incident irradiance |
 | (1) |
 direction will be therefore expressed by:
 | (2) |
 | (3) |
 reproduces the angular distribution of the optical transmission efficiency
  in “direct” irradiation mode; thus the two normalized functions coincide:
  | (4) |
 | (5) |
 factor. This is illustrated in Fig. 1c where the CCD is perfectly aligned with the optical axis of the concentrator. The intensity
  on the CCD and its corresponding normalized function Inorm(θ,φ) can be expressed as function of the incident irradiance
  on the screen as follows:
 | (6.1) |
 | (6.2) |
 because the screen is lambertian, and dependent only on the wavelength). From Eqs. (3), (4) and (6.2) we finally obtain the previously anticipated result for the transmission efficiency:
  | (7) |
 from the CCD image, being expressed as:
  | (8) |
 . The angular resolution must be smaller than the acceptance angle,
  , with
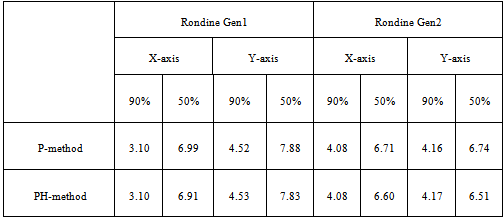
  defined as the angle at which the transmission efficiency drops to the 50% of the value at 0°[15,16]. For photovoltaic applications, the acceptance angle is conventionally defined in a different way, i.e. the angle at which the transmission efficiency drops to the 90% of the value at 0°. The “inverse method” allows to get also the absolute transmission efficiency function
  after performing the measure of
  (see Eq. (4))[22], resulting in this way completely alternative to the “direct method”. To this purpose, a modification of the measuring configuration is required: the lambertian screen is removed and replaced by the CCD oriented towards the input aperture of concentrator, as illustrated in Fig. 2a. The CCD records the image of the input aperture, which is elaborated in order to have the average intensity of the total aperture area and the average intensity of only the lambertian source area (see Fig. 2b). These two quantities are respectively proportional to the average radiance of the total aperture,
  , and to the average radiance of the lambertian source,
  . The on-axis transmission efficiency,
  , is given by the ratio between the two radiances, following a theoretical treatment presented in ref.[22]:
 | (9) |
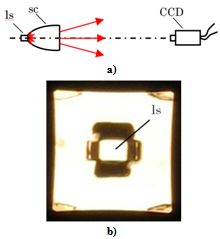 | Figure 2. a) Schematic of the “inverse” method for measure of ηdir (0); b) real image of the input aperture of the Rondine Gen1 as seen by the CCD |
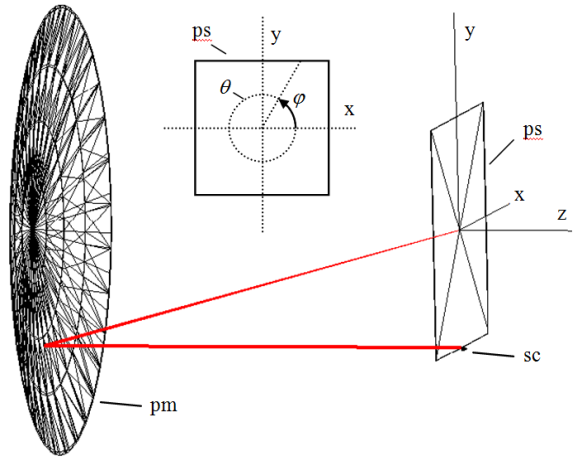 | Figure 3. Schematic principle of the Parretta-Herrero (PH) method used for simulating the optical properties of a generic solar concentrator. Rays exiting from different points of (sc) at the same polar angle θ and azimuthal angle φ, converge on the same point on the screen[31,32] |
3. Design Parameters and Calibration
- The optics of the photovoltaic concentrators used in this test of the characterization methods has been developed by CPower[36] and is called Rondine concentrator[37−42]. This optics has been selected because of its specific features, which permit to put in evidence all the performances of the inverse methods without reducing the generality of the characterization approach. Indeed, this optics is of small scale (few centimeters of lateral inlet aperture), it intercepts all the light emitted from the lambertian source and has smooth surfaces. These concentrators were developed by applying techniques of the nonimaging optics[14−16]; two types of concentrators, with different shape, concentration and dimensions were developed and manufactured: Rondine Gen1 and Rondine Gen2 (see Fig. 4); both of them have medium-low concentration levels, of 25x and 20x respectively. The basic idea for their design comes from the curvatures of CPC, with surfaces deformed in order to satisfy the electrical and mechanical constrains related to other characteristics required by the CPV module. Some aspects are similar to the CPC, because of the ideal optical peculiarities of this reference optics. The frontal aperture of these concentrators is squared, to allow a 100% filling factor in a rectangular module. The final effect is a concentrating unit with a peculiar four-pointed shape obtained by the removal of the four lateral walls produced by the squaring process. On each unit, the presence of four lateral walls parallel to the optical axis is not useful when the unit is embedded in the module; indeed, it should have the disadvantage of leading further losses of light energy for reflection on the non ideal surfaces.
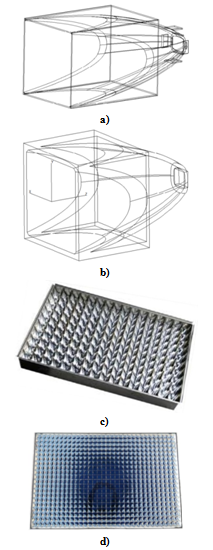 | Figure 4. a) CAD view of the boxed Rondine® Gen1. b) CAD view of the boxed Rondine® Gen2. c) Photo of the Rondine Gen 1 CPV module (Wp: = 95 W; Eff.: = 12% C = 20X). d) Photo of the Rondine Gen 2 CPV module (Wp: = 120 W; Eff.: = 16% C = 20X ) |
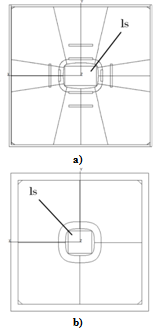 | Figure 5. Front view of the Rondine Gen1 (a) and Rondine Gen2 (b) input aperture, showing, at the center, the exit opening with inscribed the rectangular Lambertian source (ls) |
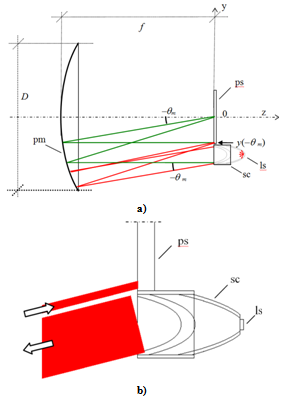 | Figure 6. a) Schematic principle of the Parretta-Herrero (PH) method. (Pm): parabolic mirror, (ps): planar screen, (sc): solar concentrator, (ls): lambertian source. D and f: diameter and focal length of (pm), respectively; l: side of the screen. The concentrator lies below the coordinate y(-θm) in such a way to avoid any interference with the rays exiting at θ>-θ m. b) It is shown a parallel beam emitted at θ=-θ m on the y/z plane, which focuses at the bottom edge of the screen (ps) |
 | (10) |
 | (11.1) |
 | (11.2) |
 | (12.1) |
 | (12.2) |
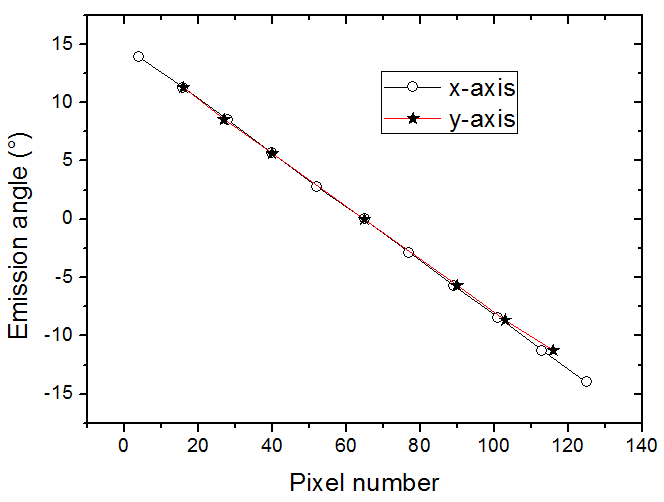 | Figure 7. Calibration curves of the emission angle vs. pixel number relative to the x and y axes of the screen |
4. Optical simulations
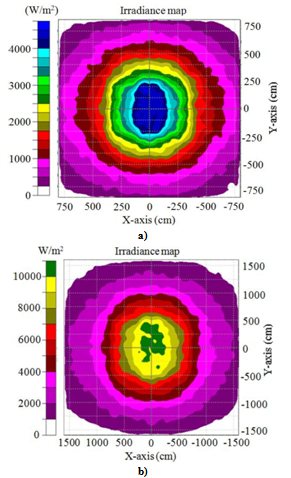 | Figure 8. Rondine® Gen1: a) flux distribution recorded on the screen (ps) for the P-method; b) flux distribution recorded on the screen (ps) for the PH-method |
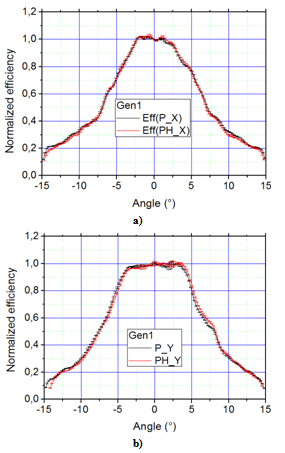 | Figure 9. Rondine® Gen1: X-axis (a) and y-axis (b) of the normalized optical efficiency profiles derived by the P-method and the PH-method |
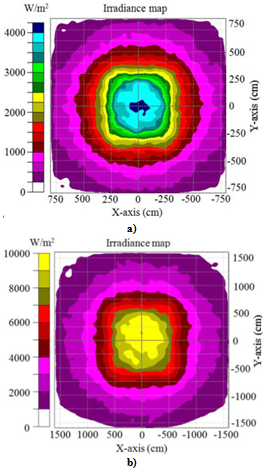 | Figure 10. Rondine® Gen2: a) flux distribution recorded on the screen (ps) for the P-method; b) flux distribution recorded on the screen (ps) for the PH-method |
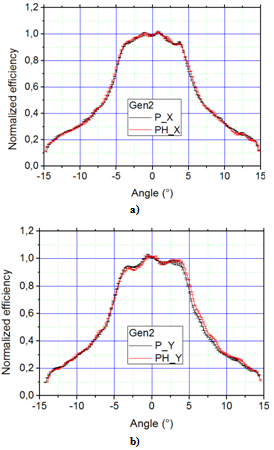 | Figure 11. Rondine® Gen2: X-axis (a) and y-axis (b) of the normalized optical efficiency profiles derived by the P-method and the PH-method |
5. Conclusions
- We have demonstrated the equivalence between two inverse methods of optical characterization of solar concentrators, the P-method and the PH-method. They were applied to two specific optics for PV solar concentrators, the Rondine® Gen1 and Gen2 nonimaging concentrators. The two methods were not specifically applied to particular solar cell devices, requiring evaluation of luminescence effects. The first inverse method (P-method) remains the most simple, fast and reliable for simulating any type of solar concentrator (photovoltaic or thermodynamic) and for indoor experimental measurements on small-size concentrators. The PH-method is more suitable for laboratory experimental measurements of large concentrators, requiring a reduced size of the characterization system, but introducing a complex calibration procedure and expensive equipment.
References
| [1] | A. Luque, S. Hegedus, “Handbook of Photovoltaic Science and Engineering”, John Wiley & Sons Ltd, Chichester, UK, 2011 (ISBN: 978-0-470-72169-8). |
| [2] | A. Luque, V.M. Andreev, “Concentrator Photovoltaics”, Springer-Verlag, Berlin, D, 2007 (ISBN:978-3-540-68796-2). |
| [3] | A. Martí, A. Luque, “Next Generation Photovoltaics”, Institute of Physics, Bristol, UK, 2004 (ISBN: 0-7503-0905-9). |
| [4] | V.M. Andreev, V.A. Grilikhes, V.D. Rumyantsev, “Photovoltaic Conversion of Concentrated Sunlight”, John Wiley & Sons, Chichester, UK, 1997 (ISBN: 0-471-96765-3). |
| [5] | A. Luque, “Solar Cells and Optics for Photovoltaic Concentrators”, Institute of Physics, Bristol, UK, 1989 (ISBN: 0-85274-106-5). |
| [6] | D. Barlev, R. Vidu, P. Stroeve, “Innovations in concentrated solar power”, Solar Energy Materials & Solar Cells, 95, pp. 2703-2725, 2011. |
| [7] | T.M. Razikov, C.S. Ferekides, D. Morel, E. Stefanakos, H.S. Hullal, H.M. Upadhyaya, “Solar photovoltaic electricity: Current status and future prospects”, Solar Energy, 85, 1580-1608, 2011. |
| [8] | J.S. Coventry, “A solar concentrating photovoltaic/thermal collector”, Ph.D.Thesis, Australian National University, Canberra, AUS, 2004. |
| [9] | D. Mills, “Advances in solar thermal electricity technology”, Solar Energy, 76, pp. 19-31, 2004. |
| [10] | S.A. Kalogirou, “Solar thermal collectors and applications” Progresses in Energy and Combustion Science, 30, pp. 231-295, 2004. |
| [11] | G. Smestad, H. Ries, R. Winston, E. Yablonovich, “The thermodynamic limits of light concentrators, Solar Energy Materials, 21, pp. 99-111, 1990. |
| [12] | A. Antonini, M. Stefancich, D. Vincenzi, C. Malagù, F. Bizzi, A. Ronzoni, G. Martinelli, ”Contact grid optimization methodology for front contact concentration solar cells”, Solar Energy Materials and Solar Cells, 80, pp. 155-166, 2003. |
| [13] | D. Vincenzi, M. Stefancich, S. Baricordi, M. Gualdi, G. Martinelli, A. Parretta, A. Antonini, “Effects of irradiance distribution uneveness on the ohmic losses of CPV receivers”, Proc. of 24th EU PVSEC, pp. 725-728, 2009. |
| [14] | J. Chaves, “Introduction to Nonimaging Optics”, CRC Press Taylor & Francis Group, Boca Raton, USA, 2008 (ISBN: 978-1-4200-5429-3). |
| [15] | R. Winston, J.C. Miñano, P. Benítez, “Nonimaging Optics”, Elsevier Academic Press, Amsterdam, NL, 2005 (ISBN: 978-0-12-759751-5). |
| [16] | W.T. Welford, R. Winston, “High Collection Nonimaging Optics”, Academic Press Inc, San Diego, USA, 1989 (ISBN: 0-12-742885-2). |
| [17] | P. Sansoni, F. Francini, D. Fontani, “Optical characterization of solar concentrator”, Optics and Lasers in Engineering, 45, pp. 351-359, 2007. |
| [18] | A. Parretta, F. Aldegheri, D. Roncati, C. Cancro, R. Fucci, “Optical Efficiency of "PhoCUS" C-Module Concentrators”, Proc. 26th EU PVSEC, European Commission JRC, pp. 658-663, 2011. |
| [19] | A. Parretta, A. Antonini, M. Stefancich, V. Franceschini, G. Martinelli, M. Armani, “Characterization of CPC solar concentrators by a laser method”, Proc.of SPIE Optics and Photonics Conference, Ed. D.R. Myers, 6652, pp. 665207-1-12, 2007. |
| [20] | J. Nilsson, “Optical design and characterization of solar concentrators for photovoltaics, Ph.D. Thesis, Lund University, Lund, S, 2005. |
| [21] | M. Brogen, “Optical efficiency of low-concentrating solar energy systems with parabolic reflectors, Ph.D. Thesis, Acta Universitatis Upsaliensis, Uppsala, S, 2004. |
| [22] | A. Parretta, D. Roncati, “Theory of the "inverse method" for characterization of solar concentrators”, Proc. of Optics for Solar Energy (SOLAR), Optical Society of America, STuE2, 2010. |
| [23] | A. Parretta, G. Martinelli, A. Antonini, D. Vincenzi, “Direct and inverse methods of characterization of solar concentrators”, Proc. of Optics for Solar Energy (SOLAR), Optical Society of America, STuA1, 2010. |
| [24] | A. Parretta, D. Roncati, L. Zampierolo, “Theoretical aspects of light collection in solar concentrators”, Proc. of Optics for Solar Energy (SOLAR), Optical Society of America, STuE1, 2010. |
| [25] | A. Parretta, A. Antonini, M. Butturi, E. Milan, P. Di Benedetto, D. Uderzo, P. Zurru, “Optical methods for indoor characterization of small-size concentrators prototypes”, Advances in Science and Technology, 74, pp. 196-204, 2010. |
| [26] | A. Parretta, G. Martinelli, E. Bonfiglioli, A. Antonini, M. Butturi, P. Di Benedetto, D. Uderzo, P. Zurru, E. Milan, D. Roncati, “Indoor optical characterization of the nonimaging “Rondine” PV solar concentrator”, Proc of 24th EU PVSEC, European Commission JRC, pp. 747-752, 2009. |
| [27] | A. Parretta, A. Antonini, E. Milan, M. Stefancich, G. Martinelli, M. Armani, “Optical efficiency of solar concentrators by a reverse optical path method”, Optics Letters, 33, pp. 2044-2046, 2008. |
| [28] | A. Parretta, A. Antonini, M. Butturi, P. Di Benedetto, E. Milan, M. Stefancich, D. Uderzo, P. Zurru, D. Roncati, G. Martinelli, M. Armani, “How to “display” the angle-resolved transmission efficiency of a solar concentrator reversing the light path”, Proc. of 23rd EU PVSEC, European Commission JRC, pp. 95-98, 2008. |
| [29] | A. Parretta, A. Antonini, M. Stefancich, G. Martinelli, M. Armani, “Inverse illumination method for characterization of CPC concentrators”, Proc. of SPIE, Optics and Photonics Conference, Ed. D.R. Myers, 6652, pp. 665205-1-12, 2007. |
| [30] | A. Parretta, A. Antonini, M. Stefancich, G. Martinelli, M. Armani, “Optical characterization of CPC concentrator by an inverse illumination method, Proc. of 22th EU PVSEC, European Commission JRC, pp. 740-744, 2007. |
| [31] | R. Herrero, C. Domínguez, S. Askins, I. Antón, G. Sala, “Two-dimensional angular transmission characterization of CPV modules”, Optics Express, 18 pp. A499-A505, 2010. |
| [32] | R. Herrero, C. Domínguez, I. Antón, S. Askins, G. Sala, “Tools development for CPV characterization based on CCD camera measurements”, Proc. of Optics for Solar Energy (SOLAR), Optical Society of America, STuA4, 2010. |
| [33] | B. Rossi, “Optics”, Addison Wesley, Reading, UK, 1957. |
| [34] | P. Würfel, “The chemical potential of radiation”, J. Phys. C: Solid State Phys., 15, pp. 3967-3985, 1982. |
| [35] | L. Ferraioli, P. Maddalena, E. Massera, A. Parretta, M.A. Green, A. Wang, J. Zhao, Appl. Phys. Lett., 85, pp. 2484-2486, 2004. |
| [36] | www.cpower.it |
| [37] | A. Antonini, M. Butturi, P. Di Benedetto, P. Zurru, D. Sartore, “In-Field performances of first commercial Rondine® PV concentrators”, Proc. of 26 th EU PVSEC, European Commission JRC, pp. 640-643, 2011. |
| [38] | A. Antonini, M. Butturi, P. Di Benedetto, E. Milan, D. Uderzo, P. Zurru, D. Sartore, “GEN2 Rondine® PV Concentrators”, Proc of 25th EU PVSEC, European Commission JRC, pp. 990-993, 2010. |
| [39] | A. Antonini, M. Butturi, P. Di Benedetto, E. Milan, D. Uderzo, P. Zurru, A. Parretta, N. Baggio, “Rondine PV concentrators: field results and innovations”, Proc of 24th EU PVSEC, European Commission JRC, Pub. N. JRC54285, pp. 150-155, 2009. |
| [40] | A. Antonini, M. Butturi, P. Di Benedetto, D. Uderzo, P. Zurru, E. Milan, M. Stefancich, M. Armani, A. Parretta, N. Baggio, “Rondine® PV concentrators: Field results and developments”, Progress in Photovoltaics, 17, pp. 451-459, 2009. |
| [41] | A. Antonini, M. Butturi, P. Di Benedetto, D. Uderzo, P. Zurru, E. Milan, M. Stefancich, M. Armani, A. Parretta, N. Baggio, “Development of “Rondine” concentrating PV module: Field results and progresses”, Proc. of 23rd EU PVSEC, European Commission JRC, pp. 898-902, 2008. |
| [42] | A. Antonini, M. Butturi, P. Di Benedetto, D. Uderzo, P. Zurru, E. Milan, M. Stefancich, M. Armani, A. Parretta, N. Baggio, “Experimental results of a new PV concentrator system for silicon solar cells”, Proc. of 22th EU PVSEC, European Commission JRC, pp. 727-730, 2007 |