-
Paper Information
- Next Paper
- Paper Submission
-
Journal Information
- About This Journal
- Editorial Board
- Current Issue
- Archive
- Author Guidelines
- Contact Us
International Journal of Optics and Applications
p-ISSN: 2168-5053 e-ISSN: 2168-5061
2012; 2(5): 56-61
doi: 10.5923/j.optics.20120205.01
Raman Spectroscopy: a Test Novel Technique for Quality Control In the Acetylsalicylic Acid
 Abstract
 Reference
 Full-Text PDF
 Full-Text HTML
J. C. Martínez 1, G. R. Bolaños 1, N. A. Chequer 1, A. I. Reyes 1, A. Cortes 1, J. L. González 2
1Mathematics and Biotechnology Academy, Instituto Politécnico Nacional-UPIIG, Silao de la Victoria, 36275, México
2Biophysics and Science life Laboratory, Universidad de Guadalajara-CULAGOS, Lagos de Moreno, 47460, México
Correspondence to: J. C. Martínez , Mathematics and Biotechnology Academy, Instituto Politécnico Nacional-UPIIG, Silao de la Victoria, 36275, México.
| Email: |  |
Copyright © 2012 Scientific & Academic Publishing. All Rights Reserved.
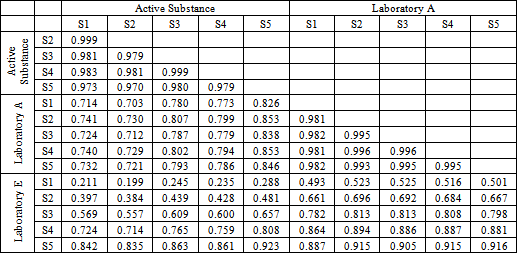
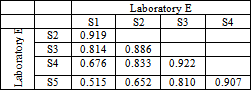
Raman spectroscopy (RS) is an inelastic scattering technique that is being recently applied in pharmaceutical applications. In this work this technique was applied to analyze the differences in concentrations of a commercial pharmaceutical form of an acetylsalicylic acid derivative present in tablets manufactured by five different laboratories (A, B, C, D and E). Meyer brand acetylsalicylic acid reagent was used to obtain spectral data as active principle. Five samples of different laboratories were also analyzed. We used a Raman microscopy device Horiba-JY HR800 with an excitation source of 830 nm and 17 mW. Raw data were analyzed by an arithmetic difference between the active substance from each different laboratory sample. Principal component analysis (PCA) was also applied to the spectral set to verify the differences in each pharmaceutical form of acetylsalicylic acid. We found a correlation of 0.7 between laboratory A and the active substance, and 0.98 between all spectra of the same laboratory A, we conclude that this drug was elaborated with better quality control. Results indicate that Raman spectroscopy can be applied in the pharmaceutical industry to determine adulteration or alteration in pharmaceutical formulations. We have demonstrate that RS together with PCA can be used as a fast and nondestructive method to determine the characteristics of the molecules present in commercially available drugs with very short acquisition times of few seconds.
Keywords: Pharmaceutical, Raman spectroscopy, Principal Components, Drug
Cite this paper: J. C. Martínez , G. R. Bolaños , N. A. Chequer , A. I. Reyes , A. Cortes , J. L. González , "Raman Spectroscopy: a Test Novel Technique for Quality Control In the Acetylsalicylic Acid", International Journal of Optics and Applications, Vol. 2 No. 5, 2012, pp. 56-61. doi: 10.5923/j.optics.20120205.01.
Article Outline
1. Introduction
- RS is an analytical technique based on the effect of the inelastic scattering of light arising from changes in the polarizability of electron cloud in the molecule[1-4]. This technique has become important in recent years due to its variety of applications in areas such as mineralogy, forensics, biology and medicine[5-9]. It is currently used for the characterization of drugs, bone structures, organic pesticides, among others[10-12]. RS has an important role in the analysis stage of the design of pharmaceutical products and production process. Spectroscopy applications in this field are the supervision control of industrial manufacturing processes to determine the distribution of active pharmaceutical ingredients and excipients in different stages of a development cycle. This technique offers unparalleled discrimination of materials because it is capable of analyzing liquid and solid samples. Furthermore, this tool is particularly suitable when used along with other analytical techniques because it provides a non-destructive analysis which requires little or no sample preparation. Most drugs are solid formulations, tablets and capsules. It is known that the state of a drug can have a significant impact on bioavailability and stability of it[13], therefore the identification and characterization of its properties salt formation, solvate formation, polymorphism, and degree of crystallinity become important in quality control. Pharmaceutical substances are subject to change in chemical composition and concentration during processing or storage of the formulation[14]. For the analysis of drugs apply a variety of methods such as colour tests, microcrystal tests, High Performance Liquid Chromatography (HPLC), UV spectroscopy, coupled gas chromatography mass spectrometry, infrared spectroscopy (IR) spectroscopy nuclear magnetic resonance (NMR), X-Ray diffraction, among others[15-21].One of the best drug is acetylsalicylic acid, it is widely used as analgesic and antipyretic. This compound is considered unstable, have crystalline appearance and hydrolysable in water[22].This compound has a crystalline appearance at room temperature. During the manufacture of this drug there may be several abnormalities that could not be detected during the process, changing the concentration or the substances that compose it, resulting in an adulterated product.Most of the counterfeit drugs takes place in Asian countries. The variety of these products has been extended due to its dissemination through the Internet, covering a bewildering variety of drugs, both branded and generic.According to the World Health Organization, more than 50% of the purchase of drugs is done through web sites established[23].The application of the RS has become important in various fields of study, particularly in the pharmaceutical industry as it offers great advantages such as no sample preparation, allows the study of liquid and solid substances, the spectra can be obtained without the destruction of the sample[24]. This tool can be helpful in the identification of raw materials and for the quantitative determination of active substances in different formulations[25]. The use of RS greatly strengthens the process analytical technologies, which unlike laboratory studies are faster and require no manual handling of samples. The implementation of the RS in pharmaceutical activities can bring great benefits as the evaluation of product quality, making this a fast, accurate result and decreasing costs[26].Another advantage is that the RS can be combined with sensitive statistical tools such as PCA, which is a technique for deriving a reduced set of orthogonal linear projections of a single collection of correlated variables[27-29].
2. Procedure
- A Raman spectrometer LabRAM HR 800 (Horiba Jobin Yvon) with a laser excitation source of 830 nm was used, an integrated Olympus microscope with a 100X objective and a power of 17 mW. The Raman spectrometer calibration was performed using a silicon sample until adjusting the Raman intensity characteristic to 520 cm-1. Five samples of acetylsalicylic acid from different laboratories were purchased in different pharmaceutical shops. They were analyzed along with a sample of Meyer acetylsalicylic acid technical grade that was used as active substance. For each sample, five spectra were obtained by pointing the laser at different regions of the drug, collecting a total of 35 Raman spectra. The acquisition was carried out in the range from 200 to 2000 cm-1 with a 0.6 cm-1 resolution with an exposure time of 10 sec and an integration time of 5 s.A baseline correction was carried out to the entire spectral data by the least squares method to eliminate background noise, following the Peng method[30], as shown in Figure 1. All Raman spectra were normalized to the greatest intensity peak.
 | Figure 1. Baseline correction and comparing average Raman spectra (Abbreviations: Lab: Laboratory) |
3. Results and Discussions
- Figure 2. shows comparatively each spectral average of each laboratory sample evaluated with respect to the active substance.It is spectrally observed that the drugs that correspond to the laboratories A and C are very similar to the active substance. Moreover, the drug of laboratory E shows very significant differences with respect to the active substance.
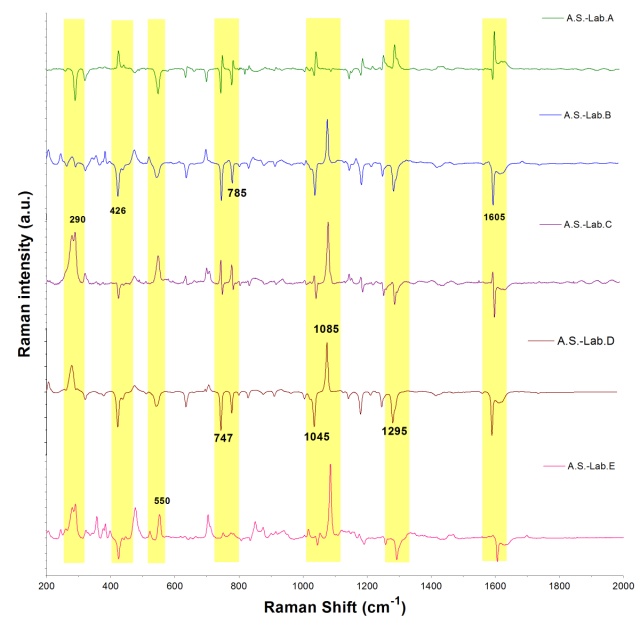 | Figure 2. Spectral comparison of the arithmetic mean of each data block obtained by each laboratory (Abbreviations: A.S.: Active Substance, Lab: Laboratory) |
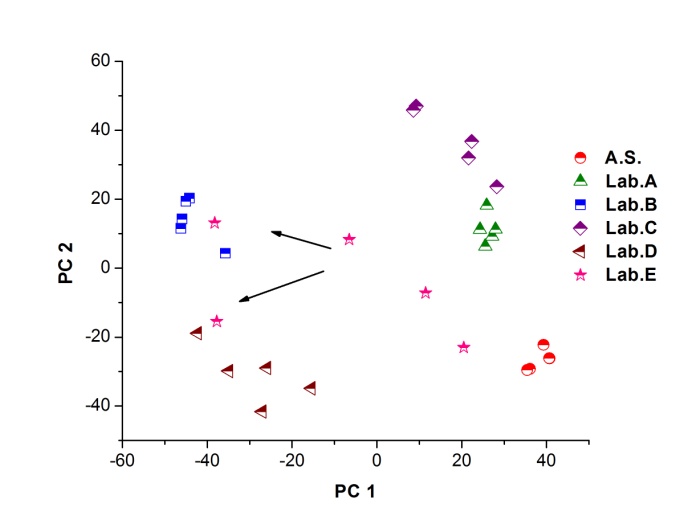 | Figure 3. PCA applied to the 35 processed spectra and plotting PC1 versus PC2 (Abbreviations: A.S.: Active Substance, Lab: Laboratory) |
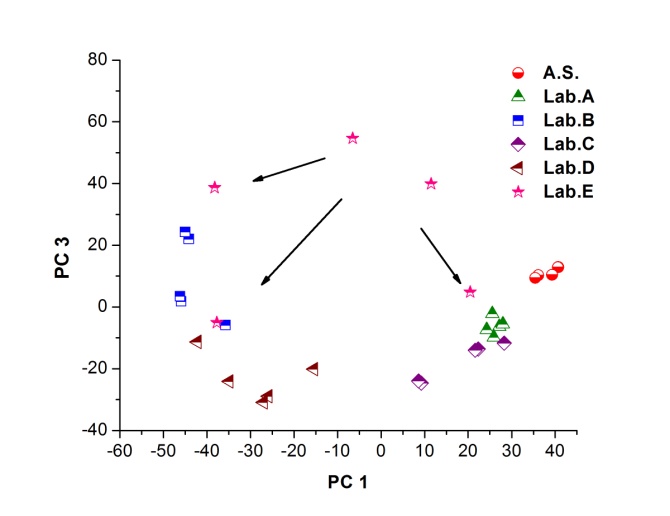 | Figure 4. PCA applied to the 35 processed spectra and plotting PC1 versus PC3 (Abbreviations: A.S.: Active Substance, Lab: Laboratory) |
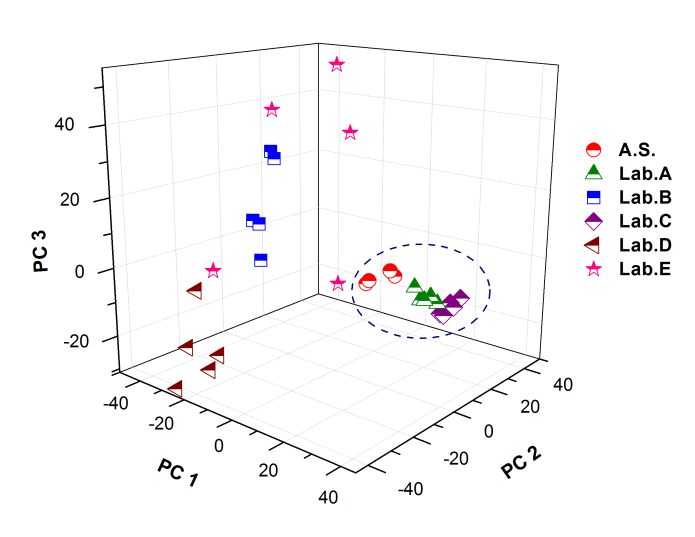 | Figure 5. Spectral distribution by plotting the principal tree first principal components. PC1 versus PC2 versus PC3. (Abbreviations A.S.: Active Substance, Lab: Laboratory) |
| |||||||||||||||||||||||||||||||||||||||||||||||||||||||||||||||||||||||||||||||||||
|
|
4. Conclusions
- We have demonstrate that Raman spectroscopy together with principal component analysis can be used as a fast and nondestructive method to determine the concentration and characteristics of the molecules present in commercially available drugs with very short acquisition times of few seconds. Here we demonstrated too that the power of this technique by discriminating between well manufactured (laboratory A sample) and poorly manufactured (laboratory E) drugs. The validity of this result is backed up by the use of a technical grade reagent employed as a reference. This non destructive analysis could also be used as a quality control tool in the manufacturing processes of commercial drugs in shor time analysis. It could also be possible to use this technique to help in the control and eventual reduction of the trade of counterfeit drugs.
ACKNOWLEDGEMENTS
- We thankful to the CONACYT project 45488: Sectorial Fund of Health Research and Social Security.
References
| [1] | Ruchita S., Agrawal Y., “Raman spectroscopy: Recent advancements, techniques and applications”, Vibrational Spectrosc., vol. 57, no. 2, pp.163-176, 2011. |
| [2] | Richard L. M., Raman spectroscopy for chemical analysis, Chap. 2, John Wiley & Sons Inc., USA, 2000. |
| [3] | Ewen S., Geoffrey D., The Modern Raman spectroscopy: A practical approach, Chap. 3, John Wiley & Sons, Inc., Chichester, West Sussex, 2005. |
| [4] | Wartewig S. and Neubert R.H. “Pharmaceutical applications of mid-IR and Raman spectroscopy”, Adv Drug Deliv Rev., vol.57, no. 8, pp. 1144-1170, 2005. |
| [5] | Shen Y., Paul T., Claire E., Andrew P., Nikin P., “Detection of low levels of amorphous lactose using H/D exchange and FT-Raman spectroscopy”, Pharm. Res., vol. 25, no. 11, pp.2650-2656, 2008. |
| [6] | Huang Z., Chen X., Chen Y., Chen J., Dou M., Feng S., Zeng H., R. Chen, “Raman spectroscopic characterization and differentiation of seminal plasma”, J. Biomed. Opt., vol. 16, no. 11, pp. 110501, 2011. |
| [7] | Hoehse M., Paul A., Gornushkin I., Panne U., “Multivariate classification of pigments and inks using combined Raman spectroscopy and LIBS”, Anal. Bioanal. Chem., vol. 402, no. 4, pp.1443-1450, 2012. |
| [8] | Cluff G., Short M., Lui H., McLean D., Zeng H., Korbelikb M., Chen M., “Comparison of connective tissue invaded by Lewis lung carcinoma to healthy connective tissue by means of micro-Raman spectroscopy”, J. Raman Spectrosc., vol. 40, no. 8, pp.1087–1090, 2009. |
| [9] | Martínez-Espinosa J.C., González-Solís J. L., Frausto-Reyes J. L., Miranda-Beltrán M. L., Soria-Fregoso C., Medina-Valtierra J., “Detection of Leukemia with Blood Samples Using Raman Spectroscopy and Multivariate Analysis”, AIP Laser Florence Proceedings, vol. 1142, pp. 99-103, 2009. |
| [10] | Joanna S., Howell G., Steven A., Alison M., “The detection of drugs of abuse in fingerprints using Raman spectroscopy I: latent fingerprints”, Spectrochimica Acta Part A: Molecular and Biomolecular Spectroscopy, vol. 60, no. 3, pp.563–568, 2004. |
| [11] | El-Abassy R., Donfack P., Materny A., “Visible Raman spectroscopy for the discrimination of olive oils from different vegetable oils and the detection of adulteration”, J. Raman Spectrosc., vol. 40, no. 9, pp. 1284–1289, 2009. |
| [12] | Goodyear S., Aspden R., “Raman microscopy of bone”, Methods Mol. Biol., vol. 816, no. 5, pp.527-534, 2012. |
| [13] | Byrn S.R., Pfeiffer R.R., Stephenson G., Grant D.J.W. and Gleason W.B., “Solid-State Pharmaceutical Chemistry”, Chem Mater, vol. 6, no. 8, pp. 1148–1158, 1994. |
| [14] | Taylor L.S. and Langkilde F.W., “Evaluation of Solid-State Forms Present in Tablets by Raman Spectroscopy”, Journal of Pharmaceutical Sciences, vol. 89, no. 10, pp. 1342–1353, 2000. |
| [15] | Hargreaves M.D., Page K., Munshi T., Tomsett R., Lynch G. and Edwards H.G.M., “Analysis of seized drugs using portable Raman spectroscopy in an airport environment – a proof of principle study”, J. Raman Spectrosc., vol. 39, no. 7, pp. 873–880, 2008. |
| [16] | Kenichiro N., “High-Performance Liquid Chromatographic Analysis of Drugs of Abuse in Biologic Samples”, Journal of Health Science, vol. 51, no. 3, pp. 272-277, 2005. |
| [17] | Emirhan N., Sedef K., “Validate Determination of Meloxicam in Tablets by Using UV Spectrophotometry”, Journal of Faculty of Pharmacy, vol. 24, no. 1, pp. 13-24, 2004. |
| [18] | Holzgrabe U., Deubner R., Schollmayer C., Waibel B., “Quantitative NMR spectroscopy-Applications in drug analysis”, J. of Pharmaceutical and Biomedical Analysis, vol. 38, no. 5, pp. 806-812, 2005. |
| [19] | John D.K..,James K.D., “Near-Infrared Spectroscopy: Applications in the Analysis of Tablets and Solid Pharmaceutical Dosage Forms”, Applied Spectroscopy Reviews., vol. 30, no. 3, pp.139-174, 1995. |
| [20] | Oxana Y.R., Lars P. H., Alexey L. P., Paul G., James B., Vladimir L.D., Alexander P. A., “NIR spectrometry for counterfeit drug detection: A feasibility study”, Analytica Chimica Acta, vol. 549, no. 1-2, pp. 151-158, 2005. |
| [21] | Neelima V. P., Raghu K. C., Raj S., “Identification of drugs in pharmaceutical dosage forms by X-ray powder diffractometry”, Journal of Pharmaceutical and Biomedical Analysis, vol. 15, no. 7, pp. 929-943, 1997. |
| [22] | Nishioka F., Nakanishi I., Fujiwara T., Tomita K., ”The Crystal and Molecular Structure of the β-Cyclodextrin Inclusion Complex with Aspirin and Salicylic Acid”, Journal of Inclusion Phenomena, vol. 2, no. 3-4, pp.701-714, 1984. |
| [23] | World Health Organ, “Growing threat from counterfeit medicines”, Bull World Health Organ, vol. 88, pp. 247-248, 2010. |
| [24] | Giancarlo F., “Applications of Raman spectroscopy to pharmacy”, Journal of Raman Spectroscopy, vol. 35, no. 5, pp. 335–337, 2004. |
| [25] | Vankeirsbilck T., Vercauteren A., Baeyens W., Van der Weken G., Verpoort F., Vergote G., and Remon J.P. “Applications of Raman spectroscopy in pharmaceutical analysis”, Trends in analytical chemistry, vol. 21, no. 12: pp. 869-877, 2002. |
| [26] | Salvas J., Simard J.S. and Abatzoglou N., “Raman Spectroscopy to Analyze Intact Pharmaceutical Tablets: Factors Influencing MVPM-based PAT Methods”, American Pharmaceutical Review, vol. 13, no. 3, pp. 46-53, 2010. |
| [27] | Hotelling H., “Analysis of a complex of statistical variables into principal components”, Journal of Educational Psychology, vol. 24, no. 6, pp. 417-441, 1933. |
| [28] | Svante W., “Principal components analysis”, Chemometrics and Intelligent Laboratory Systems, vol. 2, no. 1-3, pp. 37-52, 1987. |
| [29] | Mia, H., Sanne, E., “Robust PCA and classification in biosciences”, Bioinformatics, vol. 20, no. 11, pp. 1728-1736, 2004. |
| [30] | Peng J., Peng S., Jiang A., Wei J., Li C., Tan J., “Asymmetric least squares for multiple spectra baseline correction”, Analytica Chimica Acta, vol. 683, no. 1, pp. 63–68, 2010. |