International Journal of Optics and Applications

2012;  2(4): 48-55

doi: 10.5923/j.optics.20120204.04

Optical Remote Sensing of Pristine and Coastal Aerosol Features over the Arabian Sea

P. C. S. Devara 1, C. P. Simha 1, S. K. Saha 1, K. N. Babu 2, A. K. Shukla 2

1Indian Institute of Tropical Meteorology, Dr. Homi Bhabha Road, Pashan, Pune 411008, India

2Space Applications Centre, ISRO, Ahmedabad 380015, India

Correspondence to: P. C. S. Devara , Indian Institute of Tropical Meteorology, Dr. Homi Bhabha Road, Pashan, Pune 411008, India.

Email:

Copyright © 2012 Scientific & Academic Publishing. All Rights Reserved.

Abstract

This paper purports the results of a comparative study conducted to investigate aerosol optical, microphysical and radiative characteristics over an Exclusive Economic Zone (EEZ) associated with pristine environment, and coastal regions influenced by human activities, during 2009-2011. The measurements over the EEZ of the Arabian Sea (AS) were carried out from Sagar Kanya (SK-226) ship while over the coastal locations (Mumbai and Goa); employing Sun-photometers. The aerosol optical thickness (AOT) at 500 nm was found to be in the range of 0.3-0.45 in the EEZ while it was 0.45-0.75 in the coastal regions. The AOTs at all the three sites showed a good association with concurrent meteorological parameters. Angstrom parameters (alpha and beta, representative of aerosol size distribution and loading, respectively) indicated opposite behavior in the pristine (EEZ) but similar trend in the polluted coastal regions. This feature reveals that the aerosol loading over the EEZ is contributed by coarse-mode particles while the fine-mode particles contribute to the loading over coastal regions. Abundance of fine-mode particles over the coastal regions is also evidenced from the second order polynomial fit coefficients (a1 and a2) of alpha. This aspect corroborates the long-range transport of air-mass over the experimental sites from the western coast India.

Keywords: Aerosols, Extinction, Exclusive Economic Zone (EEZ), Western Coast, Arabian Sea, Aerosol Radiative Forcing, Ocean Color Monitor

1. Introduction

Aerosols are an integral part of the atmosphere and oceans. Along with greenhouse gases, they can affect climate in several ways. Aerosols can directly or indirectly influence the radiation budget and affect dynamics[1-2]. The direct radiative effect is due to scattering, absorption and emission properties of the aerosol particles. Aerosols are an enigmatic yet indispensable component in global climatic studies and modelling[3]. The physicalcharacteristics, composition, abundance, and spatial distribution and dynamics of aerosols are still very poorly known[4]. The spectral Aerosol Optical Thickness (AOT) or Depth (AOT) is an important physical parameter for characterizing aerosols. Routine observation of total atmospheric column AOT globally is a fundamental way of determining aerosol optical characteristics and their influence on global radiation budget and thereby climate change. The most practical means of making these observations is by remote sensing, which can be either from the ground (looking in the skyward direction with Sun-photometers) or from space (looking towards the ground through the atmosphere with image radiometers onboard satellites or high-altitude aircraft).
Ground-based and satellite remote sensing of AOT are complementary to each other. Ground-based observations enable the acquisition of data as many times as possible in one day, but only for individually discrete locations[5]. On the other hand, satellite observations can cover more extensive areas of the earth (even the whole earth) in one day, though only one or two observations can be made on a given position each day. Ground and satellite observations are vital for different situations as well as for cross-validating each other[6-7]. A Number of currently available satellite sensors (for example, MODIS, MTP, TOMS, OCM-II in Ocean Sat-II) provide data for retrieving aerosol optical properties. On the other hand, there are a number of networks of ground-based Sun-photometers measuring AOT at different locations around the world. One such prominent network is the Aerosol Robotic Network (AERONET) comprising a series of automatic tracking sun-photometers currently occupying more than 350 locations in different parts of the world[8]. However, AERONET Sun-photometers cannot be located everywhere, and every time AOT data are needed, such as during some field campaigns and other special events, as well as routine measurements applied to certain specific studies. Therefore, there is a great need for alternative (especially portable and low-cost) Sun-photometer for such purposes.
Marine aerosols are mainly sea-salt particles originated from wave-breaking and sulfate particles produced by the oxidation of Di-Methyl Sulfide (DMS), released by the phytoplankton[9]. Being hygroscopic, marine aerosols are crucial in cloud formation in the marine boundary layer and are also important in the radiative coupling between the ocean and atmosphere. While continental aerosols can be both scattering and absorbing, marine aerosols are mostly of scattering type[10]; thus becoming a decisive factor in the Albedo of the earth. In spite of the ever-widening recognition of the direct and the indirect radiative effects of aerosols, they are still poorly characterized in climate models[11].
During the months of December–February, north-easterly wind over the Indian subcontinent carries aerosols from the land towards the oceanic atmosphere, affecting also the coastal regions. These months, therefore, become most ideal period to study the effect of continental aerosols and their dispersal in the oceanic atmosphere. Most of the in-situ data campaigns for aerosol characterization have provided significant information on spectral variability, aerosol type, particle size etc; however, in-situ data could not provide information on the spatial distribution and transport process. Routine monitoring of aerosol events and their subsequent dispersal pattern are important in order to understand their role in the climatic processes. The present paper focuses on the temporal, spatial and spectral variations of AOT over the EEZ (Arabian Sea) and coastal locations[Mumbai (formerly known as Bombay) and Goa], based on Sun-photometric measurements made on-board research vessel, Sagar Kanya; and near the coast over land and sea regions.

2. Study Area and Data

2.1. Arabian Sea

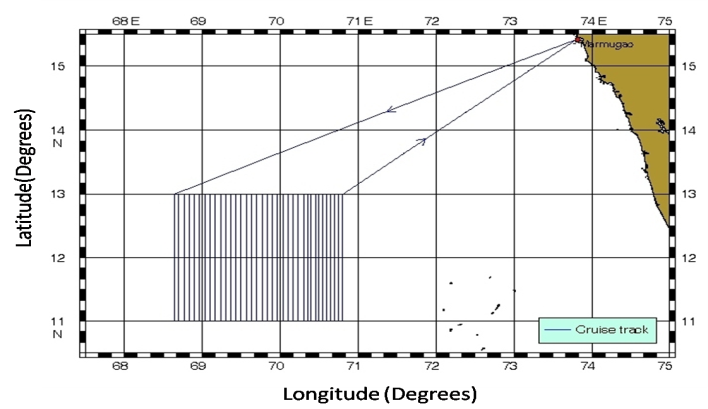
Figure 1. Cruise track of SK-266
The study region of the EEZ, which is about 200 nautical miles from the coast in the Arabian Sea, is depicted in Fig. 1. The living and non-living resources in this zone constitute around two-thirds of the land-mass of India. Added, several million people living along the coastline are directly influenced by the oceanography of the EEZ. The ship commenced from the coast of Goa, moved towards south-westward in the ocean away from the coast and reached the EEZ (13oN, 68oE) and covered line-by-line (around 36 multiple paths during the study period as displayed in the figure); then it returned from EEZ to the Goa port.
Measurements of AOT were made during the campaign using a hand-held Sun-photometer (MICROTOPS-II) at six wavelength bands, each centred around 380, 440, 500, 675, 870,1020 nm. More details of the radiometer used and the data analysis procedures followed have been published by Devara et al.[12]; Morys et al.[13]; Ichoku et al.[14]. Measurements of AOT were made either when the sky was clear or the Sun’s disk was free from any visible low- or high-altitude clouds. During this period, the ship was allowed to move considerably slow at an average speed of less than 4-6 knots. The data were archived from morning 0800 local standard time (LST) till evening 1800 LST on the days of favourable sky conditions. Added, the data points, which gave the best second-order polynomial fit between ln AOT versus ln λ[15-16] only, were considered for analysis in the present study.

2.2. Coastal Station

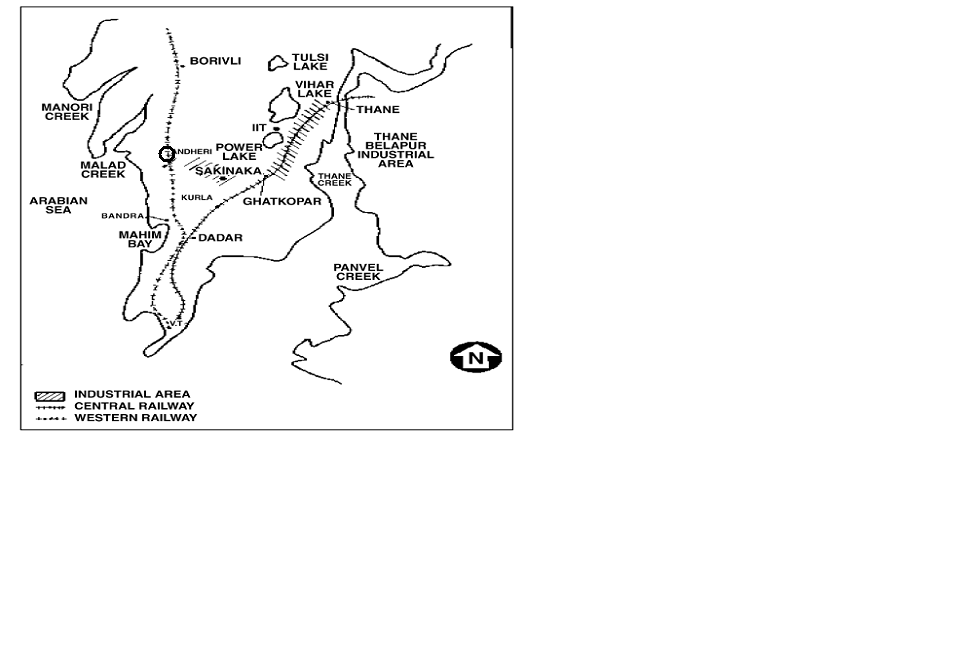
Figure 2. Layout of the coastal site (Mumbai)
The coastal location, Mumbai, is situated about midway on the western coast of India (1923′ N, 7250′ E) and is a peninsular city joining the mainland at its northern end (Fig. 2). Large petro-chemical, fertilizer and power plants are located to the east and south-east of the city. Several thousand medium and small-scale industries are located in the city including chemical, textile and dyeing,pharmaceutical, paint and pigment and metal-working industries. The land-use pattern is industrial-cum-residential with a total population of over 10 million and a population density of 16,500 persons km-2. Sources of particulate matter in the city include vehicular emissions, power plants, industrial oil burning and refuse burning[17]. AOT data were collected from the roof of a five-stored building, near Versosva, West Andheri, Mumbai. This represents a background site, about 3 km inland from the coast and is likely to receive both marine and continental aerosols. The site is not affected by proximate transportation or industrial sources, with the nearest heavy traffic roadway about 1 km to the east and industrial cluster about 3 km to the south-east.
Martin[18] pointed out that the plumes over Mumbai during the winter monsoon transport black carbon-rich air from Western/North-western India over the Arabian Sea (AS), described as the “Bombay Plume”[19]. Mumbai is also a source of anthropogenic aerosols such as CO and VOCs as well as NOx and O3[20]. The plume was found to contain high concentration of anthropogenic aerosols, with a persistent source region located in the Western Indian province of Maharashtra near the city of Mumbai. Kedia and Ramachandran[21] state that columnar AOT increases with raise in the marine boundary layer aerosol concentration over coastal India and Arabian Sea, while an opposite trend was reported over the tropical Indian Ocean. In the present study, apart from AOT observations over the coastal location at Mumbai, cruise observations over the Goa coast have also been carried out along with those over the EEZ.

3. Material and Methods

The AOT measurements were made using a multi-spectral MICROTOPS-II Sun-photometers (M/s Solar Light Co., USA). They measure AOT at six wavelengths centred at 380, 440, 500, 675, 870, 1020 nm, from the instantaneous solar flux measurements using its internal calibration. These instruments work on the principle of measuring the solar radiation intensity at each wavelength and convert to AOT by knowing the corresponding intensity at the top-of-the-atmosphere (TOA). The TOA irradiance at each wavelength was calculated via the well known Langley method. For this, the expression given by Kasten and Young[22] for the air mass computation was used. The absolute irradiance in Wm–2 is obtained by multiplying the irradiance signals at different wavelengths in mV with the calibration factor (Wm–2mV-1). The accuracy of the sun-targeting angle is better than 0.1o. In order to avoid errors in sun-targeting angle, the photometer was mounted on a tripod stand through-out the experimental period. Moreover, before their deployment for cruise observations, the Sun-photometers were factory calibrated at Mouna Loa, Hawai, a unique high-altitude location allowing access to a pure and stable atmosphere. Thus the on-board measurements were carried out following the standard AOT measurement protocol for ship-borne surveys. During the cruise, the photometers were operated from 08:00 hrs to 16:00 hrs, with 5-min interval during sun-rise and sun-set periods; and 10-min interval during rest of the day. These measurements were made from the ship-deck when the sky was cloud-free or when clouds were far away from the solar disk. Simultaneous surface-level meteorologicalobservations like wind speed, relative humidity etc. was recorded by an automatic weather station (AWS) and the atmospheric pressure was measured with an on-board aneroid barometer.

4. Results and Discussion

4.1. Spectral and Lat/Long variations of AOT over the Arabian Sea

The spectral dependency of AOT is studied during the morning, afternoon and evening periods over the EEZ and coastal site (Goa) of the Arabian Sea in Fig. 3. The morning
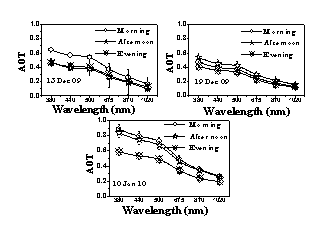
Figure 3. AOT variations during morning, afternoon and evening hours in different environment zones
AOTs show higher values than that during evening and afternoon hours on 13 December 2009 and 10 January 2010, while on 19 December 2009, afternoon AOTs are higher than those of morning and evening. The lat/long variation of AOT on these three observational days is also examined (figure not shown). The results clearly distinguish the coastal and pristine oceanic features. Correlation between meteorological parameters and AOT is examined in Fig. 4 in order to explain the AOT trends in different environments.
Figure 4. Variation of meteorological parameters over different environments
Good correlation between relative humidity and AOT (R=0.6), and between winds and AOT (R=0.95) reveals formation/growth of hygroscopic (hydrophilic nature) particles on 13 December 2009. However, no consistent correlation was observed between AOT and temperature. But on 19 December 2009 and 10 January 2010, negative correlation was observed between relative humidity and AOT, which implies the presence of non-hygroscopic (hydrophobic nature) particles, and a positive correlation between AOT and temperature indicates enhancement in organic aerosols due to increase in temperature[23]. The AOT at 500 nm is found to be in the range of 0.38-0.55, 0.32-0.42 over the EEZ, and 0.48-0.73 in the coastal region of Goa. With regard to the wavelength dependency of AOT in the EEZ and coastal environments, a slight enhancement in AOT at 500 nm is attributed to the gas-to-particle conversion (secondary aerosol formation) in the winter season[12]. The AOT was low during 13-19 December 2009 due to the pristine oceanic environment in the EEZ, while it was higher on 10 January 2010 due to coastal anthropogenic effects. Similar AOT variations have been reported in the literature by Kalapureddy and Devara[24]; Jayaraman et al.[25].

4.2. Winter Versus Pre-monsoon Variation of AOT and Meteorological Parameters Over Coastal Station

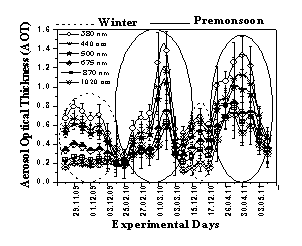
Figure 5. Spectral variation of AOT during pre-monsoon and winter seasons over the coastal site. The solid curves circled indicate predominance of AOT during pre-monsoon season while the dashed curves circled denote AOTs during winter months during 2009-2011
Figure 6. Co-variations between AOT at 500nm and meteorological parameters
The spectral variation of AOT at six wavelengths during winter and pre-monsoon months over the coastal site is shown plotted in Fig. 5. The wavelength dependency of AOT is quite evident. The AOT at 500 nm is found to be in the range of 0.4-0.6, 0.4-1.1 in the winter and pre-monsoon seasons, respectively. The lower AOTs observed during the winter season are ascribed to low humidity and wet removal of aerosols during the monsoon, and addition of coarse-mode particles through south-westerly winds through oceanic surfaces. Added, anthropogenic activities can cause enhancement in AOT during the pre-monsoon period. The variations in meteorological parameters and their association with AOT during winter and pre-monsoon seasons are shown plotted in Fig. 6. It is clear from the figure that AOT variations follow similar trend to that of temperature and relative humidity; and opposite trend with winds in winter season, and vice-versa in pre-monsoon season during the study period.

4.3. Angstrom Coefficients and Air Back Trajectories Over the Arabian Sea

According to Angstrom[26-27], spectral variation of AOT can be expressed as
(1)
where τ is the AOT, β (often referred to as the Angstrom turbidity parameter) represents the AOT at the reference wavelength (λ = 1 micron), which may be viewed as an indicator of total aerosols present in the atmosphere, and α is the Angstrom coefficient, which depends on aerosol size distribution. Each spectral measurement of AOT was fitted to equation (1), using linear least-squares fit of log-transformed data to obtain α as the slope of the regression line and log β as the intercept. Low and high values of α indicate coarse-mode (primarily maritime) and fine-mode (basically continental) size aerosol particles, respectively. The α values are found to be in the range of 1.24-1.47 on 13 December 2009, 1.24-1.28 on 19 December 2009 and 1.20-1.28 on 10 January 2010, β follows α oppositely in the EEZ and similar way in the coastal Arabian Sea (Fig. 7). The occasional fine- mode particle dominance is noticed to be due to the proximity of some islands which is corroborated by air-mass back trajectories.
Figure 7. Alpha-Beta variations in different environmental zones (on different locations of the ship)
Sometimes, wavelength dependence of AOT does not follow equation (1) (Angstrom power-law) exactly[15, 28], so departure from the linear behavior of ln (τ) versus ln (λ) data is expected. In such situations, the second-order polynomial fit is used to examine the curvature in the AOT spectra, which can be written as
(2)
The curvature in the ln τ versus ln (λ) data is found to be concave (a2 <0) when fine-mode particles dominate the aerosol size distribution (such as biomass burning, urban or industrial aerosols); the curvature is convex (a2>0) for the atmosphere with dominant coarse-mode aerosols (such as dust, sea-salt) or bimodal distribution with significant relative magnitude of coarse-mode particles[15-16, 21, 29, 31].
The coherence between AOT at 500 nm and a2 provides information on atmospheric conditions where alpha is independent of wavelength, so spectral variation of AOT can be accurately explained. The data lying on or near a2 = 0 belong to the Junge power-law distribution. As expected via the affirmation of Schuster et al.[32] and Kaskaoutis et al.[16], the a1 values are negative, since they are similar to - α in case of negligible curvature. Figure 8 shows the majority of a2 < 0, a1 < 0 for the both EEZ and coastal region (Goa), which reveals the influence of fine-mode particles on some selected days of the cruise which is consistent with the results reported earlier in the literature[15, 16, 29].
Figure 8. Second order Polynomial coefficients a2 and a1 with AOT 500nm

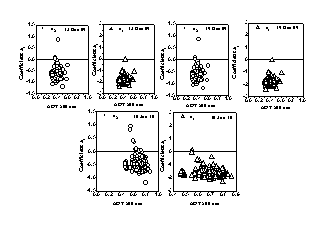
4.4. Intra-seasonal Variation in Angstrom Exponent Over the Coastal Site

The relationship between α and β variations and their covariance with that of AOT[26, 33] during winter and pre-monsoon seasons over the coastal site (Mumbai) is examined in Fig. 9. The alpha values range from 0.2 to 0.7 in winter while they vary between 0.3 and 1.2 in pre-monsoon season. It is clear from this figure that alpha follows similar trend as that of AOT throughout the study period except in the winter season of 2010 due to lack of particle growth. The accumulation-mode aerosol is smaller during winter 2009 and higher during winter 2010. Generation of coarse-mode particles is observed to be predominant during pre-monsoon and winter seasons of 2009 and 2011. This may be due to the lower turbidity coefficient (beta) and associated meteorological parameters, leading to agglomeration of aerosols during those seasons over coastal station.
Figure 9. Angstrom exponent variations over coastal site (Mumbai) during the campaign period. Pre-monsoon variations are enclosed by solid circles and winter variations by dashed circles
The seven-day back trajectories (at three characteristic altitudes) on typical experimental days during winter and pre-monsoon seasons, obtained from the NOAA HYSPLIT model[34], are shown plotted in Fig. 10. The influence of south-west and north-east winds during pre-monsoon and winter seasons at the observing site is clearly evidenced from the air-mass back trajectories. Similar changes, which are considered to be due to the observed day-to-day variability of aerosol properties, have also been reported in the literature[12, 25, 29].
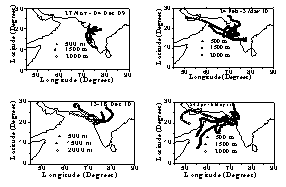
Figure 10. Air mass back trajectories from NOAA Hysplit model during the campaign period at different altitudes (500 m, 1500 m, 2000 m)

4.5. Diurnal Variation of SW Radiation over the EEZ And Coastal Sites

The data over the Mumbai coast were acquired by fixing the Pyranometer on the roof of a five-stored building to avoid topographic obstructions while these measurements were made by mounting the pyranometer to specially-built gimbals fixed to the ship deck. Details of this instrument can be found in Devara et al.[35]; Kalapureddy et al.[29]; Kalapureddy and Devara[30]. The down-welling radiation flux variations recorded on two typical experimental days, one in winter 2009 over EEZ and the other in pre-monsoon 2010 over Mumbai coast, are shown plotted in Fig. 11. It can be noted that sky was relatively clean during the period of observations over the EEZ as compared to the coastal location, where the sky was covered by cloud patches (indicated by reduction in the flux as evidenced by inverted spikes). The surface radiative forcing due to aerosols is computed by coupling these observations (during clear sky conditions) with the concurrent Sun-photometer AOT measurements, and the details are presented and discussed in the sub-section to follow.
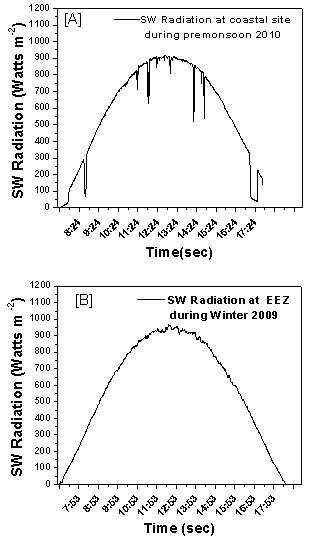
Figure 11. Seasonal variation of SW radiation over the coastal site[A] and EEZ[B] of the Arabian Sea. Contamination by clouds can be seen over the coastal site

4.6. Surface Radiative Forcing

The pyranometer-measured global SW flux values in the wavelength region from 0.3 to 3.0 μm are correlated with instantaneous AOT at 500 nm values (corrected for the air mass factor, 1/μ) in order to compute the radiative forcing[25]. Normalization of AOT with μ (= cos θ) is necessary as the slant air column length increases with increasing solar zenith angle θ. The data for solar zenith angle greater than 60o are excluded (to avoid Earth's curvature effect) and the AOT/μ values are restricted to within 0.85. Figure 12 shows scatter plots of the measured normalized SW flux with AOT for the EEZ and coastal region. A straight line could be fitted with a negative slope of about 20.08 and 31.02 Wm−2 per unit optical thickness for the EEZ and coastal region. This implies that for 0.1 increase in the prescribed columnar AOT, the sea-surface solar flux decreases by about 20.08 and 31.02 Wm−2 for EEZ and coastal regions. This is consistent with the surface solar flux values reported by earlier researchers (for example, Kalapureddy and Devara[24]; Jayaraman et al.[25]; Moorthy et al.[36]).
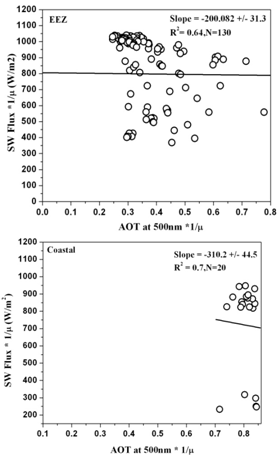
Figure 12. Association between the short wave solar flux and columnar AOT at 500nm normalized with the air mass (1/µ) over coastal Arabian Sea and EEZ

5. Conclusions

As part of the Calibration-Validation (Cal-Val) campaign of OCEANSAT-II OCM (Ocean Color Monitor), aerosol characterization experiments have been conducted over the coastal and pristine environments of the Arabian Sea. The salient results obtained are summarized below.
• Relatively higher values of Angstrom exponent, 1.2 near the coast, and 0.2-0.8 in the EEZ were observed during the cruise period. These values indicate the presence of smaller particles near the coast due to anthropogenic activities, and relatively larger particles in the EEZ due to advection from Indian subcontinent. This feature was clearly seen supported by long-range transport of air mass to the experimental site.
• Combined information of Angstrom exponent (α) and its second order derivative have been found to be useful indicators to delineate aerosol type and loading.
• Surface radiative cooling due to aerosols is found to be larger over the coastal Arabian Sea than that over the EEZ.
• In the EEZ, the AOT was found to vary around 0.2 (representing pristine oceanic condition), whereas near the coastal region, AOT was more than 0.5 indicating significant anthropogenic activity. Both the hygroscopic growth of particles and generation of organic aerosols have been noticed during the cruise.
• Combined a1 and a2 values showed fine-mode dominance over the coastal locations and coarse-mode abundance over the EEZ, which is considered to be due to anthropogenic activities and long-range transport of air mass from the Indian continent.
• The aerosol forcing (cooling) exerted by the sea surface solar flux (ΔF) over the coastal (-20 Wm-2) is found to be less as compared to that over the EEZ (-31 Wm-2) in the Arabian Sea during the SK-266 campaign.
• Intra-seasonal variation of AOT over the coastal station (Mumbai) is found to be in the range of 0.4-0.6, 0.4-1.1 during winter and pre-monsoon seasons, respectively. A significant influence of long-range transport of aerosol pollutants and local meteorological parameters on AOT is noticed during winter and pre-monsoon seasons.

ACKNOWLEDGEMENTS

The authors are grateful to the anonymous Reviewers for their insightful comments on the original manuscript. This work was carried out under the ISRO-SAC, OCEANSAT-II project. The authors are thankful to the Crew Members and Scientific Team of the ORV-Sagar Kanya (SK-266). One of the authors (CPS) is very thankful to SAC, ISRO for financial support. Authors are thankful to the Director, IITM for all the support for the study. Thanks are also due to Latha Shenoy of the Central Institute for Fisheries and Education (CIFE), west Andheri, and DRDO, Mumbai, for providing infrastructure support for coastal observations. The authors gratefully acknowledge the NOAA Air Resources Laboratory (ARL) for providing the HYSPLIT transport and dispersion model and/or READY website (http://www.arl.noaa.gov/ready.html). We are thankful to the web-based interface for the visualization and analysis of the MODIS data (http://g0dup05u.ecs.nasa.gov/Giovanni/).

References

[1]  J.A. Coakley, R.D. Cess, F.B. Yurevich, “The effect of tropospheric aerosols on the earth’s radiation budget: A parameterization for climate models”, J. Atmos. Sci., 40, 116–138, 1983.
[2]  Y.J. Kaufman, D. Tanre, H.R. Gordon, T. Nakajima, J. Lenoble, R. …Frouin, H. Grassl, B.M. Herman, M.D. King, P.M. Teillet, “Passive remote sensing of tropospheric aerosol and atmospheric correction for the aerosol effect”, J. Geophys. Res., 102, 16,815–16,830, 1997.
[3]  Intergovernmental Panel on Climate Change, “Report to IPCC from Scientific Assessment Group (WGI)”, Cambridge University Press, New York, 1995.
[4]  J.E. Penner, R.J. Charlson, J.M. Hales, N.S. Laulainen, R. Leifer, T. Novakov, J. Ogren, L.F. Radke, S.E. Schwartz, L. Travis, “Quantifying and minimizing uncertainty of climate forcing by anthropogenic aerosols”, Bull. Am. Meteorol. Soc., 75, 375–400, 1994.
[5]  Bhawar, R.L., “Aerosol Characterization using Satellite and Ground-based Measurements”, Ph.D. Thesis, University of Pune, Pune, India, 178 pp., 2007.
[6]  P. Chauhan, N. Sanwlani, R.R. Navalgund, “Aerosol optical depth variability in the northeastern Arabian Sea during winter monsoon: a study using in-situ and satellite measurements”, Indian J. Marine Sci., 38, 390–396, 2009.
[7]  K. Sumit, P.C.S. Devara, “Aerosol characterization: comparison between measured and modelled surface radiative forcing over Bay of Bengal”, Remote Sens. Lett., 3, 373-381, 2012.
[8]  B.N. Holben, D. Tanré, D., A. Smirnov, T.F. Eck, I. Slutsker, N. Abuhassan, W. Newcomb, J.S. Schafer, B. Chatenet, F. Lavenu, Y.J. Kaufman, Y. Vande Castle, A. Setzer, B. Markham, D. Clark, R. Frouin, R. Halthore, A. Karneli, N.T. O'Neill, C. Pietras, R.T. Pinker, K. Voss, G. Zibordi, “An emerging ground-based aerosol climatology: Aerosol optical depth from AERONET”, J. Geophys. Res., 106, 12067-12097, 2001.
[9]  R.J. Charlson, J.E. Lovelock, M.O. Andreae, S.G. Warren, “Oceanic phytoplankton atmospheric sulphur, cloud albedo and climate”, Nature, 326, 655–661, 1983.
[10]  G. d’Almeida, P. Koepke, E. Shettle, “Atmospheric Aerosols : Global Climatology and Radiative Characteristics”, A. Deepak, Hampton, Va, 561pp., 1991.
[11]  B. Albrecht, “Aerosols, cloud microphysics, and fractional cloudiness”, Science, 245, 1227-1230, 1989.
[12]  P.C.S. Devara, S.M. Sonbawne, K.K. Dani, S.K. Saha, P.E. Raj, “Characterization of aerosols and pre-cursor gases over Maitri during 24th Indian Antarctica Expedition”, Int. J. Remote Sensing, iFirst, 1–12, 2011.
[13]  M. Morys, F.M. Mims III, S. Hagerup, S.E. Anderson, A. Baker, J. Kia, J., T. Walkup, “Design, calibration and performance of Microtops handheld ozone monitor and Sunphotometer”, J. Geophys. Res., 106, 14573-14582, 2001.
[14]  C. Ichoku, R. Levy, Y.J. Kaufman, L.A. Remer, R.R. Li, V.J. Martins, B.N. Holben, N. Abhuhassen, I. Slutsker, T.F. Eck, C. Pietras, “Analysis of the performance characteristics of the five-channel MICROTOPS-II Sunphotometer for measuring aerosol optical thickness and precipitable water vapour”, J. Geophys. Res., 107, (D13), 4179, 10.1029/2001JD001302, 2002.
[15]  T.F. Eck, B.N. Holben, J.S. Reid, O. Dubovik, A. Smirnov, N.T. O’Neill, I. Slutsker, S. Kinne, “Wavelength dependence of the optical depth of biomass burning, urban, and desert dust aerosols”, J. Geophys. Res., 104, 31,333–31,349, 1999.
[16]  D.G. Kaskaoutis, H.D. Kambezdis, N. Hatziannastassiou, P.G. Kosmopoulos, K.V.S. Badrinath, “Aerosol climatology: Dependence of the Angstrom exponent on wavelength over four AERONET sites”, Atmos. Chem. Phys. Discuss., 7, 7347–7397, 2007.
[17]  S. Larssen, F. Gram, L.O. Hagen, H. Jansen, X. Oslthoorn, R.V. Aundhe, U. Joglrkar, In: J. Shah, T. Nagpal, (Eds.), “URBAIR—Urban Air Quality Management Strategy in Asia: Greater Mumbai Report”, The International Bank of Reconstruction and Development, The World Bank, Washington DC, pp. 231, 1997.
[18]  A. Martin, “Bombay plume transport, structure and microphysical interactions over the Arabian Sea during Indian winter monsoon”, Florida State University, NASA GSFC/UMBC-JCET GSSP, 2007.
[19]  J. Lelieveld, P.J. Crutzen, V. Ramanathan, M.O. Andrae, C.A.E. Brenninkmeijer, T. Camos, R. Cass, R.R. Dickerson, H. Fisher, J.A. de Gouw, A. Hansel, A. Jefferson, D. Kley, A.T.J. de, S. de Laat, lal, M. Lawrence, J.M. Lobert, L.O. Mayol-bracero, A.P. Mitra, T. Novakov, S.J. Oltmans, K.A. Prather, T. Reiner, H. Rodhe, H.A. Schreen, D.R. Sikka, J. Williams, “The Indian Ocean Experiment: Widespread Air Pollution from South and Southeast Asia”, Science, 291, 1031 – 1036, 2001.
[20]  M.J. Phadnis, M. Hiram II, J. Walter, “On the evolution of pollution from South and Southeast Asia during the Winter-Spring monsoon”, J. Geophys. Res., 107, (D24), 4790, doi: 10.1029/20092002JD002190, 2002.
[21]  S. Kedia, S. Ramachandran, “Variability in aerosol optical and physical characteristics over the Bay of Bengal and the Arabian Sea deduced from Angstrom exponents”, J. Geophys. Res., 114, D14207, doi: 10.1029/2009JD011950, 2009.
[22]  F. Kasten, A.T. Young, “Revised optical air mass tables and approximation formula”, Applied Optics, 28, 4735-4738, 1989.
[23]  M.C. Daya, S.N. Pandis, “Predicted changes in summertime organic aerosol concentrations due to increased temperatures”, Atmos. Environ., 45, 6546-6556, 2011.
[24]  M.C.R. Kalapureddy, P.C.S. Devara, “Characterization of aerosols over oceanic regions around India during pre-monsoon 2006”, Atmos. Environ., 42, 6816–6827, 2008.
[25]  A. Jayaraman, D. Lubin, S. Ramachandran, V. Ramanathan, E. Woodbridge, W.D. Collins, K.S. Zalpuri, “Direct observations of aerosol radiative forcing over tropical Indian Ocean during the January–February 1996 pre-INDOEX cruise”, J. Geophys. Res., 103 (D12), 13827–13836, 1998.
[26]  A. Angstrom, “Techniques of determining the turbidity of the atmosphere”, Tellus, 13, 214-223, 1961.
[27]  A. Angstrom, “The parameters of atmospheric turbidity”, Tellus, 16, 64–75, 1964.
[28]  N.T. O’Neill, T.F. Eck, B.N. Holben, A. Smirnov, O. Dubovik, “Bimodal size distribution influences on the variation of Angstrom derivatives in spectral and optical depth space”. J. Geophys. Res., 106, 9787–9806, 2001.
[29]  M.C.R. Kalapureddy, D.G. Kaskaoutis, P.E. Raj, P.C.S. Devara, H.D. Kambezidis, P.G. Kosmopoulos, P.T. Nastos, “Identification of aerosol type over the Arabian Sea in the pre monsoon season during the Integrated Campaign for Aerosols, Gases and Radiation Budget (ICARB)”, J. Geophys. Res., 114, D17203, doi: 10.1029JD011826, 2009.
[30]  M.C.R. Kalapureddy P.C.S. Devara “Pre-monsoon aerosol optical properties and spatial distribution over the Arabian Sea during 2006”, J. Atmos. Res., 95: 186-196, 2010.
[31]  T.F. Eck, B.N. Holben, O. Dubovik, A. Smirnov, I. Slutsker, J.M. Lobert, V. Ramanathan, “Column-integrated aerosol optical properties over the Maldives during the northeast monsoon for 1998–2000”, J. Geophys. Res., 106, 28,555– 28,566, 2001.
[32]  G.L. Schuster, O. Dubovik, B.N. Holben, “Angstrom exponent and bimodal aerosol size distributions”, J. Geophys. Res., 111, D07207, doi: 10.1029/2005JD006328, 2006.
[33]  V.A. Cachorro, P. Duran, R. Vergaz, A.M. de Frutos, “Measurements of the atmospheric turbidity of the north centre continental area in Spain: spectral aerosol optical depth and Angstrom turbidity parameters”, J. Aerosol Sci. Tech., 31, 687-702, 2000.
[34]  R.R. Draxler, G.D. Hess, “An over view of the HYSPLIT4 modeling system for trajectories, dispersion, and deposition”, Austr. Meteorol. Mag., 47, 295–308, 1998.
[35]  P.C.S. Devara, R.S. Maheskumar, P.E. Raj, K.K. Dani, S.M. Sonbawne, “Some features of columnar aerosol optical depth, ozone and precipitable water content observed over land during the INDOEX-IFP99”, Meteorologische Zeitschrift, 10, 123-130, 2001.
[36]  K.K. Moorthy, S. Suresh Babu, S.K. Satheesh, “Aerosol characteristics and radiative impacts over the Arabian sea during the inter monsoon season: Results from ARMEX field campaign”, J. Atmos. Sci., 62, 192–206, 2005.