M. S. Khalil1, F. M. E-Sharkawy1, M. G. EL- Shaarawy2, N. Shash2, A. Mahmoud1
1Photometry Department; National Institute of Standards, Giza, Egypt
2Physics Department; Faculty of sciences, Benha- University
Correspondence to: F. M. E-Sharkawy, Photometry Department; National Institute of Standards, Giza, Egypt.
| Email: |  |
Copyright © 2012 Scientific & Academic Publishing. All Rights Reserved.
Abstract
The work described in this paper is a part of the process of lamp and photometer calibration to obtain a new luminous-intensity scale with a lower uncertainty. The procedure and the results of realizing the photometric scale with a standardized detector at the National Institute for Standards (NIS) are described. This method enables photometric values to be derived from absolute spectroradiometric measurements by exact computation. A filtered trap detector has been characterized and used to measure the absolute spectral power distribution of standard lamps. From these data a photometric scale of luminous intensity has been realized. The results were compared to the certified calibration values obtained by National Physical Laboratory (NPL), and showed agreement within uncertainty of ± 1.8%
Keywords:
Photometry, Spectral Irradiance, Trap Detector, Luminous Intensity, Filtered Radiometer
Cite this paper: M. S. Khalil, F. M. E-Sharkawy, M. G. EL- Shaarawy, N. Shash, A. Mahmoud, Measurement of Luminous Intensity Using Filtered Trap Detector, International Journal of Optics and Applications, Vol. 2 No. 4, 2012, pp. 43-47. doi: 10.5923/j.optics.20120204.03.
1. Introduction
The photometric base unit of the International System of Units (SI) is the candela (cd), the unit of luminous intensity. Since 1979, the candela has been defined as: the luminous intensity, in a given direction, of a source that emits monochromatic radiation of frequency 540x 1012 hertz and that has a radiant intensity in that direction of (1/683) watt per steradian[1-4]. The definition of the candela links together photometric and radiometric quantities. The basis of accurate photometric evaluations of light sources is provided by accurate spectral measurements under specified geometric conditions.The National Institute of Standards in Egypt (NIS) used to maintain the luminous intensity by a group of specially designed lamps periodically calibrated at NPL (National Physical Laboratory- England), with uncertainty of + 0.8% However the scale can be realized by using detector-based methods. Owing to recent improvements in radiometric measurements, units for most photometric quantities can now be realized with the highest accuracy by radiometric methods. As trap detectors have been extensively described by other authors (5-8). Their working principle is summarized only briefly here. Irradiance standard lamps can be accurately calibrated in absolute values using the trap detector and set of interference filters. As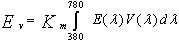 | (1) |
 | (2) |
Where Ev is the illuminance, I is the luminous intensity in candelas, and d is the distance between the light source and the irradiated surface.The photometric unit can be derived from the spectral irradiance distribution by means of a visual response function  defined and tabulated by the CIE and the constant factor Km specified in the new definition.
2. Basis of the Measurement
The spectral irrradiance of a tungsten lamp  at a distance d as a function of
  , is defined as :
 | (3) |
Where  radiant flux incident on an aperture area A.Depending on the optical radiation incident on the effective aperture area, filter radiometer generates photocurrent as
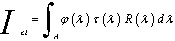 | (4) |
Where  is the spectral transmittance of the filters,
  is the known spectral responsivity of the trap detector, and
  is the radiation wavelength in air. Since the spectrum of light source used in measurements is close to Planck radiator, the spectral power distribution of the light source in eq. (3) for over the visible range is estimated as given in the following analytical form:
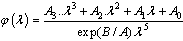 | (5) |
Where A0, A1, A2, A3 & B are free parameters. The spectral irradiance was modeled with 3rd degree of polynomial to compensate for deviations of the lamp used in measurement from that of ideal blackbody radiator.(9-10)From eq. (4) & eq. (3) we can obtain the following equation for the various filters as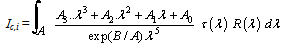 | (6) |
where i indicates the filters which are used in the measurements. Equation (4) must usually be solved by an iterative method. We have to minimize the relative errors between the measured and calculated values of the photo currents Im,i & Ic,i to minimum using the least square fitting: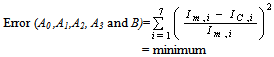 | (7) |
(for the seven filters).The detailed explanation for the solutions of these type equations can be found in ref.[11]. The luminous intensity of the lamp can be calculated from spectral irradiance and the luminous efficacy function, V( ) from equation (1)
3. Experimental Technique
3.1. Filter Radiometer
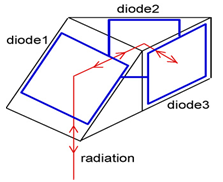 | Figure 1. Schematic representation of the trap detector |
The filter radiometer is basically consists of the trap detector, interference filters and precision aperture. The trap detector consists of three windowless Hamamatsu 13371 type silicon photodiodes; each has 1 cm2 active area. In trap detector design, the photodiodes are geometrically arranged in such a way that polarization sensivity is removed. In this design, incident beam undergoes five reflections before leaving the detector as shown in Fig. 1. Therefore, reflectance of a trap detector is nearly zero. A precision circular aperture of area 0.1 cm was attached to the front of the trap detector.Application of a bias voltage increases the linearity limit by a factor more than 5
3.2. Filter Transmittance
Seven interference filters from Avian, having nominal central wavelengths at 400 nm, 450 nm, 500 nm, 550 nm, 600, and 650 nm and 700 nm, were used for the measurements. All filters have a path band of 10 nm. The spectral transmittances of the filters were measured with a Shimadzu double monochromator with 0.1 nm interval and band slit width 0.3 nm (Fig.2). Before starting transmittance measurements the wavelength calibration of monochromator was performed. The filters were checked out of the path band. It blocks radiation away from the band path region to better than 0.01%-
4. Measurement Set-Up
Two set of lamps, 1000 watt standard FEL type and Osram 200 watt Wi/G lamps were used as light sources having high optical radiation during measurements. Lamps were operated with DC power at fixed polarity and at a stabilized lamp current. The lamp current was measured as the voltage across a calibrated reference resistor of 0.1 Ohm using DVM Fluke 8085. The photocurrent of the photometer was measured using a calibrated digital LMT nano-photocurrent meter I1000. Baffles were employed to minimize the stray-light.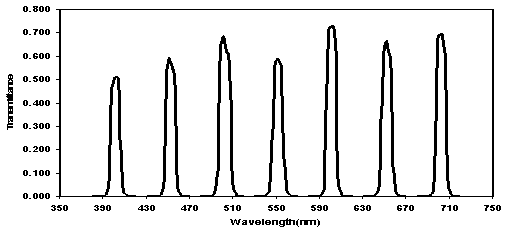 | Figure 2. Spectral transmittance of the filters |
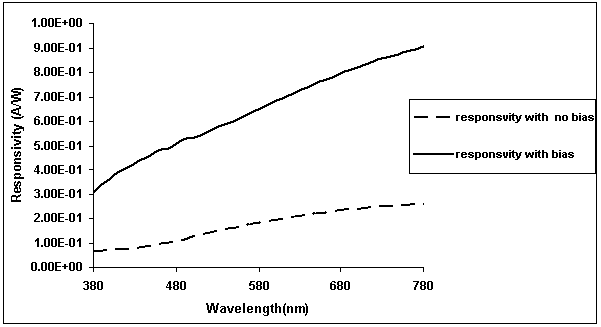 | Figure 3. Responsivity of trap detector |
The trap detector and the baffles were placed on 4.5 meter optical bench equipped with an accurate length scale. The lamps were mounted on stages with five degrees of freedom that allow accurate positioning of the lamp filament. The optical axis of the bench was determined with an alignment laser positioned between the detector and the lamp. The detector to lamp distance was measured from the lamp filament plane to the plane of the aperture. Filter radiometer was used to measure the irradiance values on the aperture plane of the trap detector. e transmittance range of the filters.
5. Characterization of the Trap Detector
5.1. Spectral Responsivity of the Detector
The spectral responsivities of the polarization independent reflection trap detector, was determined in the range 350 -800 nm (Fig. 3). Using a high-accuracy spectrophotometer, the trap detector was compared with a standard silicon detector, 71582 & serial number: 492, one of the set upon which the scale of detector spectral responsivity was established at NIS (Egypt) and traceable to the cryogenic radiometer.
5.2. Linearity
Linearity of the detector was tested using a double beam aperture method [12,13]. In this technique the output signal Sa, Sb are measured for two equal beams A and B. The sum of these signals, Sa+Sb was compared with the signal when both the beams are present in combination, Sab. The linearity factor is defined as Sab/ Sa+Sb. A wide range of incident power which corresponds to an output current range A to 10-4 Ampere.
5.3. Spatial Uniformity
The response uniformity of the active area of light- trapping detector was investigated. Nonuniformity would produce measurement errors when the detector used in different position. The uncertainty due to response nonuniformity depends on the position and size of the beam [14-15]. The measurements were done by using a Helium-Neon laser. The detector was moved in x and y axis and the output radiation were scanned across the surface.
6. Results and Uncertainties
6.1. Luminous Intensity Measurements
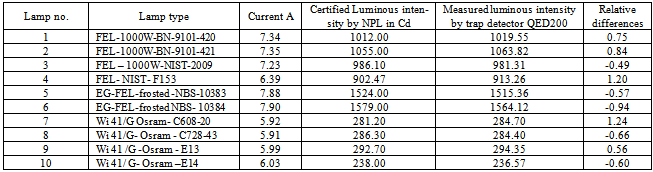
Group of 10 lamps were used, Six FEL 1000 watt and for Wi G Osram 200 watt lamps. The irradiance of the lamp has been measured at discrete wavelengths corresponding to the filters 400,450, 500, 550, 600 and 700 nm. A fitting curve was carried out according to equation 7. The parameters obtained for the lamps from the minimization were considered to be the final results.From the irradiance distribution, the Illuminance of the lamp at the detector aperture can be determined at known distance d, then calculating the Luminous intensity from equations 2. Five standard lamps operating at color temperature 2856K were used. The measurements were performed at a distance of about 2 meters. The luminous intensity resulting from the measurements of the lamps using filtered trap detector was compared to the certified values reported by NPL, as shown in Table (1).The difference between calibrated lamp at NPL & the scale based on trap detector illustrated in Figure (4).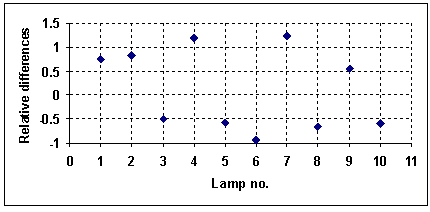 | Figure 4. Ratio of the luminous intensity measured by the QED trap detector to the NPL- based value of the lamp |
Table 1. Percentage difference between luminous intensity of group of lamps based on trap detector and NPL scale
 |
| |
|
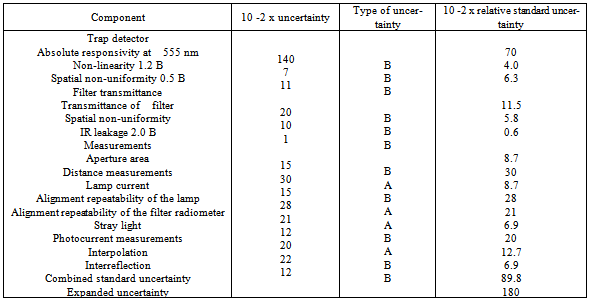
Table 2. The individual elements of uncertainty and their contribution to the luminous intensity
 |
| |
|
6.2. Uncertainties
The relative uncertainty of the measurements is about 1.8%. The major source of error affecting the uncertainty was the spectral responsivity of the detector. This is due to lower uncertainties in spectral radiometric standards. However, it is possible to reduce the uncertainty, if more accurate spectral responsivity obtained. Also, to minimize errors the trap detector should be temperature-controlled. The diffraction from the aperture and from baffles and the interreflections has a significant effect on the measurements. Table (2) illustrate the elements of uncertainty and their contribution to the luminous intensity.
7. Conclusions
The SI unit of luminous intensity, the Candela has been realized at National Institute for Standards (NIS) by using a filter radiometer which consists of trap detector QED200 and seven interference filters. The detector has been characterized for spectral sensitivity, non-uniformity and linearity to evaluate their stability as irradiance standard. Luminous intensity of group of 10 lamps has been determined by filter radiometry method. These lamps which calibrated at National Physical Laboratory (NPL) with uncertainties of + 0.8 were compared with that measured by the trap detector. The comparison showed an agreement better than 1.8%., which lies within the uncertainty of the two scales.
ACKNOWLEDGEMENTS
The authors wish to thank Dr Saber Rabie Radiometric Laboratory researcher to provide assistance to us.
References
| [1] | BIPM Comptes Rendus 16th Conf. G´en. Poids et Mesures, S`evres, Bureau International des Poids et Mesures, 1979, 100; Giacomo P., Metrologia, 1980, 16, 55-61; Giacomo P., Metrologia, 1981, 17, 74. |
| [2] | The Basis of Physical Photometry, CIE Publ. No. 18.2, Vienna, International Commission on Illumination, 1983, 42 p. |
| [3] | Zalewski E. F., Duda C. R., Appl. Opt., 1983, 22, 2867-2873. |
| [4] | Fox N. P., Trap detectors and their properties, Metrologia, 1991, 28, 197-202. |
| [5] | Durak M, Samedov F: Realization of a filter radiometer based irradiance scale with high accuracy in the region of 286 nm to 901 nm. Metrologia, 2004, 39,(6) |
| [6] | Farhad Samedov, Murat Durak, Özcan Bazkır Filter-radiometer-based realization of candela and establishment of photometric scale at UME Original Research Article, Optics and Lasers in Engineering,43,11, 2005, 1252-1266 |
| [7] | Applied Photometry, Radiometry, And Measurements Of Optical Losses, Springer Series in Optical Sciences, Vol., 163, 2012, 49-128. |
| [8] | Yoshihiro Ohno, Improved Photometric Standards and Calibration Procedures at NIST J. Res. Natl. Inst. Stand. Technol. 102(1997) 323. |
| [9] | F. Sametoglu, New traceability chains in the photometric and radiometric measurements at the National Metrology Institute of Turkey Optics and Lasers in Engineering, 2007, 45, 1, 36–42. |
| [10] | Andor G: New data-reduction method in detector-based spectral-irradiance measurements. Metrologia, 1996, 32, 495–496 |
| [11] | Özcan Bazkır, Farhad Samadov, Characterization of silicon photodiode-based trap detectors and establishment of spectral responsivity scale, Optics and Lasers in Engineering, 43,2, 2005, 131-141 |
| [12] | Thompson, A. and Chen, H., “ Beamcon III , a lineartity measurement for optical detectors,” J.Res. NIST, 1994, 99(6), 751-755 |
| [13] | M Noorma1, P Toivanen, F Manoocheri and E Ikonen, Characterization of filter radiometers with a wavelength-tunable laser source Metrologia, 2003, 40 S220–S223, Optics and Lasers in Engineering, 43,2, 2005, 131-141 |
| [14] | Ikonen E.; Karha P.; Lassila A.; Manoochehri F.; Fagerlund H.; Liedquist L.m , Radiometric realization of the candela with a trap detector,32, 6, 1995, pp. 689 |
| [15] | F Sametoglu , “Evaluation of expanded uncertainties in luminous intensity and illuminance calibrations”, Applied optics, 47, 31, 2008, 5829-5847. |
 Abstract
 Reference
 Full-Text PDF
 Full-text HTML