-
Paper Information
- Paper Submission
-
Journal Information
- About This Journal
- Editorial Board
- Current Issue
- Archive
- Author Guidelines
- Contact Us
Research in Ophthalmology
2013; 2(1): 4-9
doi:10.5923/j.ophthal.20130201.02
Variations of Cup-to-Disc Ratio in Age Group (18-40) Years Old
 Abstract
 Reference
 Full-Text PDF
 Full-text HTML
Hossam El-Din MA Khalil , Mohamed Yasser Sayed Saif , Mohamed Osman Abd El-Khalek , Arsany Makar
Ophthalmology Department, Beni-Suef University
Correspondence to: Mohamed Yasser Sayed Saif , Ophthalmology Department, Beni-Suef University.
| Email: |  |
Copyright © 2012 Scientific & Academic Publishing. All Rights Reserved.
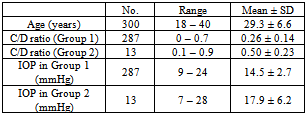
Purpose: The objective of this study is the early detection of increased cup to disc ratio and a survey study of cup-disc ratio in Beni-Sueif population in middle age group (18-40) years. Methods: Three hundred patients were enrolled in this study (60% females and 40% males with age ranged from 18-40 years). IOP and C/D ratios were measured for each patient, and visual field was performed for suspected pathological conditions. Results: In this study, we observed 2.4% of cases with difference in C/D ratio between the two eyes >0.2 (which is considered the accepted difference), 4.7% showed difference by 0.2 and 4.3% of them are glaucomatous patients, 10.7% of the patients show physiological cupping. The mean IOP for the right eye (14.7 ± 0.3) is nearly equal to that of the left eye (14.6 ± 0.3), 13 patients (4.3%) showed difference by 4 mmHg or more, 4 patients (1.3 %) were normal and the rest 9 patients (3%) were glaucomatous. Conclusion: Documentation and follow up of C/D ratio is important in early detection of glaucoma and other factors that cause cupping in normal population. Difference in binocular cupping more than 0.2, binocular difference in IOP by more than 4 mmHg and increased C/D ratio more than 0.3 raises the suspicion of glaucoma.
Keywords: Cup Disc Ratio, Cupping, Glaucoma Suspect
Cite this paper: Hossam El-Din MA Khalil , Mohamed Yasser Sayed Saif , Mohamed Osman Abd El-Khalek , Arsany Makar , Variations of Cup-to-Disc Ratio in Age Group (18-40) Years Old, Research in Ophthalmology, Vol. 2 No. 1, 2013, pp. 4-9. doi: 10.5923/j.ophthal.20130201.02.
1. Introduction
- Glaucoma is a progressive optic neuropathy with characteristic changes in the optic nerve head and corresponding visual field loss. Currently, glaucoma accounts for 12% of all global blindness with 4.5 million people affected worldwide[1]. Primary open angle glaucoma (POAG) is more frequent in Caucasian and African populations whilst primary angle closure glaucoma (PACG) is more common in Asian ethnicity. Normal tension glaucoma (NTG) is especially prevalent in Japan and Korea[2].Several objective parameters are used to evaluate characteristics associated with optic discs. Among these are the ratio of minimum-to-maximum optic disc diameter (tilt ratio)[3]; the ratio of horizontal-to-vertical optic disc diameter[4]; the degree of optic disc rotation[5-7]; the ratio of the maximum width of the peripapillary atrophy to the vertical disc diameter[4]; an angle between a line fitted to the optic disc surface and a reference horizontal line in across-sectional optical coherence tomography image[6]; and an area of peripapillary atrophy[7]. However, findings expressed by these parameters seem to be limited, particularly regarding the characteristic appearances of the cupping and vessels mentioned above, which may be too qualitative to be expressed by objective parameters[8].Data on rates of progression in ordinary clinical glaucoma care have been sparse until recently when important results have been reported from New York[9-11].Rate of disease progression is one of the most important factors determining the risk of visual disability or blindness in glaucoma and several guidelines for glaucoma management recommend assessment of rate of progression in routine glaucoma care[12]. Particularly against that background, it is desirable to learn more about rates of progression under ordinary clinical care and of risk factors associated with rate of progression[13].This study is designed to detect changes in IOP and cup to disc ratio as a survey study of early detection of glaucoma suspect in Beni-Sueif Egyptian population in middle age group (18-40) years.
2. Patients and Methods
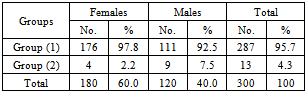
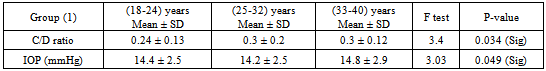
- This study was approved by the local ethic committees in Beni Sueif UniversityThis prospective cross sectional study included 300 cooperative patients (60% of them were females and 40% were males), collected from the ophthalmology outpatient clinic in Beni-Sueif University Hospital. Patients were coming to the clinic for either check up, making glasses, renew driving license or conjunctivitis.Their age ranging from 18-40 years old and classified into three age groups; 83 (27.7%) in the age group between 18-24 years, 107 (35.7%) in age group between 25-32 years and 110 (36.6%) in age group 33-40 years.Patients with diabetes mellitus, systemic hypertension, patient known to have any serious eye disease and uncooperative patients were excluded from the study.All the patients were subjected to the following:A- Sheet of full medical history:− Personal history: name, age, sex, location, occupation and menstrual history.− Past history of serious illness as: diabetes, hypertension, liver diseases, immunosuppressive diseases or autoimmune diseases.− Past medical history of:a) Systemic medications as: systemic steroids, immunosuppressive drugs, insulin, β-blockers, interferon, antihistaminics, chemotherapy or radiotherapy.b) Local medications as: local steroids, antibiotics, β-blockers, local anesthetics, medications that are used daily by the patient (IOP lowering agents), decongestant and antihistaminics.c) Ocular surgery as: cataract, glaucoma or retinal detachment.d) Previous ocular diseases as: uvitis, autoimmune diseases (Steven-Johnson syndrome) or severe eye trauma.B- Routine ophthalmologic examination to all the patients:− Visual acuity assessment using Landolt "C" eye chart. − Examination of anterior segment of the eye for exclusion of presence of any serious ocular disease.− IOP measuring by applanation tonometer. − Measuring of C/D ratio using Volk +90 D. and indirect ophthalmoscope.− Optic disc cupping was assessed independently by two clinicians. The cup: disc ratio was estimated as the percentage of surface area of the optic disc occupied by cupping in the vertical axis. We accepted a difference of 0.1 in the cup:disc ratio between the two observers in each subjective assessment and used the mean value of the two results for data analysis. If the difference was 0.2 or more the eye was excluded from study.C- Special investigations for suspected glaucoma cases:- Visual field.- OCT.
3. Results
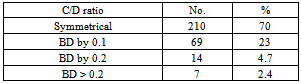
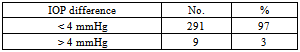
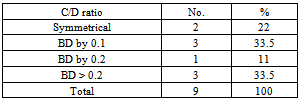
- The study included 300 patients, of them, 287 were normal and represented as group (1) and 13 patients (4.3%) were suspected to be glaucomatous patients represented as group (2). Patients in group (2) were differentiated into 7 patients (2.4%) had difference in C/D ratio between the 2 eyes more than 0.2 and 9 patients (3%) had binocular difference (BD) of IOP by more than 4 mmHg.
|
|
|
|
|
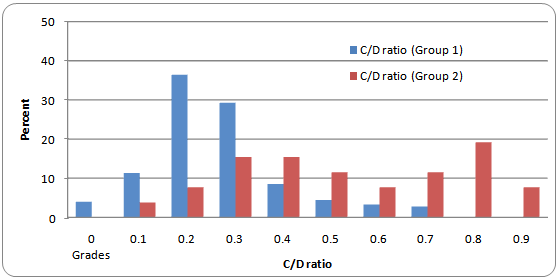 | Figure (1). Comparison of percent of mean C/D ratio in groups 1 & 2 |
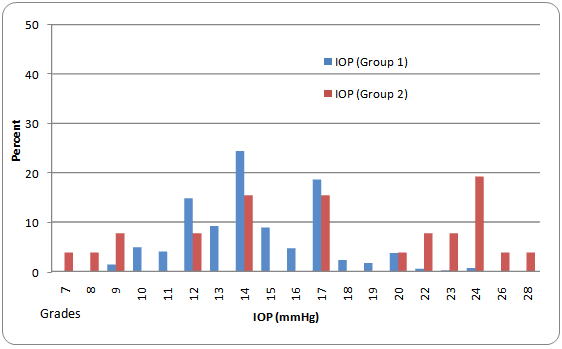 | Figure (2). Incidence of IOP (mmHg) in both studied groups |
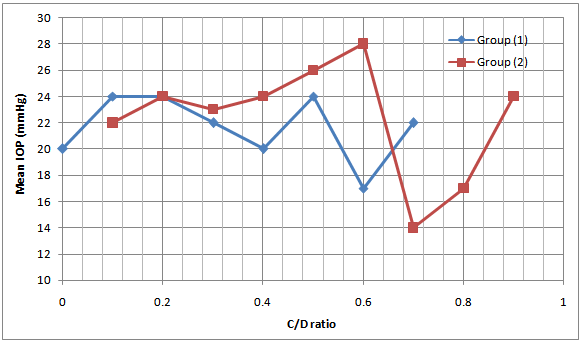 | Figure (3). Relationship between C/D ratio and mean IOP. The mean IOP was highest for C/D 0.7 ratio in group (1) and highest for C/D ratio 0.9 in group (2) |
|
|
|
4. Discussion
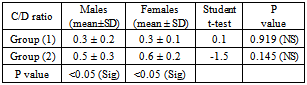
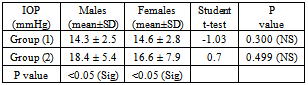
- This study was done on 300 patients attended ophthalmology outpatient clinic in Beni-Suef University hospital, age ranging from (18-40) years, 27.7% of them range from (18-24 years), 35.7% range from (25-32) years and 36.6% range from (33-40) years. 60% of them (180 patients) are female, and 40% (120 patients) are male.Davanger[14] found that IOP is similar in both right and left eyes in normal individuals, although differences in between the two eyes of 4 mmHg or more is present in less than 4% of normal individuals and such differences are common in glaucomatous patients.In our study, mean IOP for group 1 is 14.5 ± 2.7 mmHg, while for group 2 it was 17.9 ± 6.2 mmHg, 3% of them (9 patients) shows BD > 4 mmHg; only 1 % of them (3 patients) were glaucomatous and the remaining 2 % are normal.Carel, et al.[15] found a positive correlation between IOP and age. It is unclear whether the rise in IOP with age represents increase for all individuals or not.In our study, mean IOP showed increase in older age group (33-40 years) by an average about 1 mmHg, while mean IOP showed no change in younger age groups (18-24 and 25-32 years).Leska, et al.[16], reported that female have higher IOP (especially after age of 40 years). The Barbados Eye Study showed that female more likely to have high IOP without glaucoma damage, and male more likely to have OAG.In our study, the mean IOP was nearly the same for both males and females (14.3±2.5 and 14.6±2.8 mmHg, respectively) in group 1, while in group 2 the mean IOP for males (18.4±5.4) mmHg is slightly higher than females (16.6±7.9) mmHg.Thomas et al.[17], stated that it's useful to compare one eye to the fellow eye, because disc asymmetry is unusual in normal individuals. They also stated that asymmetry of C/D ratio of more than 0.2 occurs in less than 1% of normal individuals.In a study done by Saif et al.[18] on 382 children starting from infancy up to 15 years, they found that C/D ratios ranged from 0.0 to 0.1, and he stated that binocular difference in C/D ratio > 0.2 could be regarded highly suggestive of glaucoma (especially in infancy).In this study, the mean C/D ratio is equal for both eyes in 70% of patients, 23% showed difference by 0.1, 4.7% showed difference by 0.2 and 2.4% (7 patients) showed difference by more than 0.2; (4 of them are glaucomatous).In 1988, Jonas, et al.[19], stated that the larger the optic disc, the larger the optic cup. As with macrodiscs, macrocups have been described and subclassified into primary types (physiologic and fixed after 1st year of life) and secondary types (because of either increased myopic enlargement of the discs, or progressive glaucomatous atrophy).In our study, mean C/D ratio is independent for age; change in mean C/D ratio from one group to another is absent or minimal, with average 0.3±0.2.In a population-based study done in 1994 by Rohit and co-workers[20], on 4877 patients, aged 40 years or more without evidence of optic nerve disease, they found that male subjects had 2-3% larger optic discs than female subjects, and they stated that gender has no association with any significant difference in size and topography of the normal optic disc.In our study, mean C/D ratio is equal for both male and female, with average 0.3 with S.D ±0.2.In a study done by Hrynchack and others[21] using stereoscopic biomicroscopy and compared with that evaluated by viewing a non-stereo digital image of the optic nerve head, the average C/D ratio was 0.29 with range from 0.0-0.8.Jonas and others[19] stated that normal ratios of C/D ratio span from 0.0 to 0.8, as they depend on highly variable optic disc and optic cup parameters. Also Thomas and others stated that vertical C/D ratio is normally between 0.1 and 0.4, although as many as 5% of normal individuals will have C/D ratio larger than 0.6.In our study, the highest percentage for C/D ratio was in group 1 for C/D ratio 0.2(36.4%) while in group 2 it was highest for C/D ratio 0.9 (19.2%).Leydhecker and co-workers[22], they performed Schiotz tonometry on more than 10000 normal individuals. They found that the main IOP (±S.D) is 15.8± 2.6 mmHg.Mark[23] stated that normal IOP is usually defined from 10-21 mmHg, in non-glaucomatous people average IOP is 16 mmHg, with S.D of 2.5 mmHg.In our study, the highest number of mean IOP was for 14mmHg in group 1 (140 eyes: 24.4%); and for 19.2mmHg in group 2 (5 eyes: 19.2%).In a study done by Chatzibalis and co-workers[24], on 467 normal individuals, randomly selected C/D ratio was assessed by ophthalmoscope and IOP was measured in the evening by applanation tonometer. They found that C/D ratios were, in general, larger in individuals with higher IOPs; however, this relation was weak through statically significant. There are individuals with high C/D ratio and relatively low IOP values and vice versa.Another study done by Rath, et al.[25], on randomly selected 78 adult patients with early to moderate chronic OAG, treated on various therapeutic regimens, these patients had had two consecutive successful optic disc analyses with Rodenstock ONH analyzer. They found that a decrease of optic disc cupping is more likely with a greater IOP reduction and a lower final IOP, and increase in cupping is more likely with less or no IOP reduction and a higher final IOP.In our study, mean IOP was highest for C/D ratio 0.7 by 15.6 mmHg in group 1 while it was highest for C/D ratio 0.9 with 24 mmHg in group 2.
5. Conclusions
- Documentation and follow up of C/D ratio is important in early detection of glaucoma and other factors that cause cupping in normal populationFrom the above results, it can be concluded that the difference in binocular cupping more than 0.2, binocular difference in IOP by more than 4 mmHg and increased C/D ratio more than 0.3 raises the suspicion of glaucoma.