-
Paper Information
- Paper Submission
-
Journal Information
- About This Journal
- Editorial Board
- Current Issue
- Archive
- Author Guidelines
- Contact Us
Research in Ophthalmology
2012; 1(1): 1-5
doi: 10.5923/j.ophthal.20120101.01
Humphrey Matrix Perimetry for Open-Angle Glaucoma Screening in A High-Risk Population
 Abstract
 Reference
 Full-Text PDF
 Full-Text HTML
Colin I Clement 1, 2, Ivan Goldberg 1, 2, Stuart L. Graham 3, 4, Paul R Healey 3, 5
1Glaucoma Unit, Sydney Eye Hospital, Sydney, 2000, Australia
2Eye Associates, Sydney, 2000, Australia%%%%%The University of Sydney, Sydney, 2006 Australia
3Eye Associates, Sydney, 2000, Australia
4The Australian School of Advanced Medicine, Macquarie University, Sydney, 2109, Australia
5The University of Sydney, Sydney, 2006 Australia%%%%%Westmead Millenium Institute for Medical Research, Sydney, 2145, Australia
Correspondence to: Colin I Clement , Glaucoma Unit, Sydney Eye Hospital, Sydney, 2000, Australia.
| Email: |  |
Copyright © 2012 Scientific & Academic Publishing. All Rights Reserved.
The aim of this study was to evaluate the role of Humphrey Matrix perimetry to better guide appropriate referral of at-risk individuals for glaucoma assessment. Fifty-two consecutive patients referred to a specialist glaucoma ophthalmology practice for an opinion about a new diagnosis of glaucoma were enrolled. Prior to assessment for presence of open-angle glaucoma, patients performed Humphrey Matrix perimetry with results withheld from both patient and assessing glaucoma specialist. Humphrey Matrix perimetry results were later compared with the outcome of clinical assessment for each individual. Eleven of 52 participants were diagnosed with open-angle glaucoma (21.2%). Negative predictive value of Humphrey Matrix perimetry in this population ranged from 87.1% to 93.6% depending on the indices used. Only two individuals with normal Humphrey Matrix perimetry were diagnosed with open-angle glaucoma. These results suggest Humphrey Matrix perimetry displays a high negative predictive value when screening for open-angle glaucoma in an at-risk population. It may be useful in this context to better guide eye health professionals on appropriate referral of patients for an opinion about glaucoma.
Keywords: Glaucoma, Screening, Perimetry, Frequency Doubling Perimetry
Article Outline
1. Introduction
- Glaucoma is an important cause of visual impairment with an overall prevalence of 2%[1,2]. In most developed nations, half the glaucoma in the community remains undiagnosed[1]. As glaucoma is a progressive disorder that may cause blindness or significant visual field loss, earlier recognition and intervention are important. Examination by an eye health care professional for reasons other than glaucoma provides an opportunity to detect and appropriately refer individuals with undiagnosed glaucoma. However, eye health care professionals may not accurately detect such cases and may miss the diagnosis in a significant number of individuals[3]. In addition to risk factor assessment and optic disc examination, perimetry may have a useful role in screening for undiagnosed glaucoma. Problems with the use of perimetry for screening include expense of equipment, long test times and high false positive rates amongst naive subjects[4]. Mitchell et al.,[1] reported false positive rates of 20% withsupra-threshold perimetry, which would overwhelm our ophthalmic services if such screening yielded referrals. While supra-threshold perimetry in a reduced number of stimulus locations may reduce the false positive rate, it does so at the cost of sensitivity[1,5].Frequency-doubling threshold (FDT) perimetry was developed in the hope of better detecting early glaucomatous visual field loss and may be suitable for this purpose. It uses a stimulus that non-linearly stimulates magnocellular retinal ganglion cells[6]. Perhaps because of reduced redundancy, damage to these cells can be detected relatively early in glaucoma[7-9]. FDT perimetry is comparable with achromatic perimetry for detecting established mild, moderate and severe field loss in glaucoma[10,11] and it identifies significantly more patients with ocular hypertension that progress to glaucoma than does conventional achromatic perimetry[12,13].A newer version of the FDT perimeter is the Humphrey ‘Matrix’, which uses a 5-degree rather than 10-degree square stimulus. For the cental 24 degrees of field, the Humphrey Matrix tests 55 zones verses 17 in the original machine. This may yield improved performance.Given the known high false positive rates for perimetric screening, we wished to evaluate the ability of Matrix perimetry, performed after normal optometric assessment, to identify patients without glaucoma, thereby reducing the false positive rate of optometric referral for glaucoma. Thus the aim of this study was to assess the predictive value (in particular, the negative predictive value) of Humphrey Matrix perimetry in patients with a provisional diagnosis of open-angle glaucoma.
2. Methods
2.1. Subject Selection
- Subjects were recruited from an urban ophthalmology practice. The Human Research Ethics Committee of the South Eastern Sydney Area Health Service approved the study protocol. Informed consent was obtained from each participant.Patients newly referred to the practice for a specialist glaucoma assessment were eligible for enrolment in the study. Testing was performed on all suitable individuals irrespective of best-corrected visual acuity or the presence of non-glaucomatous ocular pathology. Patients were excluded if they had previously been diagnosed with glaucoma, had used anti-glaucoma medication(s) or had been referred because of a suspected angle closure mechanism.
2.2. Assessment
- One of three ophthalmologists (IG, SLG or PRH) assessed all patients. A diagnosis was made on the basis of typical optic disc changes and / or the presence of glaucomatous visual field loss using SITA standard 24-2 automated perimetry (Humphrey Field Analyzer, Zeiss/Humphrey systems, Dublin, California, USA) according to previously described criteria[14]. Diagnosis was aided in all cases by the use of Goldmann applanation tonometry, ultrasonic pachymetry, gonioscopy, Heidelberg retinal optic disc tomography and optic disc photography. Patients diagnosed as ‘glaucoma suspects’ after assessment were considered not to have glaucoma for the purpose of the analysis.
2.3. Humphrey Matrix Perimetry
- We wished to simulate Matrix perimetry being performed after the optometrists had made a provisional diagnosis of glaucoma, but prior to ophthalmologist evaluation. In order to standardise data collection and masking, Matrix perimetry was performed at the ophthalmology practice, after visual acuity measurement but prior to any other test or assessment by the ophthalmologist. Each subject performed Humphrey Matrix perimetry (Humphrey Matrix, Zeiss/Humphrey systems, Dublin, California, USA and Welch Allen, Skaneateles Falls, New York, USA) using the 24-2 threshold algorithm that tests 55 zones in the central 24 degrees of vision. Each subject was instructed on the use of the Humphrey Matrix, shown the frequency doubling illusion on a card and then shown the fixation target and stimulus in simulation mode. Testing was performed in a dimly lit room and subjects wore their prescription glasses or contact lenses when correction was required. One of the authors (Dr CI Clement) supervised all Matrix perimetry. If fixation losses, false-positive or false-negative errors exceeded 33%, testing was stopped, the subject re-instructed and Matrix perimetry restarted. Patients who were not able to perform perimetry reliably despite the above measures were not included in the study. Both eyes were tested with the right eye always tested first. Results of the Matrix perimetry were withheld from both the patient and the assessing ophthalmologist.Both SITA 24-2 and Matrix 24-2 threshold tests were performed once for each patient and results used for data analysis.In order to reflect the screening use by non-ophthalmologists, Matrix tests were interpreted with the assistance of automated indices and did not require recognition of characteristic patterns of visual field loss. A Matrix field test was considered positive for glaucoma if either mean deviation (MD) or pattern standard deviation (PSD) had a p value < 5%, or if the glaucoma hemifield test (GHT) was abnormal.
2.4. Statistical Analysis
- The GHT, MD with p < 5% and PSD with p < 5% as generated by the Humphrey Matrix were independently assessed as markers of an abnormal visual field. Sensitivity, specificity, positive-predictive value (PPV) and negative-predictive value (NPV) were calculated for GHT, MD, PSD and MD and PSD.
|
3. Results
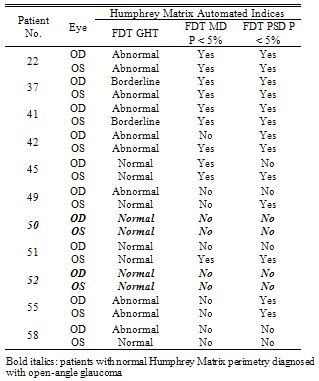
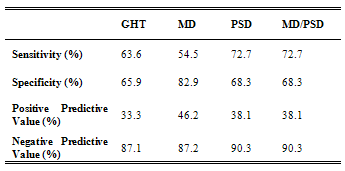
- Fifty-two consecutive newly referred patients were enrolled in the study. The mean age was 53.58 ± 14.02 years (range, 18 – 81) with 61.5% females. Visual acuity was 1.01 ± 0.25 OD and 0.98 ± 0.29 OS. The commonest stated reasons for provisional glaucoma diagnosis were “suspicious” optic disc morphology (24/52; 46.2%), positive family history (22/52; 42.3%), and/or raised intra-ocular pressure (22/52; 42.3%). Twenty-two participants (42.3%) had more than one risk factor. All but 2 patients had been referred directly from an optometrist.The average time taken to complete the Humphrey Matrix perimetry was 311.2 ± 13.2 seconds (range: 287 – 353 seconds) for each eye. This was statistically, but not clinically, significantly faster than Humphrey SITA-standard 24-2 perimetry which took 336.5 ± 67.8 seconds (range: 226 – 585 seconds) (t-test; p = 0.0001).Following ophthalmological assessment, 11 of the 52 participants were diagnosed with open-angle glaucoma (Table 1), a pre-test probability of 21.2%.Table 2 shows the diagnostic indices of Matrix perimetry. Using the GHT to indicate a positive result, sensitivity and specificity were calculated to be 63.6% and 65% respectively, with a positive predictive value (PPV) 33.3%. Using MD as an indicator of a positive result, sensitivity fell slightly to 54.5% but specificity improved to 82.5%: PPV increased to 46.2%. Sensitivity was further improved to 72.7% when PSD was used. There was however a corresponding fall in specificity to 67.5% when compared with MD, however this was still better than GHT. PPV also fell to 38.1%. When either MD or PSD was considered to indicate a positive result, there was no benefit demonstrated compared with using PSD alone.
|
4. Discussion
- Despite the need, attempts to develop a screening test for glaucoma have not been successful to date. Traditionally tonometry has been the most popular means of screening for glaucoma, but sensitivity and specificity are too poor to be of any practical use alone[15]. Optic nerve head examination requires an experienced examiner and standard automated perimetry (SAP) remains expensive, poorly portable, with long testing times and displays a learning curve often rendering the first test unhelpful[4]. Further, findings from anatomical work suggest up to 50% of RGCs are lost before field defects are detected on SAP[16] making it unsuitable for detecting early disease. This study differs from previous reports on perimetric screening for open-angle glaucoma in two principal ways: (i) the performance of Humphrey Matrix frequency doubling perimetry was evaluated; and (ii) perimetry was performed after a screening diagnosis of glaucoma was made and confounders of field abnormality or other eye diseases requiring referral (such as cataract) had been excluded. This represented a population at the highest identified glaucoma risk in the current health system. As such, the principle aim of the study was to determine whether Matrix perimetry could assist in the appropriate referral of patients with open-angle glaucoma. In this context, the main outcome of interest was negative predictive value of the Matrix for screening. This value determines the confidence with which one can exclude open-angle glaucoma based on the Matrix result. The negative predictive value of Matrix perimetry was good, ranging from 87.1% to 90.3% when GHT, MD or PSD were used as a measure of an abnormal result (Table 2). When the three indices were considered simultaneously, negative predictive value improved to 93.5%; that is of the 31 individuals with a normal Humphrey Matrix perimetry result, only 2 (6.5%) actually had glaucoma. The other 29 individuals without glaucoma in whom perimetry was normal could have avoided referral assessment had the Humphrey Matrix been used to guide referral. That 6.5% of individuals with glaucoma were missed initially appears to be a bad outcome. However, such patients are likely to have an ongoing relationship with their eye health professional and would have opportunities for repeat testing. The total number of patients missed over time may therefore be less than we report here.These findings are consistent with the notion that FDT perimeters are better able to detect early RGC loss compared with SAP[6]. A negative result in such a perimeter is more likely to result from absent RGC damage, hence the high negative predictive value. Of the two glaucoma cases with a normal Humphrey Matrix result, both were male. One was referred because of raised IOP alone and the other a combination of raised IOP and suspicious optic disc morphology Both had prior perimetric experience and performed both SAP and Humphrey Matrix perimetry reliably on the day of testing. There were no obvious indications as to why in both cases Humphrey Matrix perimetry was normal despite structural evidence of open-angle glaucoma. Using automated indices for Matrix assessment raises the possibility of some individuals performing at a supra-physiological level (compared to the normative database), giving good test sensitivities despite early structural damage. Even in such individuals, one would expect the PSD to highlight differences between areas of damage and non-damage. Another possibility is that the temporal pattern of RGC loss may not be the same in each case. Although there is strong support for preferential magnocellular RGC loss early in the pathogenesis of glaucoma[7], there is evidence also supporting preferential targeting of koniocellular RGCs[17]. Matrix perimetry would not be expected to detect glaucomatous visual field loss in these individuals because of the response properties of koniocellular RGCs. Alternatively, in individuals with preferential parvocellular RGC damage[18], early cell loss may not be detected by Matrix perimetry because of increased redundancy within this visual system as well as response properties. The sensitivity, specificity and positive predictive values for Matrix perimetry in this population are noteworthy because FDT perimetry has been theorised to be better adapted for screening on a population basis[6]. Some studies of glaucoma screening suggest FDT perimetry is a promising technique for early detection[9,19] but others argue improved specificity and positive predictive value are required for it to be useful[20]. We found Humphrey Matrix perimetry accurate for excluding early glaucoma in up to 93.5% of at-risk patients without the disease. This represents a significant improvement in specificity over the original FDT perimeter[20]. Improved specificity may be the result of reduced target size, which theoretically facilitates detection of smaller, earlier visual field defects. We found the positive predictive value of the Humphrey Matrix to be in the range of 33 – 46%. This represents a doubling of positive predictive value compared with referral of high-risk individuals without the test . However, if one assumes a general population prevalence of 2% for glaucoma[1,2] then PPV for Humphrey Matrix would be approximately 4%. This is no different from rates reported for conventional FDT perimetry[20]. Although the main influence on positive predictive value is disease prevalence, other reasons for such a low value might include patient factors such as the effects of intercurrent ocular pathology, refractive error, test inexperience or fatigue.We attempted to assess the influence of other factors by analysing the impact of excluding patients that had other ocular pathology or refractive error outside the usual ± 6-dioptre reference range. Although 5/52 patients had other ocular pathology and 2/52 patients had > 6-dioptres of refractive error, their exclusion resulted in little improvement in PPV. This leaves test inexperience and fatigue as potential sources of error. Test-retest variability[21,22] and learning effect[23] have already been shown to significantly influence SAP results and the same appears to be true for Humphrey Matrix perimetry. Several studies indicate Humphrey Matrix perimetry indices, most notably mean deviation, improve with repeat testing in individuals with or without glaucoma[24–26]. One study[24] has indicated the learning effect is largely gone by the second test whilst in others it persists beyond the third[25,26]. Regardless, the overall influence of learning may be less than described for SAP[27,28]. The importance of this in perimeters using FDT is reinforced by the finding that repeat testing during glaucoma screening improves test sensitivity and specificity[20,29]. That test inexperience may be an influential factor in both SAP and Matrix perimetry highlights a potential source of bias in this study. Many of the participants had not performed SAP prior to enrolment and none had performed Matrix perimetry, potentially exposing them to factors outlined above. It is possible that some patients initially diagnosed with glaucoma, had a false positive SAP. However, a diagnosis of glaucoma was never made solely on the basis of SAP results, but in conjunction with corroborating optic disc and nerve fibre layer pathology.Performance of SAP followed by Matrix perimetry in the same sitting is another potential source of bias. Second tested eyes with FDT perimetry display a fatigue effect[30] and this may also be the case for Humphrey Matrix perimetry. One might expect that testing with SAP immediately prior to Humphrey Matrix could exaggerate this effect although we are not aware of any work that has specifically addressed this issue. Strategies for future studies and clinical applications of Humphrey Matrix perimetry might include testing on different days, retesting to confirm perimetry results or using different testing algorithms[20,29,31].
5. Conclusions
- In conclusion, Humphrey Matrix perimetry may be useful to guide eye health professionals about referral of patients for a glaucoma opinion in situations of uncertainty. Two-thirds of patients with risk factors for the condition but in whom glaucoma is not present may avoid unnecessary referral when Humphrey Matrix perimetry is used and found to be normal.