-
Paper Information
- Next Paper
- Paper Submission
-
Journal Information
- About This Journal
- Editorial Board
- Current Issue
- Archive
- Author Guidelines
- Contact Us
International Journal of Nursing Science
p-ISSN: 2167-7441 e-ISSN: 2167-745X
2013; 3(1): 7-14
doi:10.5923/j.nursing.20130301.02
Measurement of Job Satisfaction in Nursing School Teachers: Confirmatory Factor Analysis of a Job Satisfaction Scale Based on the Stamps Scale
 Abstract
 Reference
 Full-Text PDF
 Full-text HTML
Kazuyo Shimazaki1, Takashi Tsubakita2
1Department of Nursing, College of Life and Health Sciences, Chubu University, Aichi, 487-8501, Japan
2Department of Communication, Nagoya University of Commerce and Business, Aichi, 470-0193, Japan
Correspondence to: Takashi Tsubakita, Department of Communication, Nagoya University of Commerce and Business, Aichi, 470-0193, Japan.
| Email: |  |
Copyright © 2012 Scientific & Academic Publishing. All Rights Reserved.
Teachers in nursing schools, unlike those in nursing faculties in universities, have to play multiple roles, which causes frequent burnout and a potential turnover problem. A measure of job satisfaction is thus needed to obtain clear and subjective perceptions of the work environment and to develop better working conditions. We transformed the Revised Attitude Scale Items to Measure Occupational Satisfaction of Hospital Nurses (Stamps, P. L., et al., 1978; Ozaki, F. & Tadamasa, T., 1988) for clinical nurses into a scale for nursing teachers by shortening and rewording 30 selected items. The dimensional structure of the original six-factor model was investigated by using three samples of Japanese nursing teachers of different ages (n = 303; 30s =73, 40s=152, over 50=78), which resulted in the elimination of the “Task” factor from the hypothesized six-factor structure. The revised five-factor model was retained although its fit toa cross-validated sample was not satisfactory. However, in an exploratory analysis, we examined the non-invariance of all parameters and foundthat two itemswere not invariant across the groups. Based on the results of the analysis,we offered several suggestions to modify items in the scale for practical use.
Keywords: Job Satisfaction, Nursing Teachers, Nursing School, Confirmatory Factor Analysis
Cite this paper: Kazuyo Shimazaki, Takashi Tsubakita, Measurement of Job Satisfaction in Nursing School Teachers: Confirmatory Factor Analysis of a Job Satisfaction Scale Based on the Stamps Scale, International Journal of Nursing Science, Vol. 3 No. 1, 2013, pp. 7-14. doi: 10.5923/j.nursing.20130301.02.
Article Outline
1. Introduction
- The demand for nurses increases with the aging of the population in advanced nations. The chronic unbalance between the demand for and supply of nurses in Japan has not been rectified. This is partly due to turnover and absenteeism, which have been frequently observed. In order to resolve the nursing labor shortage problem, the establishment of training institutions for nurses and improvements to the work environment in these institutions has been actively promoted. In Japan, training institutions for nurses can be grouped into two categories: colleges of nursing and nursing schools. Colleges of nursing normally offer a 4-year course to become a registered/health nurse under the jurisdiction of the Ministry of Education, Culture, Sports, Science and Technology. The nursing schools normally offer a 3-year course to become a registered nurse under the jurisdiction of Ministry of Health, Labour and Welfare. In the last 20 years, about 200 colleges of nursing have been established. Together, the colleges of nursing in Japan produce 17,000 nurses every year. This seems like a small number compared to the 25,000 nurses graduated by the 661 nursing schools in 2009[1]. The curriculum of nursing education is rigidly organized, and students must pass the national board exam to become nurses. Compared to the faculty in the colleges of nursing, which provide a 4-year course, the teachers in nursing schools are under more pressure because they must complete the curriculum in three years. Moreover, most nursing schools are run by small organizations[2].Teachers in nursing schools are required to do clerical work in addition to teaching, so they frequently work overtime. Working conditions are thought to be the main reason for burnout and the high turnover rate in such teachers. In addition, because of the time and the economic constraints typical of smaller operations, it is difficult for these teachers to develop their expertise[3][4][5]. A growing number of teachers leave nursing schools in search of tenured positions in colleges of nursing, which offer greater social, economic, and academic resources. Concerned about the possible deterioration in education quality in nursing schools, Japan’s Ministry of Health, Labour and Welfare launched a project, “New Style of Nursing Teachers,” to seek comprehensive solutions to increase the number of nursing teachers as well as to ensureopportunities for continuing education for teachers in nursing schools[6]. In Japan, it is widely accepted, albeit without any direct evidence, that the main reason for the turnover amongnursing school teachers is the deterioration in the quality of students, work responsibilities, and the working environment[7]. To our knowledge, however, there has been no research aimed at measuring how teachers perceive working conditions in schools of nursing. Therefore, as a first step, in the current study, we focused on themeasurement of job satisfaction among nursing schoolteachers. Job satisfaction is defined as a subjective evaluation of one’s adaptation to work, containing physical, psychological, and environmental factors, which have a complex relationship with each other[18]. In the field of nursing management, studies on job satisfaction of clinical nurseshave been widely conducted since 1970, first in the United States and later in other countries, to prevent turnover of nurses and to secure a stable source of labor in clinical settings[18, 8]. No study has examined job satisfaction among nursing school teachers, because there is no tool to measure this construct specifically for nursing schoolteachers in Japan. Therefore, we developed a measure based on the Revised Attitude Scale Items to Measure Occupational Satisfaction of Hospital Nurses (Stamps et al., 1978; referred to as the Stamps scale in this article)[8]. The Stamps scale has traditionally been used to assess the job satisfaction of clinical nurses in Japan[9]. As of 2003, the use of the Stamps scale was reported in 96 research articles in Japan[10]. In order to measure job satisfaction based on the Stamps scale, we modified each item so that it was suitable for nursing schoolteachers and conducted a factor analysis on the new scale to confirm its factorial validity. We hoped to gain insight into the job satisfaction of teachers in nursing schools by conducting research using the adapted scale.In previous studies, job satisfaction of clinical nurses has been related to age, particularly for nurses aged 25 to 36 years[11]. According to Hirata et al.[12], job satisfaction is the lowest for people in their 30s. On the basis of this body of research, we grouped our sample by age (30s, 40s, and over 50).
2. Method
2.1. Participants
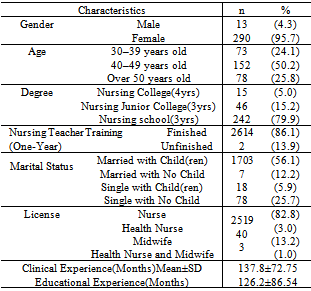
- We selected 91 nursing schools with diverse demographics and asked the administrators of these schools to participate in the study. We received positive responses from 59 schools. To increase the response rate of the surveys, we mailed the survey forms to the participating schools and requested that the managerial staff distribute, collect, and send back the questionnaires together. The participants were informed of the purpose of the survey, and were asked to answer questions about job satisfaction and other related questions. We asked respondents to specify their age only within a range, and did not ask for any other information about their identity. Each questionnaire was covered by a blank sheet of paper to protect the privacy of the respondent.Of the 613 questionnaires distributed, 396 (64.6%) were returned and 303 (76.5%) were used for statistical analysis. In Japan, there are approximately 7,000 nursing teachers[6]. Therefore, our sample represented 4.3% of the population of teachers in nursing schools. Table 1 shows the demographics of the participants.
|
2.2. Measure
2.2.1. Job Satisfaction Scale for Nursing Teachers in Nursing School (JSSNT)
- We selected 30 of the 48 items from the Stamps scale to create a brief version suitable for use in nursing schools. We eliminated crossover items in each factor and the Doctor-Nurse Relationship component. Each item selected was reworded to apply to teachers in nursing schools based on the Japanese version of the Stamps scale[15]. The items used in this study are given in the Appendix.As we note later, all items in the “Task” component were excluded as a result of the analysis.
2.3. Analysis
- To confirm the hypothesized factor-structure of the scale, we used a three-step method[13]. First, we created three groups by age (30s, 40s, and over 50), and randomly selected 30 participants from each group to use as a composite validation sample. Confirmatory factor analysis with maximum likelihood estimation was conducted with three models: (i) the null model, which assumed that no single latent factor influenced any of the observed variables; (ii) the one factor model, which assumed that only one latent factor influenced the observed variables; and (iii) the original six-factor model, which assumed that the observed variables are influenced by six factors, as in the original Stamps scale. After this analysis, a slight modification was made to improve the model's fit to the data by referring to the modification indices, as AMOS indicated. The modified model became the fourth model. The second step was a cross-validation analysis using three samples (30s, 40s, and over 50; Ns = 73, 152, 78, respectively). In the final step, we examined the robustness of the revised model across the three samples. In this study, all models were analyzed using the maximum likelihood method (AMOS 21.0).
3. Results
3.1. Descriptive Statistics
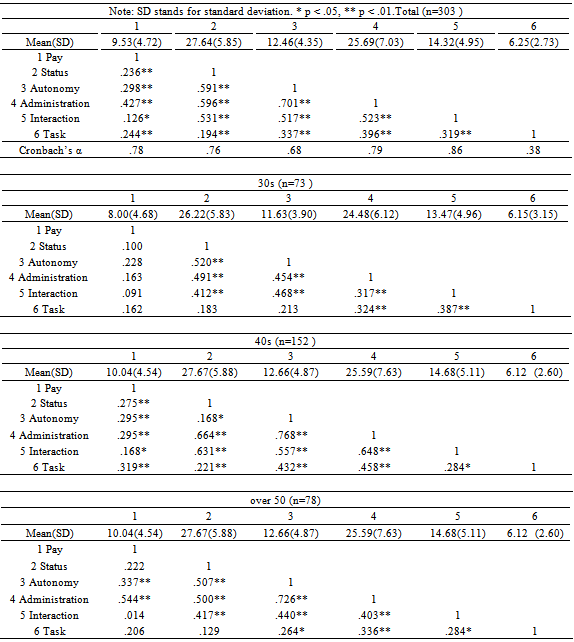
- The Cronbach’s alpha coefficients for each of the six factors and the correlations between each factor are shown in Table 2.The reliability coefficients for each factor were generally high except for the Task factor (α = .38). Strong positive correlations between the factors were observed, except between Pay and other factors for the 30s and over-50 groups. The largest correlations observed were between the factors Autonomy and Administration in the 40s and over-50 groups. On the other hand, the smallest correlations observed were between the factors Pay and Interaction for all groups.
|
- In order to examine the effects of age on each of the factor scores, a one-way between-groups (by age range) ANOVA was conducted.Itrevealed no effect of age on sumscore [F (2, 302) = 1.140, n. s.]. However, there were significant effects of age on Pay[F (2, 300) = 5.23, p = .006] and Status [F (2, 300) = 4.08, p = .018]. Post-hoc comparisons using Tukey's HSD test on Pay indicated that the mean score of the 30s group (M = 8.0, SD = 4.68) was significantly lower than those of the 40s group (M = 10.04, SD = 4.54) and the over-50 group (M = 9.99, SD = 4.86). For Status, the 30s group (M = 26.22, SD = 5.83) scored significantly lower than the over-50 group (M = 28.91, SD = 5.59).Next, in order to examine the hypothesized factor structure as a whole, we conducted a confirmatory factor analysis (see section 3.2).
3.2. Confirmatory Factor Analysis
- Our confirmatory factor analysis consisted of three steps: the analysis by composite validation sample (3.2.1), the analysis by cross validation samples (3.2.2), and the analysis of the invariance of factorial structure model and the invariance of measurement model (3.2.3).
3.2.1. Composite Validation Sample
 | Figure 1. Standardized estimates forthe entire sample (N=303). Note: All parameter estimates in this revised five-factor model are significant at the p <.05. “e”: error variables that influence each item. The one-way arrows from the five factors to each item stand for factor loadings. The two-way arrows between factors stand for correlations. Note that the estimation of correlations in structural equation modelling is different from the method of estimation in exploratory factor analysis. The letter “r” before the item number stands for the reversed-scored items |
|
3.2.2. Cross-Validation Sample
- The revised five-factor model was examined with three independent cross-validation samples. As shown in Table 4, we used three samples: participants in their 30s, 40s, and over 50. Although the CFI wasless than .90, which means that the model did not fit the given data satisfactorily, especially for the 30s and over-50 samples, we retained the revised five-factor model.
|

3.2.3. Invariance of Factorial Structure and Measurement
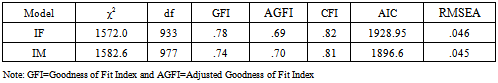
- The results of the test of the invariance of factorial structuremodel (IF model) and invariance of measurement model (IM model) are shown in Table 5.This result does not necessarily mean that both the IFmodel and the IMmodel were not acceptable because the goodness of fit index (GFI) tends to be less than .90 when there are more than 30 observed variables in the examined model[14]. There were 81 observed variables in each model in this analysis.The CFIs of both models did not meettheir respective criteria of .90. Therefore, we canconclude from this result that there are non-invariance(s) somewhere in the revised five-factor model.In order to find where the non-invariance(s) were, we examined every factor loading and correlation by comparing the full constrained model(model I), in which every factor loading and correlation were constrained to be equal across the three samples,tothe semi-constrained model (modelII), in which only one of factor loadings or correlations in question was not equal between any two samples. These iterative analyses showed thatitem JS22, item JS25, and the correlation between the factors Status and Autonomy were not invariant (p = .024, .041, and .40, respectively) across the samples. In other words, there were significant differences between model I and the three model IIs (three models excluding the equality constraint of rJS22, JS25, and the correlation between Status and Autonomy, respectively).
|
4. Discussion
4.1. Exclusion of Task Factor and Other Items
- In this study, the Job Satisfaction Scale for Nursing Teachers in Nursing School (JSSNT) was constructed based on the Stamps scale, and its factor structure and validity were analyzed. There is a Japanese version of the Stamps scale in which the reliability of the Task factor was not confirmed, and the Cronbach’s reliability coefficient for the entire scale was not supplied by the authors[15]. In addition, the reliability of the Task factor was not assured in the present study (α = .38). Cronbach’s alpha coefficients of the factors except the Task factor were between .68 and .86. Therefore, we eliminated the Task factor and used a five-factor model as the baseline model.Analysis of the revised five-factor model revealed that this model can be used to assess job satisfaction of nursing teachers in nursing schools. However, we suggest that the lack of the Task factor should be compensated for by the use of more applicable items than items rJS10 and rJS29.In addition, items JS22 and JS25 were not invariant across the three groups. These items could be reformulated or replaced by other items if their inclusion is deemed necessary.
4.2. Factorial Validity of the JSSNT among Nursing Teachers
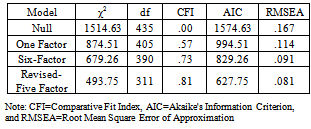
- A factor analysis using the composite sample from three different age groups was conducted to confirm the robustness of the five-factor structure. The results indicated that the fit of the revised five-factor model (AIC = 627.75) was better than that of the one-factor model (AIC = 994.51) and the six-factor model (AIC = 829.26). However, as noted above, it is problematic to exclude the Task factor when we assess job satisfaction. The items rJS10 and rJS29 in the Task factor are assumptive questions (“I could deliver much better education if I had more time with each student” and “I think I could do a better job if I didn't have so much to do all the time”). Respondents may have found these two items inconsistent with the other items. Therefore, in order to develop a six-factor model, as is the case with the Stamps scale, we had to create a Task Requirements component without using items rJS10, JS27, and rJS29. Other relevant items in the Stamps scale are "I don't spend as much time as I'd like to taking care of patients directly," "The amount of time I must spend on administration (‘paper’) work on my service is reasonable and I'm sure that patients don't suffer because of it," and "There is too much clerical and ‘paper work’ required of nursing personnel in this hospital.” We suggest that the adjusted Task factor be composed of these three items.New paths indicating covariances between the error variables (e14–e13, e23–e27, and e21–e27) were placed in the revised model to increase the fit to the data. Each pair of items, JS13–JS15, rJS21–rJS16, and JS19–rJS16 (item pairs that the error variables were supposed to effect), could be collapsed into one item. Alternatively, any one of two item pairs could be eliminated.The fit of the model to the cross-validation sample was generally less than .90. However, we did not reject the revised five-factor model. According to Kline, an ideal sample size in structural equation modeling is twenty times greater than the number of parameters in the model[16]. Our sample falls short of this ideal.It could be said that the results of the analysis reflected the inadequacy of our grouping method of the sample and/or our small sample, rather than the original model itself.
4.3. Invariance of the Factorial Structure and Measurement
- The multi-group analysis of the model showed that there were some variances in items JS22 (“From what I hear from and about teachers at other schools, the teachers at this school are fairly paid”) and JS25 (“I'm generally satisfied with the way educational practices are organized and accomplished at this school”) and in the correlation between the factors Autonomy and Status.As for items JS22 and JS25, the variance may reflect the fact that beginner teachers cannot rate their satisfaction with pay and educational practices of their school before they gain enough experience to compare their situation with that at other schools. Therefore, item JS22 should be altered to read, "It seems that the teachers at this school are fairly paid," and item JS25, "I think the way educational practices are organized and accomplished at this school is appropriate."As for the correlations between the factors Status and Autonomy, the estimate of the over-50 group was lower than that of the 40s and 30s groups. We imagine that for those teachers in their 50s or over, satisfaction with autonomy differed from those in their40s because most have reached the managerial level. Therefore, it is likely that the impact of being autonomous changes between the 40s and 50s. However, more empirical investigation is needed in order to explore this point.The measurement scale for the faculty in colleges of nursing should be reworded in accordance with their academic environments. In the colleges of nursing, there are various faculty members with different job titles. Therefore, it would be difficult to measure job satisfaction by using only one scale. The same would hold true for other relevant areassuch as the job satisfaction of the faculty members of medical departments.
5. Conclusions
- We developed a job satisfaction scale for nursing teachers in nursing schools (as opposed to universities) based on the Stamps scale. The hypothesized six-factor model was not supported, but the factor structure of a revised five-factor model was partly supported by a confirmatory factor analysis. The most important limitation of this study is that it was necessary to exclude the Task Requirements Component of the Stamps scale. This exclusion should be addressed in future studies. Although we obtained 303 forms from 59 nursing schools (8.9% of nursing schools in Japan), the size of our sample is relatively small for structural equation modeling. Therefore, this study should be replicated using a larger sample.
Appendix
- Listed below are the items of the JSSNT that were based on the Stamps Revised Attitude Scale Items to Measure Occupational Satisfaction of Hospital Nurses. The Japanese version by Ozaki F., and Tadamasa, T. (1988) was also referred. (The “r” before the item number stands for the reversed-scored items.)Pay Component (4 items)rJS20. The present rate of increase in pay for teachers at this school is not satisfactory.rJS6. Excluding myself, it is my impression that a lot of teachers at this school are dissatisfied with their pay.JS22. From what I hear from and about teachers at other schools, the teachers at this school are fairly paid.rJS8. An upgrade to the pay schedules for teachers is needed at this school.Professional Status Component (8 items)JS1. When I'm at work in this school, the time generally goes by quickly.JS7. Even if I could make more money at another school, I am satisfied here because of the working conditions.JS3. There is no doubt whatever in my mind that what I do on my job is really important.JS11. I am satisfied with the types of activities that I do on my job.rJS18. What I do on my job doesn't add up to anything really significant.JS13. It makes me proud to talk to other people about what I do at my job.JS15. If I had the decision to make all over again, I would still go into teaching.Autonomy Component (4 items)rJS24. I sometimes feel that I have too many bosses who tell me conflicting things.rJS26. In my work, my supervisors make all the decisions, and I have little direct control over my own work.rJS4. I am sometimes required to do things on my job that are against my better professional judgment. JS28. I have the freedom in my work to make important decisions as I see fit, and can count on my supervisors to back me up.Administration Component (8 items)rJS16. There is a great gap between the administration of this school and the daily problems of the teaching staff.JS5. There are plenty of opportunities for the advancement of the teaching staff at this school.JS17. There is ample opportunity for the teaching staff to participate in the administrative decision making process.JS2. There is no doubt that this school cares a good deal about the welfare of its employees, teaching staff included.rJS21. I have the feeling that this school in general—and my service too—is not organized with the needs of the students given top priority.JS25. I'm generally satisfied with the way educational practices are organized and accomplished at this school.JS19. I have all the input I want in planning policies and procedures for this school and my work.JS12. The administrators generally consult with the staff on daily problems and procedures.Task Requirements Component (3 items)rJS29. I think I could do a better job if I didn't have so much to do all the time.JS27. I have plenty of time and opportunity to discuss students' problems with other teaching staffs. rJS10. I could deliver a much better education if I had more time with each student.Interaction Component (4 items)JS30. The teaching staff doesn’t hesitate to pitch in and help one another out when things are rushed.JS9. There is a good deal of teamwork and cooperation between various levels of the teaching staff.rJS14. The teaching staff is not as friendly and outgoing as I would like.JS23. There is a lot of "rank consciousness" in my school, and the teaching staff seldom mingles with others of lower ranks.