-
Paper Information
- Paper Submission
-
Journal Information
- About This Journal
- Editorial Board
- Current Issue
- Archive
- Author Guidelines
- Contact Us
Nanoscience and Nanotechnology
p-ISSN: 2163-257X e-ISSN: 2163-2588
2024; 13(1): 1-9
doi:10.5923/j.nn.20241301.01
Received: Apr. 15, 2024; Accepted: May 3, 2024; Published: May 13, 2024

Effects of Different Zn Doping Concentration on the Optical and Structural Properties of TiO2 Nanoparticles
 Abstract
 Reference
 Full-Text PDF
 Full-text HTML
Gakuru Simon Waweru, Sharon Kiprotich, Peter Waithaka
Department of Physical and Biological Sciences, Murang’a University of Technology, Murang’a, Kenya
Correspondence to: Sharon Kiprotich, Department of Physical and Biological Sciences, Murang’a University of Technology, Murang’a, Kenya.
| Email: |  |
Copyright © 2024 The Author(s). Published by Scientific & Academic Publishing.
This work is licensed under the Creative Commons Attribution International License (CC BY).
http://creativecommons.org/licenses/by/4.0/

Zn-doped TiO2 nanoparticles (Z-T NPs) were successfully synthesized using the sol-gel method. Titanium isopropoxide, ethanol, and diethanolamine were used in the ratio of 1:6:1 as the metal precursor, solvent precursor, and refluxing agent, respectively. The Z-T NPs were characterized using Fourier Transform Infrared (FTIR), X-ray Diffraction (XRD), Scanning Electron Microscope (SEM), and UV-Vis reflectance spectroscopy. FTIR analysis showed vibrations in the fingerprint region at wave number 668 cm-1, which were attributed to the Zn-O stretching vibration, and at wave number 1033 cm-1 for Ti-O-Zn asymmetrical stretching vibration. XRD analysis of the 0% Z-T NPs showed the formation of the anatase phase with the plane (200) as the preferred orientation. An increase of Zn % mol caused planes (105) and (211) to convolve. Debye-Scherer equation showed crystallite size decreased when the Zn dopants were introduced; 10% had the smallest crystallite size and 5% had the largest crystallite size. The crystallite size was inversely proportional to Specific Surface Area, Dislocation density, and Full Width at Half Maximum. SEM images indicated improved crystal structure with increased sintering, aggregation, and agglomeration. EDS endorsed the doping process by having Zn atoms in the doped Z-T NPs. The optical analysis showed an increase in band gap energy from 4.43 to 5.14 eV for 0% and 3% Z–T NPs, respectively.
Keywords: Z-T NPs, Doping, Crystallite size, Band gap, Sol-gel method
Cite this paper: Gakuru Simon Waweru, Sharon Kiprotich, Peter Waithaka, Effects of Different Zn Doping Concentration on the Optical and Structural Properties of TiO2 Nanoparticles, Nanoscience and Nanotechnology, Vol. 13 No. 1, 2024, pp. 1-9. doi: 10.5923/j.nn.20241301.01.
Article Outline
1. Introduction
- The Dye-sensitized solar cell (DSSC) TiO2-based photoanode is a promising 3rd generation photovoltaic cell. They are in the limelight for a prospective greener energy source due to their low cost and simple manufacturing method, flexibility, environmentally friendly and comparatively high efficiency of 12.3% [1-5]; other converters of light include hybrid perovskite [6], p-n junction [7], and silicon-based solar cells [8]. Recently, studies have been oriented toward enhancing greener energy conversion by improving DSSCs' main components: the nanocrystal photoanode, dye, counter cathode electrode, and electrolyte [9]. However, the efficiency solely lies in the capacity of the photoactive nanocrystal electrode to harvest light and transport photoelectrons that are injected from the photo-excited dye of the semiconductor at the conduction band [10].Titanium dioxide (TiO2) is a polymorph with the rutile, anatase, and brookite phases [11]. When used as a photoanode, the anatase is more efficient than rutile phase in triggering reactions under solar illumination [12]. However, its relatively high band gap of 3.2 eV falls in the Ultra Violet region of the solar spectrum and in the abundantly visible spectrum, TiO2 is transparent and has a high electron/ hole (e-/h+) recombination rate; electrons recombine with holes when they encounter each in the presence of suitable electron acceptor or recombination centers, releasing energy in the form of light or heat hindering its commercial use [11].Studies to improve the efficiency and performance of TiO2 as a semiconductor, have been to lower its band gap. It can be achieved through doping with foreign atoms. Doping has been found to modify the crystal structure, conductivity, band position, and change surface state by introducing intermediate energy levels that enhance electron transition with low excitation energy [13]; they include Al3+, Cu2+, Mn2+, Fe3+, and Zn2+.Zn can easily fit into the crystal structure of Ti due to its similar ionic radius of 0.74 Å to 0.75 Å for Zn2+ and Ti4+, respectively [14]. Incorporation of Zn2+ into the TiO2 host will lead to a significant increase in photoelectric properties since the number of valence electrons of Zn2+ is lower than Ti4+; the excess of the hole can create an acceptor band near that of the TiO2 [15]. Jin, E M. et al. [16] reported a longer recombination time of 2.338 × 10⁻² s and a shorter electron transport time of 3.423× 10⁻² s were observed for 3 mmol Zn doped TiO2. Meesombad K et al. [17] reported a single phase of Zn-doped TiO2 was present at doping amounts of 2.5, 5, and 10% and 2.5 mol % Zn was the potential candidate for glutamate-sensing application. Dubey, R S. et al. [18] reported a 34% conversion efficiency of DSSC for Zn-doped TiO2 samples. Rajaramanan T et al. [19] reported a significant enhancement in power conversion efficiency was observed with 1.0 mol % Zn-doped TiO2-based DSSC with 35% efficiency greater than the control. Sharafi M et al. [20] reported that the efficiency of Perovskite solar cells increased by doping 2 mol % Zinc to the mesoporoustitania electron transport layer from 9.74% to 13.76%.TiO2 doped with Zn2+ ions has led to improved electron transfer, improving the efficiency of DSSC; however, a comprehensive study of the optimum amount and effect of high doping levels of Zn on TiO2 has not yet been thoroughly investigated and reported. Investigating the effects of (1, 2, 3, 5, 7, 9, and 10%) Zn-doped TiO2 will significantly improve the existing applications and form a basis for unlocking other possible applications. Sol-gel was preferred due to its excellent output of compounds with similar molecular structures, relatively cheap, its easiness of operation; one may use different solvents or metal precursors, and, more importantly, crystal or powder formed is pure, fine, and of uniform size [21].
2. Methodology
2.1. Materials
- The following materials were used in the synthesis process: tetra isopropoxide (TTIP, > 99.90%), absolute ethanol (> 99.90%), and diethanolamine (> 99.3%), all purchased from Sigma-Adrich. Ammonium hydroxide, Hydrochloric acid, and Zinc (ii) nitrate (> 96%) were purchased from A.B.Chem.Co., Ltd. All reagents were used as supplied by the manufacturer.
2.2. Synthesis of Z-T and T NPs
- A 30 mL mixture of TTIP and ethanol in a 1:6 volume ratio was added in a 50 mL glass beaker placed on a magnetic stirrer at room temperature and stirred for 30 min. With a pH meter, its pH was dropped to 7 using a stock solution of HCl or NH4OH and stirred for 10 min. Various dopant amounts of Zinc Nitrate (Zn(NO3)3) were added separately to the sol and stirred for 15 min. After that, they were transferred to a hot magnetic stirrer at 78°C, and 6 mL of diethanolamine added dropwise and stirred for 30 min where a gel would have formed. A white precipitate would appear after stirring for the first 5 min and when placed in a hot magnetic plate, it dissolved. The gel was left to age for at least 12 h before annealing in a muffle furnace for 2h. The un-doped T NPs were synthesized using the above procedure without adding the dopant (Zn(NO3)3). The aged gel was annealed in a muffle furnace at 500°C for 2h to give uniform nanoparticles of TiO2 in the anatase phase.
2.3. Characterization of the Samples
- Fourier Transform Infrared spectrophotometer IR Spirit Shimadzu model was used to analyze the chemical composition by showing the functional group vibrations of the synthesized Z-T NPs. X-ray diffraction (XRD) data were collected using ARL EQUINOX 100 at 40 V, 0.9 mA, CuKα radiation (𝛌= 1.5406 Å) and a scanning range of 20°-100° to obtain the crystal structure and the phase of the synthesized % mol Z-T NPs. Surface morphology and composition of the Z-T NPs were analyzed using the Phenom XL G2 Scanning Electron Microscope. A double-beam UV-Vis 1800 Shimadzu model was used to analyze optical properties at a wavelength ranging from 200 nm to 1100 nm at a fast scanning speed; the Tauc equation was employed in the optical analysis.
3. Results and Discussion
3.1. FTIR Analysis
- The presence of intra-molecular and inter–molecular interactions, molecular geometry, and functional groups present in Z-T NPs was provided by a Fourier Transform Infrared Spectroscopy (FTIR). FTIR has two types of vibration: stretching and bending vibration. Stretching vibration is classified into symmetrical and anti-symmetrical and occurs when the interatomic distance continuously changes along the bond axis bond between two atoms. The vibration is called bending vibration when there is a change in the angle between two bonds. Bending vibrations occur in the same plane for which we can have wagging, scissoring, twisting, or rocking vibrations [22]. Figure 1 shows the FTIR spectra of the different % Z-T NPs annealed at 500°C, showing main bands at fingerprint region (< 1500 cm-1) that are 668 cm-1 and 1033 cm-1 and functional group region (> 1500 cm-1) at wave number 2360 cm-1. The symmetric stretching and scissoring bending vibration at wave number 668 cm-1 is assigned to the Zn-O stretching mode. This vibration is absent at 0% but present at 1% Z-T NPs. It confirms that Zn atoms introduced new intermolecular interactions and functional groups that can be detected at that wave number. When T NPs were annealed at different temperature, the vibration was assigned to Ti-O-Ti. It was absent at temperature below 500°C and present at and above 600°C, where its vibration intensity increased as the annealing temperature was increased [23]. The anti-symmetric stretching vibration and a twist bending at wave number 1033 cm-1 are assigned to the Ti-O-Zn stretching mode. In our study on the effects of growth temperature on TiO2 NPs, the vibration at wave number 1033 cm-1 was assigned to Ti-O-Ti: a symmetric stretching and scissoring bending vibration [23]. It confirms that the Zn atoms are incorporated and fill in the positions of Ti atoms in the crystal and do not form a new separate compound. The difference in the two stretching vibration modes, that is, symmetric for un-doped and anti-symmetric for doped, is associated with introducing different bonding angles from the different ionic bonds of the dopant and host, making it have a twist bending vibration. The anti-symmetrical vibrations caused a wagging bending vibration that occurred at 5% doping and above as characterized by the different orientation for 1, 2, and 3% Z- T NPs to that of 5, 7, 9, and 10% Z-T NPs; the difference is of 180° to each other. It emanated from the rotation of the Zn and Ti atoms and different weight distribution in the lattice, which caused a twisting and rocking motion of atoms in the crystal. The stretching at wavenumber 2360 cm-1 is assigned to –OH from the solvent precursor ethanol and the refluxing agent diethanolamine forming Ti-OH.
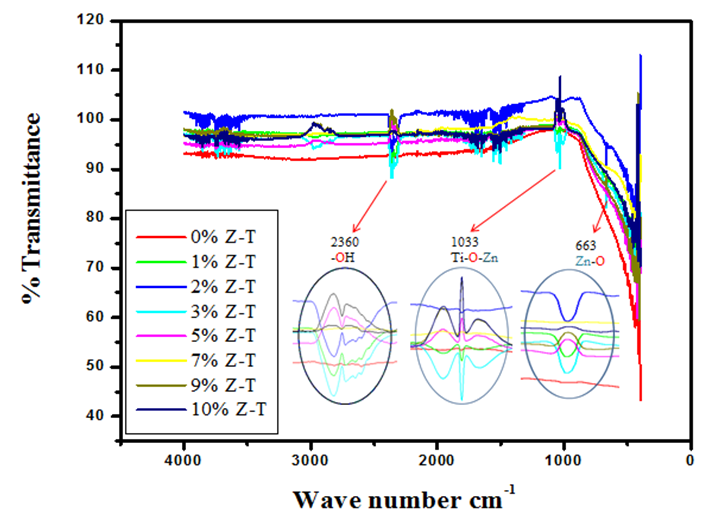 | Figure 1. FTIR spectra on the effect of different Zn-doped concentrations on the functional groups of TiO2 NPs |
3.2. XRD analysis
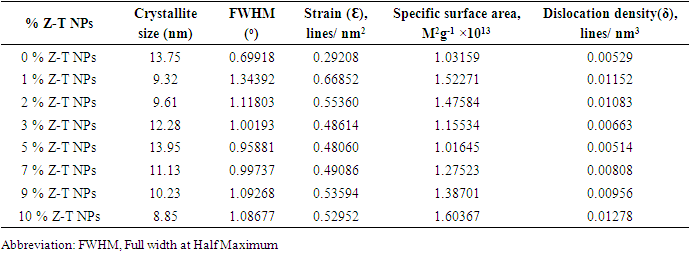
- Figure 2 shows the XRD diffraction patterns of different % Z-T NPs samples annealed at 500°C. The 2 θ (37.9, 48.0, 53.8, 54.8, 62.0, 68.8, 70.0, and 75.0) correspond to the reflection from 004, 200, 105, 211, 204, 116,220, 215 crystal planes of the tetragonal titanium dioxides structure. All diffraction peaks agreed with reported JCPDS card no 84- 1286 for anatase. Planes (105) and (211) are found to convolve and form one peak at 10 mol % doping. The two planes are close to each other therefore, when Zn atoms cause broadening of peaks, they convolve. The Z-T NPs preferred plane (200). It doesn’t change its position and intensity.
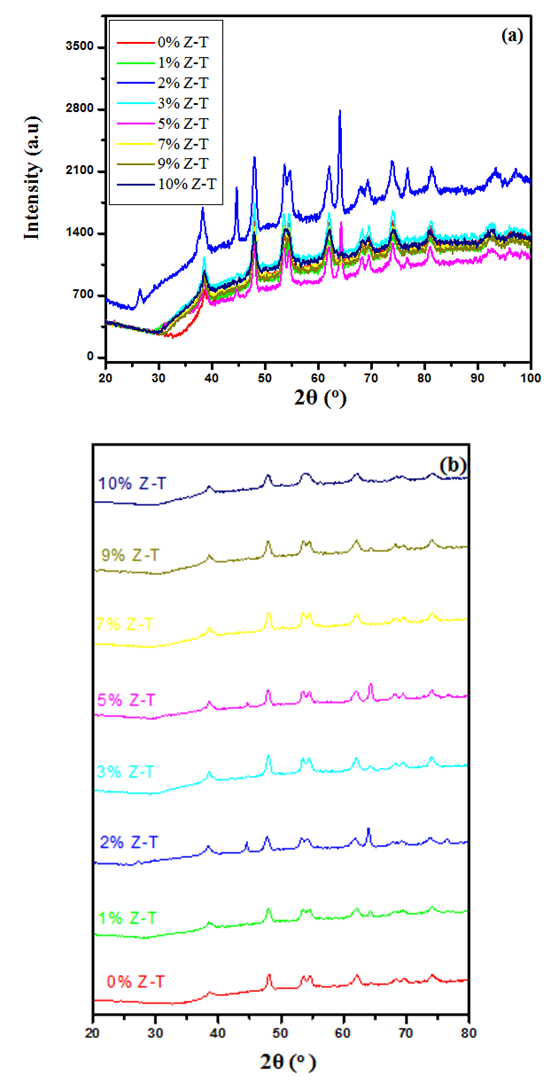 | Figure 2. X-ray diffraction patterns for (a) merge overlaid and (b) stacked graphs for different % Z-T NPs annealed at 500°C |
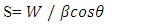
 | (1) |
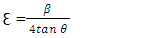
 | (2) |
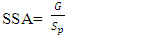
 | (3) |
 | (4) |
 | (5) |
 is the density of TiO2 NPs (4.23g/cm3) and Sp denoted the crystal size obtained by the Debye – Scherer equation
|
 | (6) |
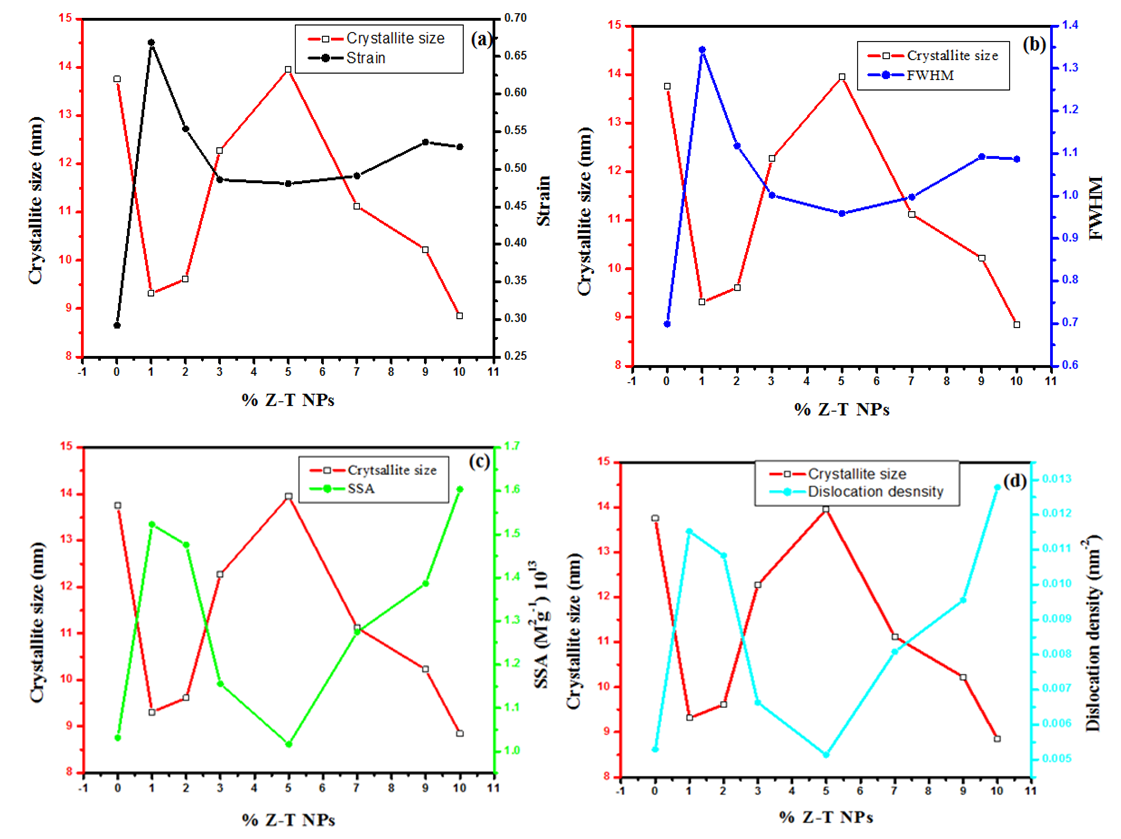 | Figure 3. Plot displaying comparison on the (a) Strain, (b) FWHM, (c) SSA, and (d) dislocation density with crystallite size of different % Z-T NPs |
3.3. Optical Analyses
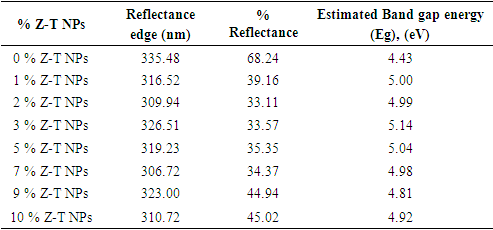
- The optical properties of the various % Z-T NPs were analyzed using a UV-Vis 1800 Shimadzu model. Figures 4 (a) and (b), show reflectance spectra and the estimated band gap for the different mol % Z-T NPs.Figure 4 (a) shows 2% Z-T NPs, with the lowest % reflectance of 33.11%, translating to the highest transmittance of 66.89%. The un-doped 0% Z-T NPs had the highest reflectance of 68.24%, as tabulated in Table 2. The band gap of a material defines its electronic condition.
|
 | (7) |
 | (8) |
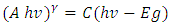
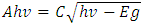
 versus hv plot on the hv axis was used to determine the average energy band gaps as shown in Figure 4 (b), [31,32].Optical band gap values were estimated by drawing a tangent of
  Tauc’s plot and extrapolating to the
  x axis, as shown in Figure 4 (b). The bulk band gap of T NPs for the anatase phase is 3.2 eV, the obtained values from the Tauc plot displayed greater optical values that are 4.43, 5.00, 4.99, 5.14, 5.04, 4.98, 4.81, and 4.92 for 0, 1, 2, 3, 5, 7, 9 and 10% Z-T NPs respectively. As tabulated in Table 2, the highest band gap was 3% Z-T NPs with an estimated value of 5.14eV, an increase of 0.69 from the 0% Z-T NPs. These discrepancies between the bulk and synthesized Z-T NPs occur due to quantum confinement effects where electrons are confined in three dimensions, leading to discrete energy levels, surface states, and defects attributed to high surface-to-volume ratio and size-dependent electronic properties where the energy levels of the conduction and valence bands shift influencing the overall band gap. Additionally, the decrease in the energy band gap observed can be attributed to the increase in the crystallite size of the Z-T NPs as reported by Kiprotich et al 2018 [33]. In their research, they reported a relationship where decrease in energy band gap was attributed to the enlargement of the NPs caused by the agglomeration of the particles.
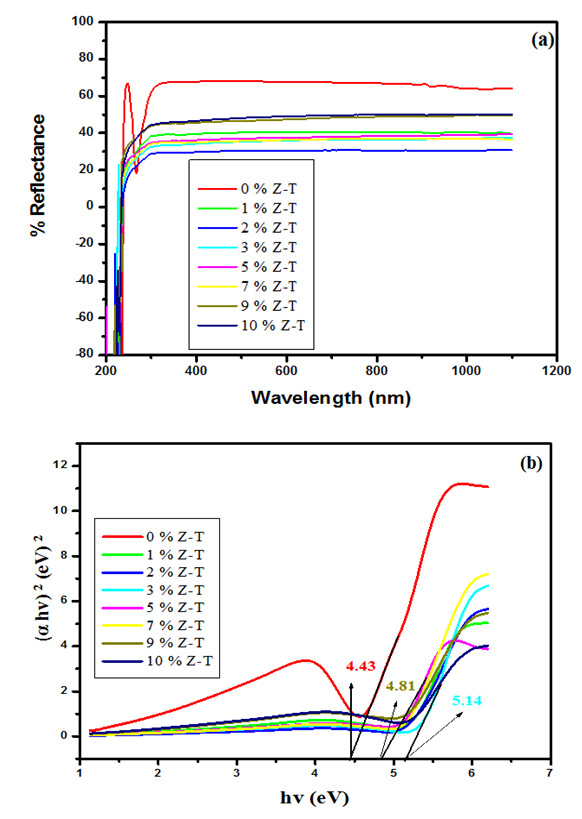 | Figure 4. Plot displaying (a) Reflectance spectra and (b) Estimated band gap for different mol% Z-T NPs |
3.4. Morphological Analysis
- Figures 5(a), (b), and (c) depict the SEM morphology of 3 representative samples that are 0, 5, and 10% Z-T NPs, respectively. The 5 and 10% F-T NPs images show a dense particle compared to the 0% F-T NPs. The porosity and rough texture present at 0% Z-T NPs are due to nucleation on primary particles of TiO2. The Z-T NPs samples are found to sinter; the surface deposits fuse to form a solid mass. The smooth surface and decreased porosity for 5 and 10% Z-T NPs lead to a more compact structure resulting from substitution and interstitial doping, as earlier confirmed by XRD and FTIR analysis. The increased particle size and formation of larger crystals for the doped samples result from increased agglomeration and aggregation, respectively, which further confirms doping helps improve the morphological properties of TiO2. Similar results were obtained by Kiprotich et. Al 2016 where the agglomerations observed were due to Ostwald ripening process where smaller particles dissolve to form larger particles [34]. The coalescing of the particles to form a single unified entity for the Z-T NPs samples is in line with the improvement and increased crystallite size shown by XRD analysis.
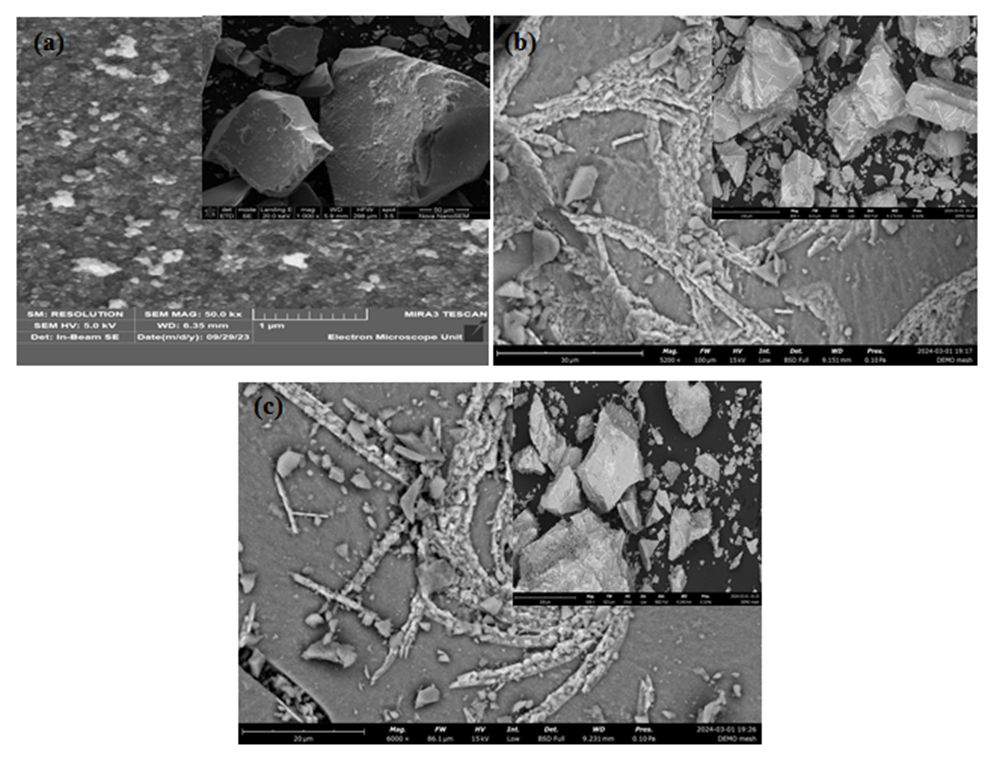 | Figure 5. SEM representative images for (a) 0, (b) 5 and (c) 10 % Z-T NPs |
|
|
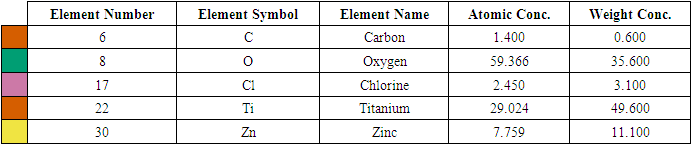
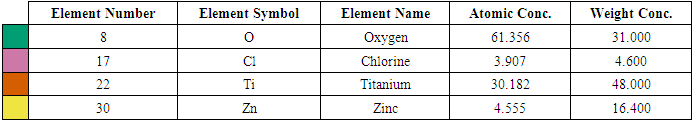
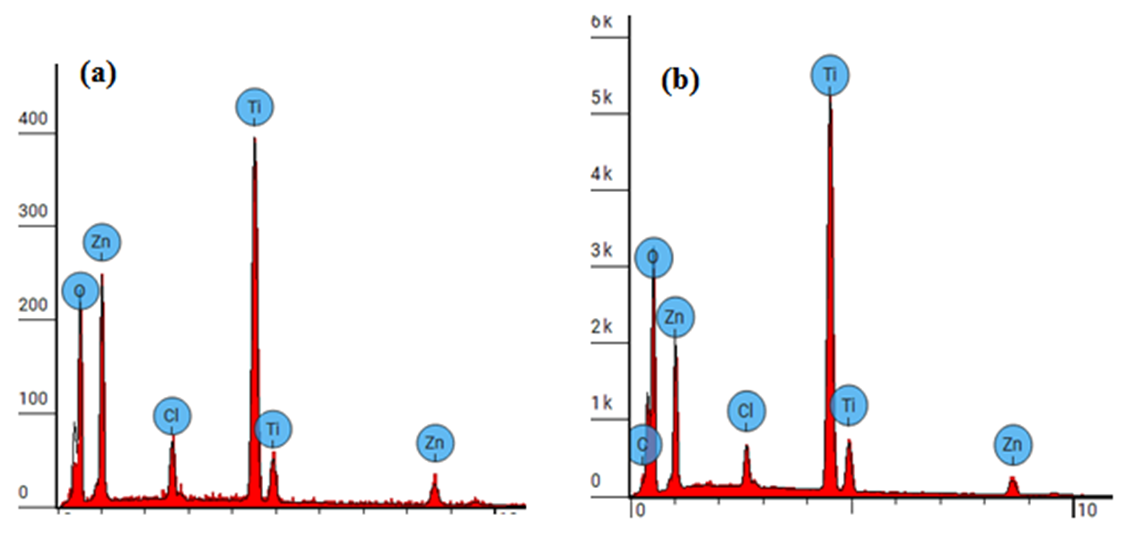 | Figure 6. EDS spectra for (a) 5 % Z-T NPs and (b) 10 % Z-T NPs |
4. Conclusions
- In the present study, the sol-gel method was successfully used to synthesized Z-T NPs. FTIR showed stretching vibration of Zn-O at wave number 668 cm-1, confirming substitution doping at 1% Z-T NPs. As a result of substitution doping, XRD analysis showed crystallite size decreased due to the development of strain. Strain values were almost twice for the 1% doped compared to the 0% Z-T NPs. The strain value was constant between 3, 5, and 7% Z-T NPs due to the popularity of the Zn atom in the structure leading to strain relaxation. Zn doping is appropriate for smaller crystallite sizes with 10% Z-T NPs having 8.85 nm, a decline of 4.9 nm. The optical band gap was high compared to the bulk value of 3.2 eV. It was attributed to the quantum effect; however, the Z-T NPs had a higher band gap than the T NPs. UV- Vis 1800 Shimadzu model requires the analyte to be dissolved in a suitable solvent; Z-T NPs could not fully dissolve in absolute ethanol, leading to the reported discrepancies. EDS showed the inclusion of Zn atoms, confirming that Zn2+ ions were successfully doped in the TiO2 crystal lattice. Therefore, the presence of Zn atoms in TiO2 will enhance acceptor bands, improving its electron transfer properties.
ACKNOWLEDGEMENTS
- This research was successful courtesy of the funding from DSA and Deep Learning Indaba through the African AI Research Grant.
Data Availability Statement
- All data generated or analyzed during this study are included in the manuscript.
Conflict of Interest
- The authors declare no conflict of interest.