Nanoscience and Nanotechnology

p-ISSN: 2163-257X    e-ISSN: 2163-2588

2017;  7(2): 38-47

doi:10.5923/j.nn.20170702.03


Green Reduction of Graphene Oxide Using Tea Leaves Extract with Applications to Lead Ions Removal from Water

Ahmed Ali Moosa, Jaafar Noori Jaafar

Department of Materials Engineering Technology, Engineering Technical College – Baghdad, Middle Technical University, Baghdad, Iraq

Correspondence to: Ahmed Ali Moosa, Department of Materials Engineering Technology, Engineering Technical College – Baghdad, Middle Technical University, Baghdad, Iraq.

Email:

Copyright © 2017 Scientific & Academic Publishing. All Rights Reserved.

This work is licensed under the Creative Commons Attribution International License (CC BY).
http://creativecommons.org/licenses/by/4.0/

Abstract

The synthesis of graphene which is one atomic thick sheet of carbon in large scale production, low cost and eco-friendly method is a big challenge today. The reduction of Graphene Oxide (GO) is the most important step in the chemical method and it is generally achieved by strong, hazardous and highly toxic chemicals. In this research, the black tea leaves extract was used as a green reducing agent for reduction of GO instead of using chemicals. The GO was prepared based on Hummers method and then treated with black tea leaves extract. The effect of treatment time and concentration of tea extract were studied. The GO and rGO were characterized by UV-visible spectroscopy, X-ray diffraction (XRD), Fourier transform infrared (FTIR) spectroscopy and atomic force microscopy (AFM) analysis.

Keywords: Graphene, Graphene Oxide (GO), Oxidation, Reduction, Tea

Cite this paper: Ahmed Ali Moosa, Jaafar Noori Jaafar, Green Reduction of Graphene Oxide Using Tea Leaves Extract with Applications to Lead Ions Removal from Water, Nanoscience and Nanotechnology, Vol. 7 No. 2, 2017, pp. 38-47. doi: 10.5923/j.nn.20170702.03.

1. Introduction

Graphene is one atomic thick sheet of carbon atoms of sp2-bonded carbon atoms containing hexagonal lattice arrays. Graphene is known as the thinnest, lightest and very strong material. The profound application of graphene is due to its high surface area, chemical stability, and excellent electrical, thermal and mechanical properties (Geim, 2009) [1]. The applications of graphene include: biosensors (Pumera et al., 2011) [2], drug delivery (Liu et al., 2013) [3], water purification (Cohen-Tanugi, 2012) [4] and nanocomposites (A. Moosa et al., 2015) [5], (A. A. Moosa et al., 2016) [6] and (A.A. Moosa et al., 2017) [7].
The demand of graphene for its industrial applications mainly depends upon the availability of economical, efficient and feasible method that allow the preparing of graphene on large scale (Thakur et al., 2015) [8]. Several methods are used to prepared graphene. The first method is micromechanical exfoliation of graphite to obtain graphene sheets or some time called Scotch tape which can provide high quality graphene crystal but is not suitable for large scale production (Novoselov et al., 2004) [9]. The other methods include: chemical vapor deposition (Reina et al., 2009) [10], chemical reduction of graphene oxide (GO) that derived from exfoliated graphite (Stankovich et al., 2007) [11] and epitaxial growth (Huang et al., 2008) [12].
The reduction of GO can be thermal (McAllister et al., 2007) [13], electrochemical (Ambrosi and Pumera, 2013) [14] or chemical (Stankovich et al., 2007) [11] to produced reduced graphene oxide (rGO). Chemical reduction is considered a promising approach for the mass production of graphene because it is economical, low demand for equipment and simple process (Stankovich et al., 2007) [11]. In this method, graphite is oxidize to graphene oxide (GO) followed by reduction of GO to graphene using strong reducing agent. Various reducing agents were reported for the reduction of GO such as hydrazine (Park and Ruoff, 2009) [15] and sodium hydride (Mohanty et al., 2010) [16].
These reducing chemicals are highly toxic, hazardous and may introduce impurities to the reduced graphene oxide (rGO) which is harmful to the environment and has adverse effect on its biological applications (Wang et al., 2017) [17].
To solve these problem, green reduction method was developed to reduce graphene oxide into rGO using an environmentally friendly, nontoxic green reductant. These green reductant such as: Green Tea (Wang et al., 2011) [18] Glucose (Akhavanet et al., 2012) [19], Vitamin C (Zhang et al., 2010) [20], wild carrot root (Kuila et al., 2010) [21] and bacteria (Salas et al., 2010) [22].
In this study, green reductant which is tea leaves extract was used as an environmental friendly to overcome the toxicity from chemical reduction process of graphene oxide to reduced graphen oxide.
The aim of this work is to prepare graphene oxide using Hummer Method and to develop an easy, feasible and inexpensive method for washing and filtration. The other aim is to use plant extract as a low cost and ecofriendly environmental approach to reduce graphene oxide (GO) into reduced graphen oxide (rGO) instead of toxic chemical reductants. The extract from tea leaves will be used in this work as a natural reductant. The reduction parameters will be investigated. UV-visible spectroscopy, X-Ray Diffraction (XRD), AFM and FTIR analysis will be used for characterization.

2. Materials and Experimental

Graphite powder (99.8%, Sigma), sodium nitrate (NaNo3, 99.9%, Merck), potassium permanganate (KMnO4, 99%, Merck), concentrated sulphuric acid (H2SO4, 98%, CDH), hydrochloric acid (HCl, 37%, CDH), hydrogen peroxide (H2O2, 30%, CDH) and black tea leaves (from local market).

2.1. Graphene Oxide (GO) Preparation

Graphene oxide was prepared abased on Hummers method (Hummer et al., 1958) [23]. The graphite (5 g) and NaNo3 (2.5 g) were mixed with concentrated H2So4 (115 ml) and stirred for 30 min by magnetic stirrer. Then, the potassium permanganate (15 g) was added slowly to the mixture in 15-20 min time period with continuous stirring in an ice bath at temperature (0 – 10°C) to avoid the rapid increase in temperature. The mixture was then transferred to water bath at temperature (35 - 40°C) and stirred for 30 min. Distilled water (230 ml) was then added slowly with stirring. The mixture was then transferred to water bath at 98°C and stirred for 15 min. A 700 ml of distilled water was added to the mixture with stirring. The reaction was then terminated by adding 50 ml hydrogen peroxide (H2O2 30%) and the mixture was stirring for 1 hr.
Several washing steps are required to remove impurities and oxidizing agents from the prepared graphite oxide prior to the exfoliation. Using conventional methods of washing such as filtration (Marcano et al., 2010) [24] and centrifugation (Becerril et al., 2008) [25] is a real tough task and expensive. The washing and filtration processes are extremely time-consuming because graphite oxide particles rapidly clog the filter pores. The high-speed centrifuge process is very costly and with limited capacity (Abdolhosseinzadeh et al., 2015) [26].
In this research a new washing process for preparation of graphite oxide was used of using filtration or centrifugation processes. After the termination of graphite oxidation reaction by hydrogen peroxide (H2O2 30%), the solution was left for 24 hrs to settle down. Then, water was drawn out and the precipitated was left at the bottom of the beaker. Two liters of distilled water was added to graphite oxide precipitate and was left for 24 hrs to settle down. Then, the water was drawn out and the precipitate was dried at 50°C. The dry graphite oxide was then ground using home coffee grinder. The graphite oxide powder was then washed with 100 ml dilute HCl (10% by volume) and vacuum filtered. The dry acid washed graphite oxide was then washed by distilled water and vacuum filtered. This water washed graphite oxide is very sticky which is very difficult to be vacuum filtered. The graphite oxide was then dispersed in 4 liters distilled water and left for 48 hrs. The water was then drawn out and the precipitate was then dried in an oven at 50°C for two days. To obtain graphene oxide, the graphite oxide powder was dispersed in distilled water (0.5 mg /ml) and then ultra-sonication in ultrasonic water bath for 1 hr. The solution obtained is graphene oxide.

2.2. Preparation of Black Tea Leaves Extract

The black tea leaves used in this work was bought from local market to be used in tea extract preparation. Different weight of dried tea leaves (2, 5, 7 and 10) gm were boiled with 100 ml of distilled water at 90°C for 15 minute in 500 ml flask under reflux condition to obtained tea leaves extract. The prepared solution was filtered to obtained tea leaves extract.
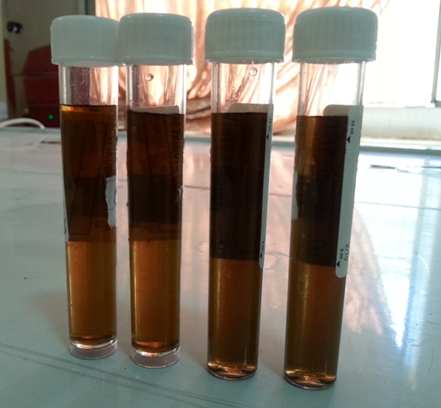
Figure 1. Graphene oxide (GO) solution
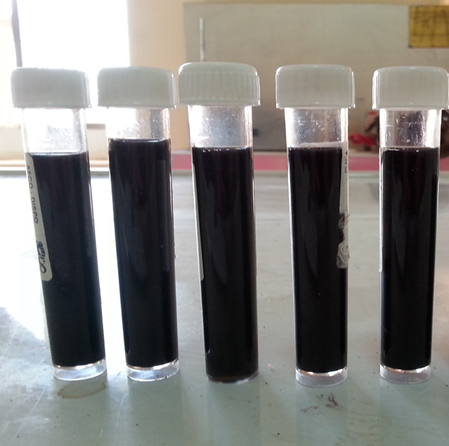
Figure 2. Reduced graphene oxide (rGO)

2.3. Reduction of GO with Tea Leaves Extract

The graphene oxide solution (0.5 mg/ml) (yellow brown color as show in Figure 1) was mixed with tea leaves extract solution (2, 5, 7 and 10%) in a ratio of 1:1 (volume ratio) in 500 ml flask and the mixture was then heated to 90°C using water bath to get homogeneous heating under reflux condition for 1 hour. After about 15 minute of heating, the color starts to change gradually from brown to black which indicates the start of graphene oxide reduction. After the reduction is completed, the color become dark black (as show in Figure 2) and this indicates the reduction of graphene oxide and the formation reduced graphene oxide (rGO).

2.4. Effect of Reflux Time on the Reduction of GO

Graphene oxide solution (0.5 mg/ml) mixed with tea extract solution (5%) in the ratio 1:1 (volume ratio) in 500 ml flask and heated to 90°C by using water bath under reflux condition for (0.5, 1, 1.5 and 2) hrs.
The reduced graphene oxide (rGO) with tea extract solution was centrifuged at 3000 r.p.m for 15 minute to separate the residual tea extract. The upper solution (residual tea extract) in the test tube was drawn out and the remaining precipitate at the bottom of tube was rGO. The rGO was then dispersed in distilled water and re-centrifuged, this process repeated three times to remove residual tea extract and any un-wanted materials. This is reduced graphene oxide (rGO).

2.5. Characterization

UV-visible spectra of GO and rGO samples were recorded by UV-visible spectrophotometer (Uv-160 A, Shimadzu Co., Japan). FTIR spectra of the samples were recorded by (IRTracer-100, Shimadzu Co., Japan). The AFM images recorded by (CSPM-5500, Karaltay (Beijing) Instruments Co. Ltd., China). XRD data was collected by X-ray diffractometer (MiniFlex II, Rigaku Co., Japan).

3. Results and Discussion

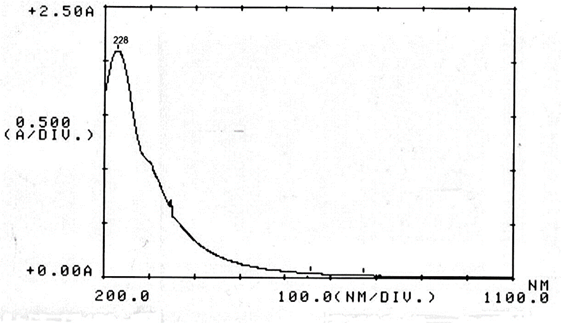
The UV-vis. Spectra of the prepared graphene oxide (GO) dispersed in distilled water was performed in quartz cuvettes using DI water as a reference solvent. Figure 3 shows the absorption peak at 228 nm, which correspond to the π→π* transition of C=C bonds (Zhou et al., 2009) [27].
Figure 3. UV-visible spectra of GO
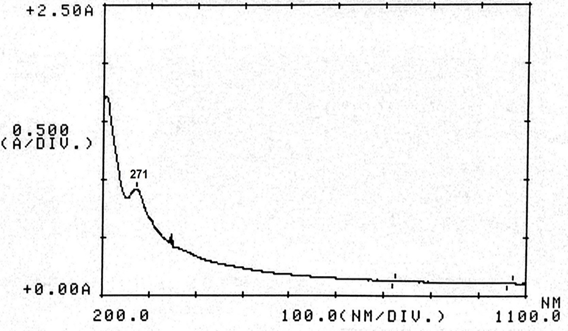
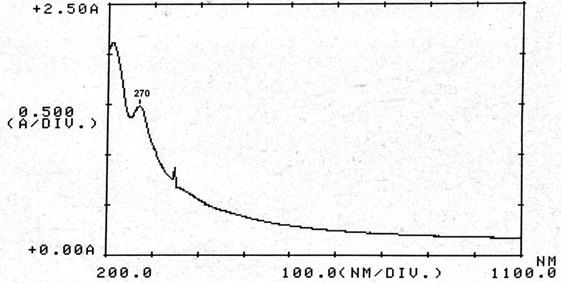
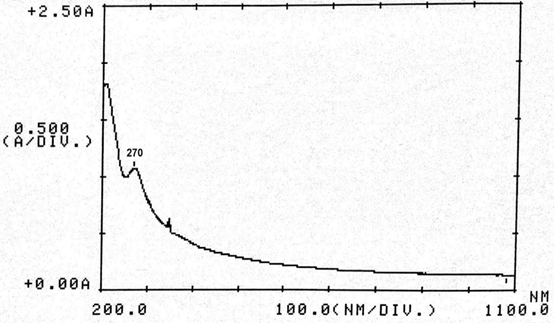
After reduction of GO by treatment with black tea leaves extract, the absorption peak shifted from 228 nm to 271 nm (Figure 5) due to removal of most of oxygen functional groups. The absorption peak for reduced GO had red shifted to 271 nm. This phenomenon of red shift has been used as a monitoring tool for the reduction of GO. During the reduction of GO, the colour of GO solution change from yellow brown to black after reduction. This is in agreement with the work of (Zhou et al., 2009) [27] where the black colour is the first indication of the reduction of graphene oxide (GO) and the formation of reduced graphene oxide (rGO).
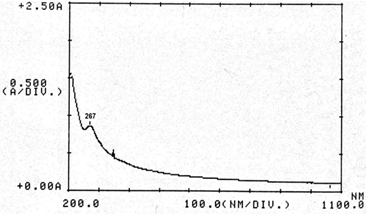
Figure 4. UV-Vis. Spectra of rGO treated with 2% tea extract for 1 hr
Figure 5. UV-Vis. Spectra of rGO treated at 5% tea extract for 1 hr
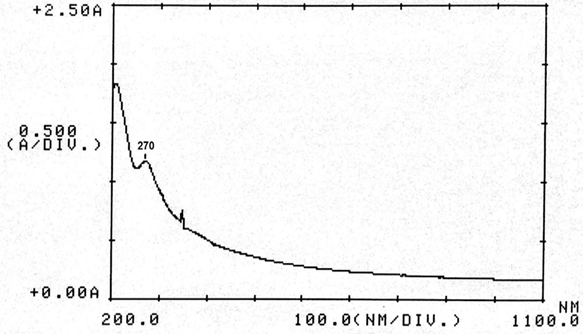
Figure 6. UV-Vis. Spectra of rGO treated at 7% tea extract for 1 hr
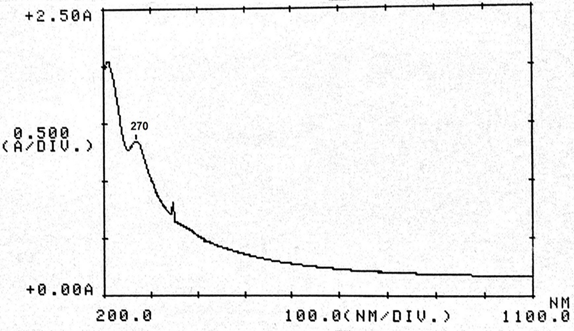
Figure 7. UV-Vis. Spectra of rGO treated at 10% tea extract for 1 hr
The effect of tea extract concentration on GO reduction was performed and characterized using UV-visible spectrophotometer. In this study, different tea extract concentration (2, 5, 7 and 10%) was used at constant time of 1 hr. At 2% tea extract, the reduced graphene oxide showed an absorption peak at 267 nm as show in Figure 4. At tea extract concentration of 5%, the absorption peak was shifted to 271 nm as shown in Figure 5. Increasing tea extract concentration resulted in an increase in GO reduction process. At tea extract concentration of 7% and 10% it was shown the absorption peak remains at 270 nm and no shift in the absorption peak above 270 was detected as show in Figures 6 and 7.
The shift in the absorption peak from 228 for GO to 271 nm for rGO indicates about ~43 nm red-shift relative to the absorption peak of the GO. This shift can be assigned to deoxygenation of the GO sheets and the restoration of the sp2 hybridized carbon network due to the removal of the oxygen bearing functional groups. This same shift was observed for the reduction of GO by curcumin (Hatamie et al., 2015) [28], m Cinnamon (Suresh et al., 2015) [29]. This suggests that 5% tea extract was the best extract concentration for GO reduction.
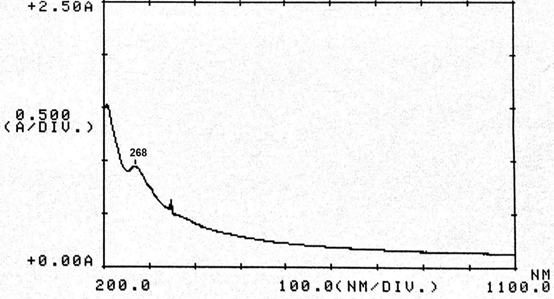
The effect of various treatment times (reflux time) on GO reduction was studied and the results were characterized by using UV-Visible Spectrophotometer. The graphene oxide (GO) was reduced by treatment with 5% tea extract for (0.5, 1, 1.5 and 2) hour(s). At treatment time of 30 minutes the UV-Visible spectra shows the absorption peak shifted to 268 nm as show in Figure 8, and at 1 hr treatment time the absorption peak shifted to 271 nm as show in Figure 5. At treatment time of 1.5 and 2 hrs the absorption peak remains at 270 nm, Figures 9 and 10. No increase in absorption is found after 1 hr, indicating completion of the within that period. This suggested that the best treatment time for GO reduction is 1 hr.
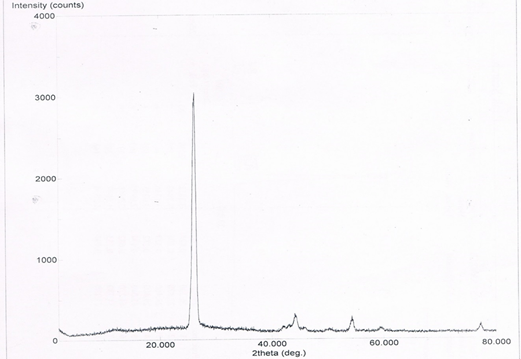
Figure 11 shows the XRD of graphite, the characteristic peak (002) at 2θ = ~ 26.3° correspond to an interlayer distance of 0.338 nm.
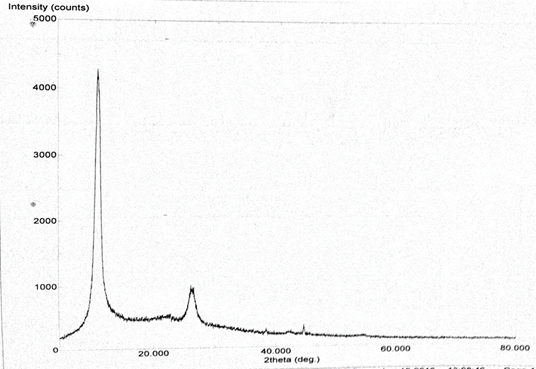
After oxidation of graphite into GO, the sharp peak of graphite disappears and new peak appears at 2θ ~11.16° corresponds to the (001) plane with interlayer distance of 0.79 nm, as show in Figure 12. The increase of interlayer spacing from 0.338 to 0.79 nm is due to the formation of oxygen functional groups on the inner and outer surfaces of bulk graphite during oxidation leading to the loose stack of GO sheets (Jana et al., 2014) [29].
The appearance of a small peak at ∼26.3° can be attributed to the presence of a few amounts of un-oxidized graphite in graphene oxide. The same results were reported by (Jana et al., 2014) [30] and (Suresh et al., 2015) [31].
Figure 8. UV-vis. Spectra of rGO treated with 5% tea extract for 30 min
Figure 9. UV-vis. Spectra of rGO treated with 5% tea extract for 1.5 hr
Figure 10. UV-vis. Spectra of rGO treated with 5% tea extract for 2 hrs
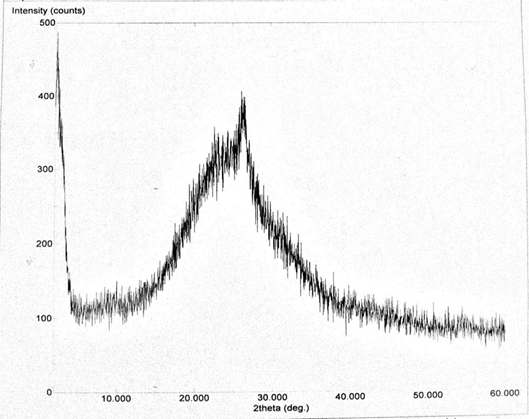
Figure 13 show the XRD of the reduced graphene oxide (GO) using tea leaves extract as green reducing agent at best concentration 5% and at reflux time 1 hr. The XRD peak of GO disappear and a new broad peak was observed at 2θ in the range ~ 23° – 26°. This broad peak indicates the formation of few layers of reduced graphene oxide (rGO) sheets. The 2θ peak in the range ~ 23° – 26° corresponds to interlayer distance of ~0.34 nm, which may be resulted from some restacked reduced graphene oxide (rGO) layers and formation of a few layers rGO. Thus, this interlayer spacing indicating the removal of oxygen functional groups (Jana et al., 2014) [30].
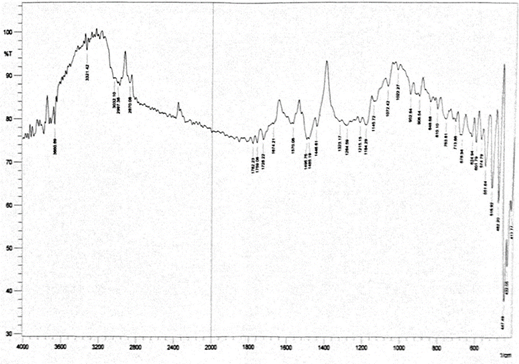
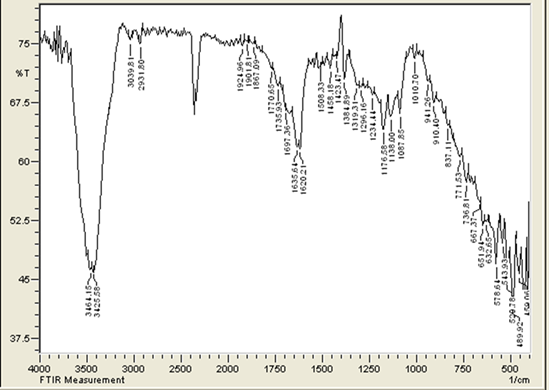
The FTIR spectrum of graphite shows no characteristic peak for the functional groups, as shown in Figure 14. After oxidation of graphite by an oxidizing agent, the graphene oxide (GO) exhibits different characteristic peaks, as show in Figure 15. These include a broad peak at 3425 cm-1 corresponding to the O-H stretching vibration from hydroxyl group. The C=O stretching peak appears at 2350 cm-1 of carboxyl group. Alkoxy stretching vibration exhibit at the peak 1176 cm-1, O-H deformation exhibit at the peaks 1300 – 1400 cm-1. The epoxy C-O group stretching vibration exhibit at small peak 1138 cm-1, the peak at 1630 cm-1 correspond to C=C (Gupta et al., 2013) [32].
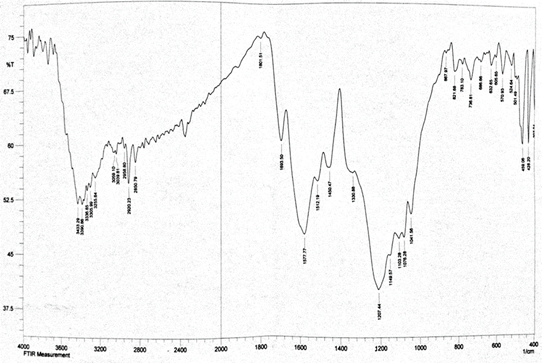
Figure 16 shows the FTIR of reduced graphene oxide (rGO) obtained by the reduction of the graphene oxide with tea leave extract as green reducing agent. The characteristic peaks of GO become weaker and some of them disappear completely. The O-H peak at 3425 cm-1 become weak, which was strong in GO, because of has been reduced by tea leave extract. The peak of C=O disappear. The appearance of new two small peaks at 2920 and 2850 cm-1 due to the presence of C-H stretching vibration. The peaks at 1693 and 1600 cm-1 attributed to C=C. The peak at 1207 cm-1 attributed to the C-O of epoxy group, because of not all oxygen functional groups have been removed, therefore named reduced graphene oxide (rGO). This indicate removal most of oxygen functional groups from graphene sheet (Wang et al., 2017) [17].
Figure 11. XRD of graphite
Figure 12. XRD of graphene oxide (GO)
Figure 13. XRD of reduced graphene oxide (rGO)
Figure 14. FTIR of graphite
Figure 15. FTIR of graphene oxide (GO)
Figure 16. FTIR of reduced graphene (rGO)
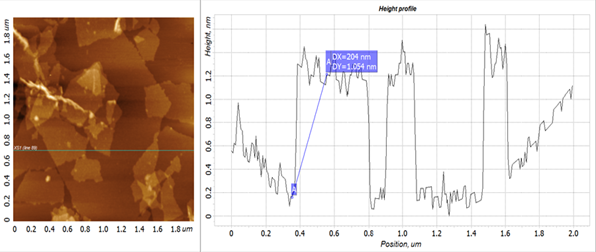
Figure 17. AFM of graphene oxide (GO)
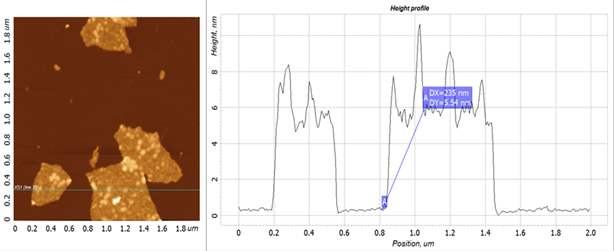
Figure 18. AFM of reduced graphene oxide (rGO)
The thickness measurement from AFM image of graphene oxide (GO) is shown in Figure 17. The thickness of graphene oxide (GO) has been determined to be 1.054 nm, indicating the formation of single layer graphene oxide (GO). This work from XRD of GO. These results are in agreement with the work of (Bo et al., 2014) [33] and (Fan et al., 2008) [34].
Figure 18 show the AFM image of reduced graphene oxide (rGO), The thickness of the reduced graphene oxide (rGO) sample has been determined to be 5.54, the increase in the thickness of reduced graphene oxide (rGO) sheets (as compared to the thickness of GO) due to attachment of tea molecules on both sides of the rGO sheets and may be due to restacking of rGO sheets.
This is in agreement with the results reported by other researchers. (Kulia et al., 2012) [21] reported the use of wild carrot as green approach for the reduction of graphene oxide (GO). They found that the thickness of carrot rGO increases to 2.5 nm, which is attributable to the tendency of graphene layers to restack in the absence of stabilizing molecules. (Hatamie et al., 2015) [28] used curcumin as a natural reductant material for green reduction of graphene oxide (GO) sheets. The thickness of the curcumin rGO sheets is ~1.5 nm. The increase in the thicknesses of the reduced sheets (as compared to the GO) was attributed to the attachment of curcumin molecules on both sides of the reduced graphene oxide (rGO) sheets.
Lead Ions Removal
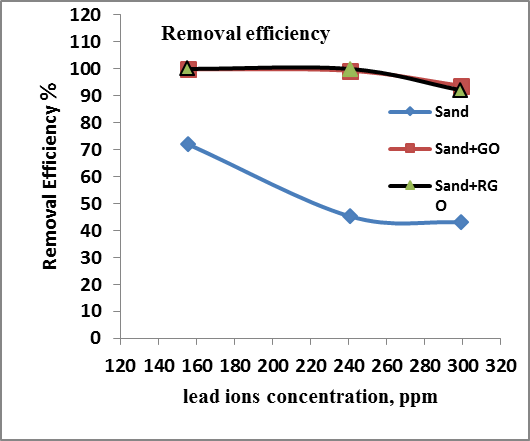
Three tests were performed using glass column to remove lead ions. The first test was done using river sand at different initial concentration of lead ions solution. The removal efficiency was calculated to be 72, 45.3 and 43% at lead ions solution concentration of 155.5, 240.5 and 299 ppm with pH 4.5 respectively. The removal efficiency decreases sharply with increasing the concentration of lead ions from 155.5 to 240.5 ppm and then slowly decreased as shown in Figure 19.
The second test was performed using glass column packed with river sand and GO. The removal efficiency was calculated to be 99.8, 99.2 and 93.7% at lead ions solution concentration of 155.5, 240.5 and 299 ppm with pH 4.5 respectively. Initially the removal efficiency is very high and changed slowly at concentration of lead ions from 155.5 to 240.5 ppm and then decreased sharply after that as shown in Figure 19.
The third was performed using column packed with river sand and rGO. The removal efficiency was calculated to be 99.9, 99.9 and 92% at lead ions solution concentration of 155.5, 240.5 and 299 ppm with pH 4.5 respectively. Initially the removal efficiency is very high and remain constant at concentration of lead ions from 155.5 to 240.5 ppm and then decreased sharply after that as shown in Figure 19.
From the above results, at lower initial concentration of lead ions, enough adsorption sites are available for adsorption of lead ions and show high removal efficiency. However, when increase the initial concentration of lead ions, the number of lead ions increase and the adsorption sites get saturated and the removal efficiency decreased. At higher metal ions concentration, the adsorbent capacity get exhausted because of non-availability of the surface sites (Meena et al, 2005) [35].
A comparison between different absorbents is shown in Figure 19 where the absorbents sand + GO and sand + rGO gives the best removal efficiency for lead ion. The removal of lead ions occurs by of adsorption mechanism by transfer of adsorbate from the solution to the external surface of the adsorbent by diffusion process. Then there is mass transfer from external surface of the adsorbent to inner surface of the porous structure. After that surface diffusion occurs along the porous surface followed by adsorption of the adsorbate on internal surface of pores of the active sites (Mandal 2014) [36].
Figure 19. Removal efficiency vs. lead ion concentration for lead removal using sand, sand + GO, sand + rGO

4. Conclusions

Graphene oxide (GO) was successfully prepared using Hummers method. XRD results of GO showed that the interlayer distance was increased to 0.79 nm compared with interlayer distance of graphite 0.338 nm. This indicates that successful penetration of oxygen functional groups between graphene layers as revealed by FTIR result of GO. The AFM image of GO showed the thickness of GO was 1.05 nm, this suggests the formation single layer GO. The black tea leaves extract was successfully used as green reducing agent for reduction of GO into reduced graphene oxide (rGO) and the FTIR result revealed the removal of most of oxygen functional groups from GO after reduction. The AFM image of rGO showed that the thickness was increased as compared with thickness of GO due to attachment of tea molecules on the both sides of graphene sheet and may be due to restacked of graphene layers.
The use of GO and rGO with sand showed high removal efficiency for lead ions in the aqueous solution. At higher lead ion concentration, the removal efficiency was decreased due to the saturation of adsorption sites with lead ions.

ACKNOWLEDGEMENTS

The authors would like to acknowledge the Engineering Technical College-Baghdad for their encouragement, help and their interest in my project.

References

[1]  A. K. Geim, Graphene: status and prospects, Science, 2009, Vol. 324, no. 5934, PP. 1530–1534.
[2]  M. Pumera, Graphene in biosensing, Materials today, 2011, Vol. 14, PP. 308–315.
[3]  J. Liu, L. Cui and D. Losic, Graphene and graphene oxide as new nanocarriers for drug delivery applications, 2013, Vol. 9, PP. 9243-9257.
[4]  D. Cohen-Tanugi and J. C. Grossman, Water Desalination across Nanoporous Graphene, Nano Letter, 2012, Vol. 12, PP. 3602-3608.
[5]  A. A. Moosa, A. Ramazani, and M. N. Ibrahim, Effects of carbon-nanotubes on the mechanical and electrical properties of epoxy nanocomposites, American Journal of Materials Science, 2016, Vol. 6, No.6 pp. 157-165.
[6]  A. A. Moosa, F. Kubba, M. Raad and A. Ramazani, Mechanical and thermal properties of graphene nanoplates and functionalized carbon-nanotubes hybrid epoxy nanocomposites, American Journal of Materials Science, 2016, Vol. 6, No. 5 pp. 125-134.
[7]  A. A. Moosa, A. Ramazani, F. Kubba, M. Raad, Synergetic effects of graphene and nonfunctionalized carbon nanotubes hybrid reinforced epoxy matrix on mechanical, thermal and wettability properties of nanocomposites, American Journal of Materials Science, 2017, Vol. 7, No. 1, PP. 1-11.
[8]  S. Thakur and N. Karak, Alternative methods and nature-based reagents for the reduction of graphene oxide: a review, Carbon, Vol. 94, 2015, PP. 224–242.
[9]  K. S. Novoselov, A. K.Geim, S. Morozov, D. Jiang, Y. Zhang, S. V. Dubonos, I. V. Grigorieva and A. A. Firsov, Electric field effect in atomically thin carbon films, Science, 2004, Vol. 306, No. 5696, PP. 666–669.
[10]  A. Reina, X. Jia, J. Ho, D. Nezich, H. Son, V. Bulovic, M.S. Dresselhaus and J. Kong, Large Area, few-layer graphene films on arbitrary substrates by chemical vapor deposition, Nano Letter, 2009, Vol. 9, PP. 30–35.
[11]  S. Stankovich, D. A. Dikin, R. D. Piner, K. A. Kohlhaas, A. Kleinhammes, Y. Jia, Y. Wu, S.T. Nguyen and R. S. Ruoff, Synthesis of graphene-based nano sheets via chemical reduction of exfoliated graphite oxide, Carbon, 2007, Vol. 45, PP. 1558–1565.
[12]  H. Huang, W. Chen, S. Chen and A. T. S. Wee, Bottom-up growth of epitaxial graphene on 6H-SiC(0001), ACS Nano, 2008, Vol. 2, PP. 2513–2518.
[13]  M. J. McAllister, J. L. Li, D. H. Adamson, H. C. Schniepp, A. A. Abdala, J. Liu, M. H. Alonso, D. L. Milius, R. Car, R. K. Prudhomme, and I. A. Aksay, Single sheet functionalized graphene by oxidation and thermal expansion of graphite, Chem. Mater., 2007, Vol. 19, PP. 4396–4404.
[14]  A. Ambrosi, and M. Pumera, Precise tuning of surface composition and electron‐transfer properties of graphene oxide films through electroreduction, Chemistry–A European Journal, 2013, Vol. 19, No. 15, PP. 4748-4753.
[15]  S. Park, R.S. Ruoff, Chemical methods for the production of graphenes, Nature Nanotechnology, 2009, Vol. 4, PP. 217–224.
[16]  N. Mohanty, A. Nagaraja, J. Armesto and V. Berry, High‐throughput, Ultrafast Synthesis of Solution‐dispersed Graphene via a Facile Hydride Chemistry, Small, 2010, Vol. 6, PP. 226–231.
[17]  J. Wang, E. C. Salihi, L. Siller, Green reduction of graphene oxide using alanine Materials Science and Engineering C, 2017, Vol. 72, PP. 1–6.
[18]  Y. Wang, Z. Shi, J. Yin, Facile synthesis of soluble graphene via a green reduction of graphene oxide in tea solution and its biocomposites, ACS Appl Mater Interfaces. 2011, Vol. 3, No (4), PP.1127-33.
[19]  O. Akhavan, E. Ghaderi, S. Aghayee, Y. Fereydooni and A. Talebia, The use of a glucose-reduced graphene oxide suspension for photothermal cancer therapy, Journal of Materials Chemistry, 2012, Vol. 22, PP.13773-13781.
[20]  J. Zhang, H. Yang, G. Shen, P. Cheng, J. Zhang and S. Guo, Reduction of graphene oxide via L-ascorbic acid, Chemcal Communication, 2010, Vol. 46, PP. 1112–1114.
[21]  T. Kuila, S. Bose, P. Khanra, A.K. Mishra, N.H. Kim and J.H. Lee, A green approach for the reduction of graphene oxide by wild carrot root, Carbon, 2010, Vol. 50, PP. 914–921.
[22]  E. C. Salas, Z. Sun, A. Luttge and J.M. Tour, Reduction of graphene oxide via bacterial respiration, ACS Nano, 2010, Vol.4, PP. 4852–4856.
[23]  W. S. Hummers and R. E. Offeman, Preparation of graphitic oxide, Journal of the American Chemical Society, Vol. 80, No. 6, PP. 1339, 1958.
[24]  D. C. Marcano, D. V. Kosynkin, J. M. Berlin, A. Sinitskii, Z. Sun, A. Slesarev, L. B. Alemany, W. Lu and J. M. Tour, Improved synthesis of graphene oxide, ACS Nano, 2010, Vol. 4, PP.4806–4814.
[25]  H. A. Becerril, J. Mao, Z. Liu, R. M. Stoltenberg, Z. Bao and Y. Chen, Evaluation of solution-processed reduced graphene oxide films as transparent conductors, ACS Nano, 2008, Vol. 2, PP. 463–470.
[26]  S. Abdolhosseinzadeh, H. Asgharzadeh and H. S. Kim, Fast and fully-scalable synthesis of reduced graphene oxide, 2015, Vol. 5, P. 10160.
[27]  Y. Zhou, Q. Bao, L. A. L. Tang, Y. Zhong, and K. P. Loh, Hydrothermal dehydration for the “Green” reduction of exfoliated graphene oxide to graphene and demonstration of tunable optical limiting properties, Chemistry of Material, 2009, Vol. 21, PP. 2950-2956.
[28]  S. Hatamie, O. Akhavan, S. K. Sadrnezhaad, M. M. Ahadian, M. M. Shirolkar and H. Q. Wang, Curcumin reduced graphene oxide sheets and their effects on human breast cancer cells, Materials Science and Engineering, 2015, Vol. 55, PP. 482–489.
[29]  D. Suresh, Udayabhanu, M.A. Pavan Kumar, H. Nagabhushana and S.C. Sharma, Cinnamon supported facile green reduction of graphene oxide, its dye elimination and antioxidant activities, Materials Letters, 2015, Vol. 151, PP. 93–95.
[30]  M. Jana, S. Saha, P. Khanra, N. C. Murmu, S. K. Srivastava, T. Kuila and J. H. Lee, Bio-reduction of graphene oxide using drained water from soaked mung beans (Phaseolus aureus L.) and its application as energy storage electrode material, Materials Science and Engineering B, 2014, Vol. 186, PP. 33-40.
[31]  D. Suresh, P.C. Nethravathi, Udayabhanu, H. Nagabhushana and S.C. Sharma, Spinach assisted green reduction of graphene oxide and its antioxidant and dye absorption properties, Ceramics International, 2015, Vol. 41, PP. 4810–4813.
[32]  R. K. Gupta, Z. A. Alahmed, F. Yakuphanoglu, Graphene oxide based low cost battery, Materials Letters, 2013, PP. 75–77.
[33]  Z. Bo, X. Shuai, S. Mao, H. Yang, J. Qian, J. Chen, J. Yan and K. Cen, Green preparation of reduced graphene oxide for sensing and energy storage applications, Scientific Reports, 2014, Vol. 4, P. 4684.
[34]  X. Fan, W. Peng, Y. Li, X. Li, S. Wang, G. Zhang, and F. Zhang, Deoxygenation of exfoliated graphite oxide under alkaline conditions: a green route to graphene preparation, Advanced Materials, 2008, Vol. 20, PP. 4490-4493.
[35]  A. K. Meena, G. K. Mishra, P. K. Rai, C. Rajagopal and P. N. Nagar, Removal of heavy metal ions from aqueous solutions using carbon aerogel as an adsorbent, Journal of Hazardous Materials B, 2005, Vol. 122, PP. 161 – 170.
[36]  N. K. Mandal, Performance of low-cost bio adsorbents for the removal of metal ions, International Journal of Science and Research, 2014, Vol. 3, PP. 70-74.