-
Paper Information
- Paper Submission
-
Journal Information
- About This Journal
- Editorial Board
- Current Issue
- Archive
- Author Guidelines
- Contact Us
Nanoscience and Nanotechnology
p-ISSN: 2163-257X e-ISSN: 2163-2588
2016; 6(4): 59-61
doi:10.5923/j.nn.20160604.01

Fe Doping Induced Shrinking of Band Gap of NiO Nanoparticles
 Abstract
 Reference
 Full-Text PDF
 Full-text HTML
1Department of Physics, North Orissa University, Baripada, Odisha, India
2Department of Physics, M.P.C. Autonomous College, Baripada, Odisha, India
Correspondence to: P. Mallick, Department of Physics, North Orissa University, Baripada, Odisha, India.
| Email: |  |
Copyright © 2016 Scientific & Academic Publishing. All Rights Reserved.
This work is licensed under the Creative Commons Attribution International License (CC BY).
http://creativecommons.org/licenses/by/4.0/

We synthesized Ni1-xFexO (x = 0, 0.01 and 0.02) nanoparticles by chemical co-precipitation method and studied the effect of Fe on the optical properties of NiO. UV-visible characterization of these samples indicated that the optical band gap of NiO decreased from 3.65 to 3.43 eV when the doping concentration increased from x = 0 to x = 0.02. Since NiO is a p-type material and the holes are expected to populate at the top of the valence band due to Fe doping which can cause the band gap shrinkage as is seen in our case. The refractive index and electron polarizability with Fe doping concentration in NiO have been determined from the optical band gap. Both refractive index and electron polarizability follow opposite trend as compared to the energy gap as a function of Fe doping concentration.
Keywords: Nanoparticle, NiO, Doping, Co-precipitation method, UV-Visible Spectroscopy
Cite this paper: P. Mallick, R. Biswal, Fe Doping Induced Shrinking of Band Gap of NiO Nanoparticles, Nanoscience and Nanotechnology, Vol. 6 No. 4, 2016, pp. 59-61. doi: 10.5923/j.nn.20160604.01.
Article Outline
1. Introduction
- Nanoscale transition metal oxides (TMOs) attracted much research attention due to their potential applications. Among the different well studied TMOs, NiO with rock salt structure is an attractive material well known for its chemical stability. NiO has shown its potentiality in wide range of technological applications such as gas sensor [1], p-type transparent conductor [2], electrochromic material for smart windows [3], resistive random access memory [4] etc. Doping with TM could change properties of NiO which can be useful for different applications. NiO nanoparticles exhibit room temperature ferromagnetism at the expense of parent antiferromagnetic property when doped with Fe [5-8]. Mn doping led to appearance of superparamagnetism [9] whereas Co doping retains the parent antiferromagnetic property in NiO [10]. Even slightly changing the synthesis conditions led to the appearance of superparamagnetic properties in place of ferromagnetism in Fe doped NiO [11].Change in optical band gap of NiO with doping has been reported [12-14]. Changing the band gap will affect different properties of material and these materials are necessary to build many technologically important devices [15]. In the present work, Ni1-xFexO (x = 0, 0.01 and 0.02) nanoparticles synthesized by chemical co-precipitation method and the effect of Fe on the band gap of NiO is studied.
2. Experimental Methods
- The Ni1-xFexO (x = 0, 0.01 and 0.02) nanoparticles synthesized by chemical co-precipitation method as described elsewhere [8]. The evolution of band gap, refractive index and electron polarizability in Ni1-xFexO samples were characterized by diffuse reflectance spectroscopy using an UV-Visible spectrophotometer (Simadzu, UV-2450) having an integrating sphere assembly.
3. Results and Discussion
- Figure 1 shows the variation of absorption coefficient (α) with photon energy (hv) for Ni1-xFexO (x = 0, 0.01 and 0.02) nanoparticles synthesized by chemical co-precipitation method. As indicated from the Fig. 1, the absorption intensity for all samples increased with increasing energy due to nanocrystalline nature of the material [16]. The evolution of optical band gap (Eg) of NiO with Fe doping can be extracted from the α using the following relation [17]:
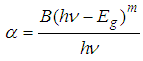 | (1) |
 vs. hv plot to
  The linear relation observed for (αhv)2 vs. hv plot (Fig. 2) indicated that the Ni1-xFexO nanoparticles exhibit direct allowed transition as was seen for NiO nanostructures [19].
 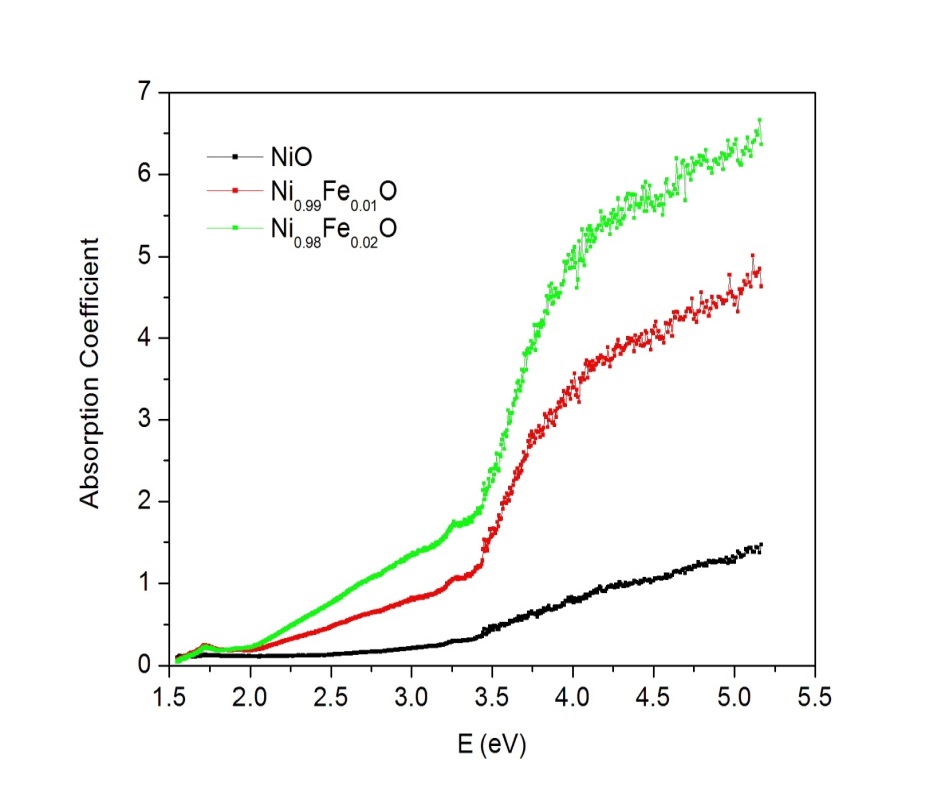 | Figure 1. Variation of absorption coefficient (α) with photon energy (hv) for Ni1-xFexO (x = 0, 0.01 and 0.02) nanoparticles |
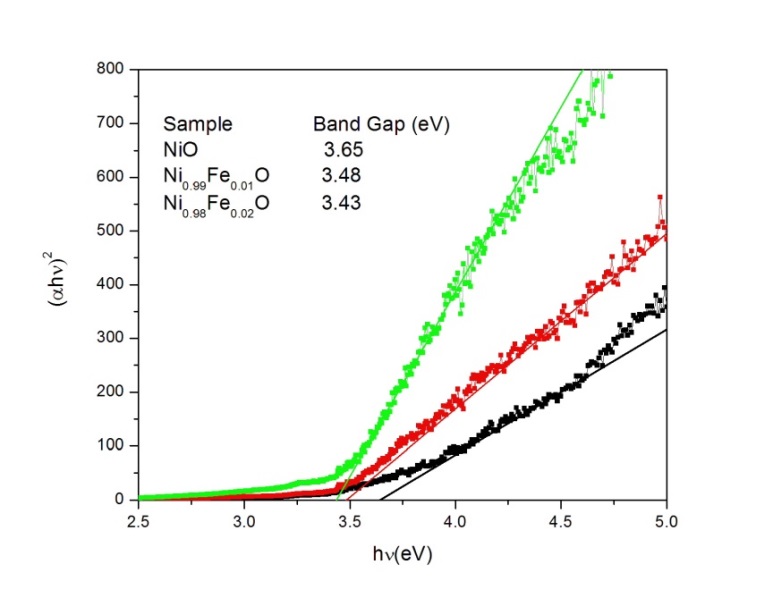 | Figure 2. Variation of  photon energy, hv for Ni1-xFexO (x = 0, 0.01 and 0.02) nanoparticles photon energy, hv for Ni1-xFexO (x = 0, 0.01 and 0.02) nanoparticles |
 | (2) |
 of ions and local field inside the material. The values of classical electron polarizability
  and
and  from Eg for Ni1-xFexO nanoparticles can be calculated as per the following relations [23, 24]:
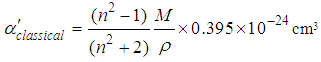 | (3) |
 | (4) |
 are molecular weight (g/mol) and density (g/cm3) of the substances, respectively. Figure 4 shows the evolution of
  and
and  with different Fe doping concentration in NiO.
 | Figure 3. Variation of Eg and refractive index (n) in Ni1-xFexO (x = 0, 0.01 and 0.02) nanoparticles |
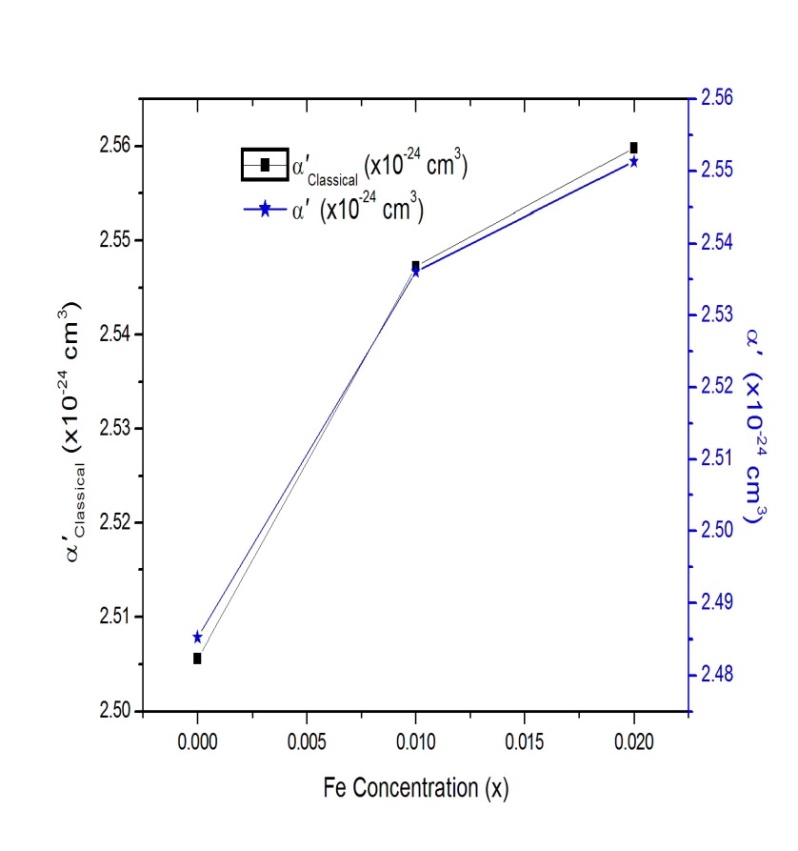 | Figure 4. Variation of  and and  in in  (x = 0, 0.01 and 0.02) nanoparticles (x = 0, 0.01 and 0.02) nanoparticles |
4. Conclusions
- The UV-visible spectroscopic characterization of Ni1-xFexO nanoparticles showed Fe doping causes the shrinking of optical band gap of NiO. The refractive indices extracted using Eg values are enhanced with Fe doping in NiO nanoparticles. The values indicated that the Fe doped NiO nanoparticles are transparent to visible light. Our study thus indicates that the shrinking of band gap in Ni1-xFexO samples could be useful for optical device applications.
ACKNOWLEDGEMENTS
- The authors thank to Prof. N.C. Mishra, Utkal University, Bhubaneswar for his encouragement and support.