-
Paper Information
- Paper Submission
-
Journal Information
- About This Journal
- Editorial Board
- Current Issue
- Archive
- Author Guidelines
- Contact Us
Nanoscience and Nanotechnology
p-ISSN: 2163-257X e-ISSN: 2163-2588
2015; 5(4): 82-88
doi:10.5923/j.nn.20150504.02
Synthesis and Characterization of ZnO Nanoparticles via Precipitation Method: Effect of Annealing Temperature on Particle Size
 Abstract
 Reference
 Full-Text PDF
 Full-text HTML
Nehal A. Salahuddin 1, Maged El-Kemary 2, Ebtisam M. Ibrahim 2
1Department of Chemistry, Faculty of Science, Tanta University, Tanta, Egypt
2Department of Chemistry, Faculty of Science, Kafrelsheikh University, KafrElSheikh, Egypt
Correspondence to: Nehal A. Salahuddin , Department of Chemistry, Faculty of Science, Tanta University, Tanta, Egypt.
| Email: |  |
Copyright © 2015 Scientific & Academic Publishing. All Rights Reserved.
Zinc oxide nanoparticles were synthesized via precipitation method after annealing the precursor at different temperatures. The effects of annealing temperatures for the precursors on the particle size of ZnO NPs were investigated. The structure and composition of the precursor and prepared ZnO NPs were studied using X-ray diffraction (XRD), Scanning electron microscopy (SEM), Transmission electron microscopy (TEM), Fourier transform infrared spectroscopy (FT-IR) and thermal gravimetric analysis (TGA). The optical properties of the ZnO NPs were characterized using UV-visible spectroscopy. The XRD results revealed that the ZnO NPs are highly crystalline, having the hexagonal wurtzite crystal structure. The SEM images showed that ZnO nanoparticles prepared in this study were spherical in shape. The results of the UV-vis studies showed that the optical properties of the ZnO NPs depended on the annealing temperature. The size of ZnO NPs increased with an increase in annealing temperature.
Keywords: ZnO nanoparticles, Precipitation, TEM, SEM, XRD, UV-Visible spectroscopy
Cite this paper: Nehal A. Salahuddin , Maged El-Kemary , Ebtisam M. Ibrahim , Synthesis and Characterization of ZnO Nanoparticles via Precipitation Method: Effect of Annealing Temperature on Particle Size, Nanoscience and Nanotechnology, Vol. 5 No. 4, 2015, pp. 82-88. doi: 10.5923/j.nn.20150504.02.
Article Outline
1. Introduction
- In recent years, application of nanoparticles within size range of 1-100 nm has received significant attention due to their novel properties. Among several of nanoparticles, ZnO nanoparticles (ZnO NPs) have received more attention. ZnO is a wide band gap (3.37 eV), semiconductor having large excitation binding energy of 60 meV at room temperature which is significantly larger than other materials and it has high transmittance and good electrical conductivity [1-4]. ZnO has attracted much interest as one of the multifunctional inorganic nanoparticles due to its unique combination of superior physical, chemical, biological, electrical, optical, long-term environmental stability, biocompatibility, low cost and non-toxic properties. Therefore, nano-ZnO can potentially be applied to gas sensors, photocatalyst for degradation of waste water pollutants, catalysts, semiconductors, varistors, piezoelectric devices, field-emission displays, ultraviolet (UV) photodiodes, surface acoustic wave (SAW) devices, UV-shielding materials, rubber, medical and dental materials, pigments and coatings, ceramic, concrete, antibacterial and bactericide, and composites [5-11]. Zinc is a necessary element to our health and ZnO nano particles also have good biocompatibility to human cells. Recently ZnO is listed as generally documented as safe material by FDA (food and drug administration, (USA) [12-15]. Recently different synthesis methods have been devised for ZnO nanoparticles such as vapor transport process [16, 17], spray pyrolysis [18], thermal decomposition [19], hydrothermal synthesis [20], sol-gel processing [21], direct precipitation and co-precipitation [22-24]. Among these methods, physical vapor deposition (PVD) and chemical vapor deposition (CVD) have been developed to synthesis ZnO nanoparticles into complex structures such as flower-like and web-like agglomerates. However, in order to obtain the final structure these methods usually require multiple steps, sophisticated equipment and high temperature. In contrast, low-temperature wet chemical processes such as, hydrolysis, precipitation and hydrothermal process are cost-effective and scalable and have been used for preparing a wide variety of ZnO nanostructures [22]. In this work, the precipitation method was used to prepare ZnO NPs with variable fine particle size. The effect of annealing temperature on particle size and structural properties of ZnO NPs was studied using TGA, FT-IR, XRD, SEM and TEM to obtain the the optimum size of ZnO NPs.
2. Experimental Section
2.1. Materials
- Zinc nitrate hexahydrate "Zn(NO3)2.6H2O, 99% Sigma-Aldrich", sodium carbonate "Na2CO3, 99% Sigma-Aldrich" and Ethanol (C2H5OH, 95%, Pio chem), were used as received.
2.2. Preparation of ZnO NPs
- ZnO NPs were prepared by a precipitation method according to the previous report [10]. Briefly, two solutions were prepared: Solution A (0.1 mol Zn(NO3)2.6H2O) was prepared by dissolving 29.747 g of Zinc nitrate hexahydrate in 200 ml distilled water; and solution B (0.12 mol Na2CO3) was prepared by dissolving 12.7188 g of sodium carbonate in 240 ml distilled water. After that, the precursor was prepared by adding solution A to solution B drop wise under vigorous stirring. The white precipitate was collected by filtration and rinsed with distilled water three times. The solid was then washed with ethanol and dried at 100°C for 6 h. Finally, ZnO NPs (Z2-Z7) were obtained after annealing of the precursor in air at 250, 300, 350, 400, 500, and 600°C for 2 h, respectively.
2.3. Characterization
- Thermogravimetric analysis (TGA) was carried out on TGA-50, Shimadzu at a heating rate of 10°C min-1. Fourier transform infrared (FT-IR) spectra were measured by FTIR-4100 spectrometer, JASCO with a frequency range from 4000 to 400 cm-1, using KBr disks. The crystallinity and phases of the precursor and ZnO NPs were characterized by an X- ray diffractometer, XRD-6000, Shimadzu, Japan with Cu-kα radiation (λ = 1.5412 Å), 40 Kv, 30 mA) in the 2θ range of 10-80° with 2°/min scanning rate. The crystallite size (D) of selected samples were estimated using the Scherer's equation, D=Kλ/ (Bcosθ) where: k = constant (0.89 < k < 1), λ = wavelength of the X-ray, B = FWHM (Full Width at Half Maximum) width of the diffraction peak, θ = diffraction angle. The morphological feature of the ZnO NPs was observed by a scanning electron microscopy SEM-EDS, JSM-6360 LA, JEOL, Japan and a high-resolution transmission electron microscope (HRTEM), JEM-2100, JEOL. The samples for SEM were coated with gold and the samples for TEM analysis were prepared by dropping dilute suspension of ZnO nanostructures onto copper grids.The optical properties of prepared ZnO NTs were analyzed via UV-visible Spectrophotometer (Shimadzu, UV-2450).
3. Results and Discussion
3.1. Thermogravimetric Analysis
- The TGA thermogram for ZnO precursor (Z1) is shown in Figure 1. It should be noted that the observed TGA data of Z1 show that the weight loss proceeds in successive stages with increasing temperature. The first step is in the range of 50°C to about 190°C, demonstrating the dehydration of surface-adsorbed water. The second step, which is a major weightlessness tape, occurs in the range of 190°C to about 320°C with no further weight loss up to 600°C temperature, indicating the loss of OH- and CO32- [25]. As can be seen from the TGA curve, the precursor can be completely decomposed to ZnO after annealing at ~ 350°C [22].
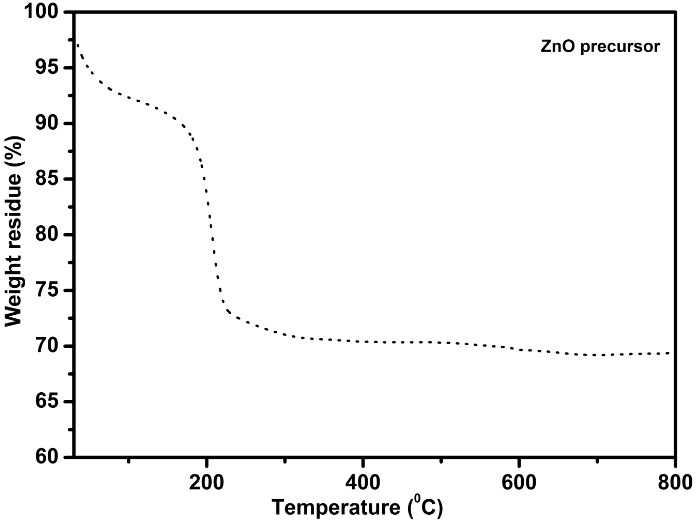 | Figure 1. TGA curve of ZnO precursor (Z1) |
3.2. Fourier Transform Infrared Spectroscopic Analysis
- The FT-IR spectra of Z1 - Z7 are shown in Figure 2. It can be seen in Z1 the peak at 3150-3620 cm-1 indicating a plentiful presence of hydroxyl groups. The peaks at 1370 cm-1 and 1504 cm-1 are attached to ZnCO3, and the absorption tape in the 703-1029 cm-1 range is due to the lattice vibration of CO3-2 [25]. This also proves that the precursor was precisely zinc hydroxyl carbonate. After annealing of the precursor, a peak is appeared at ~ 500 cm-1, this is due to transverse optical stretching modes of ZnO. The peak at 3150-3620 cm-1 has been reduced significantly after annealing (Z2-Z7) illustrating the decomposition of the hydroxyl group.
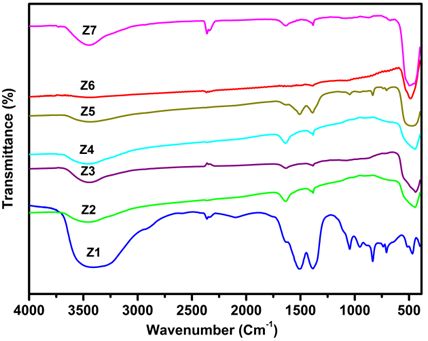 | Figure 2. FT-IR spectra of ZnO precursor (Z1) and ZnO NPs (Z2-Z7) |
3.3. X-ray Diffraction (XRD) Studies
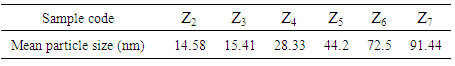
- Figure 3a, displays the XRD pattern of precursor, three characteristic peaks of zinc hydroxyl carbonate at 12.8974°, 35.7751° and 59.33°. According to well coincidence with PDF 19-1458, it can be revealed that the precursor is zinc hydroxyl carbonate (Zn5(OH)6(CO3)2) [25]. The XRD patterns of ZnO nanoparticles (Z2- Z7) obtained from the annealing of ZnO precursor at different temperatures are shown in Figure 3b. The ZnO NPs has the wurtzite structure (hexagonal phase, space group p63mc). All characteristic peaks observed for ZnO NPs are in good agreement with those taken from the joint committee of powder diffraction standards (JCPDS) card No.36-1451, a=0.3249 nm, c=0.5206 nm. Diffraction peaks related to impurity are not observed in the XRD patterns, confirming the high purity of the synthesized product. Upon the annealing temperature, as shown in Figure 3b, the diffraction peak sharpness improved with respect to the annealing temperature and the full-width at half-maximum (FWHM) values were decreased with increasing the annealing temperature. Moreover, (101) plane has the strongest line for all investigated annealing temperatures. These results indicated that there is an improvement in the crystallinity of the ZnO NPs by increasing the annealing temperatures from 250 to 600°C. This improvement is due to the crystallization of ZnO particles by the supply of sufficient thermal energy. The average crystalline size of ZnO NPs was calculated according to Scherer's equation. The highest three peaks were selected for this calculation and the results are given in Table 1. Clearly, the average size was increased by increasing annealing temperature.
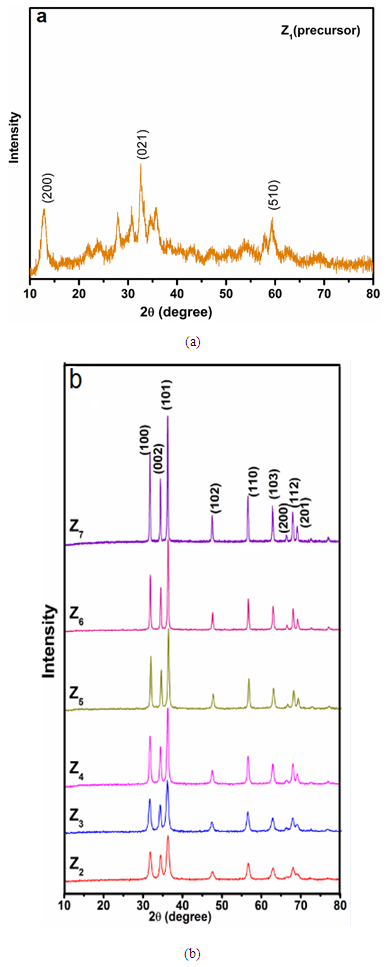 | Figure 3. XRD patterns of (a) Z1, (b) Z2 - Z7 obtained from the annealing of Z1 at different temperatures |
|
3.4. Scanning Electron Microscopic Analysis
- Figure 4(a-e) shows the SEM morphology images of the ZnO NPs resulted from the annealing of Z1 at different temperatures. It is worth noting that ZnO has a spherical shape with mono dispersion nanoparticles. Obviously, the mean size and also size distribution of nanoparticles are increasing with increasing annealing temperature. An agglomeration of nanoparticles during the heating process may be due to the high surface energy of nanoparticles [26]. To investigate the size distribution of the nanoparticles, a particle size histogram was prepared for ZnO powder calcined at various temperatures, (Z3, Z4, Z5, Z6, and Z7) and shown in the inset of Figure 4(a-e). The particle sizes of ZnO were very sensitive to the calcinations temperature. With increasing temperature, larger particle sizes with small surface area of NPs are produced. The analysis showed that mono dispersion of nanoparticles was obtained in the Z4 (Fig 4b), which implied that the average grain size of these NPs is 67 nm.
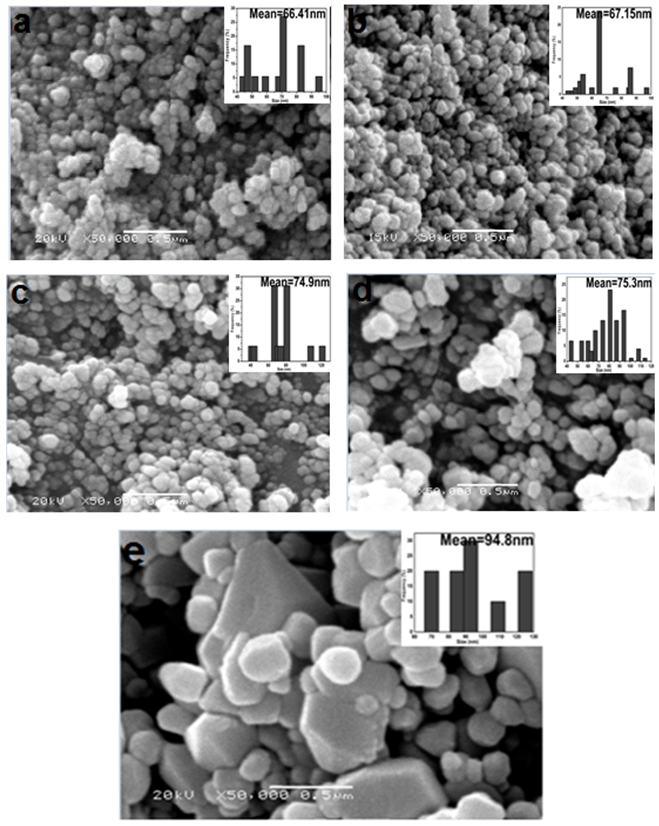 | Figure 4. SEM images of (a) Z3, (b) Z4, (c) Z5, (d) Z6 and (e) Z7. The inset shows the particle size histogram |
3.5. Transmission Electron Microscopy (TEM) Analysis
- Figure 5 (a, b), displays TEM micrographs of ZnO NPs obtained from the annealing of Z1 at 350°C (Z4,), 600°C (Z7) for 2 h. TEM images show that the ZnO NPs are spherical shape. It is worth mentioned that the increase in the annealing temperatures generally led to the increase of the NPs size. For the sample annealed at 350°C (Figure 5a), the average diameter is 25.4 nm. It is worth mentioning that the average crystal diameter obtained from the Scherer's formula (28.33 nm) in good agreement with the value obtained from analysis of transmission electron microscope images. However, for the sample annealed at 600°C, ZnO crystals aggregated into clusters of several hundred nanometers in size, showing large differences from the XRD results. It was reported that the application of Scherer's formula is restricted to small particles (usually smaller than 100 nm) and the above observed large differences reflect the inapplicability of Scherer's equation to large ZnO crystallites [10].
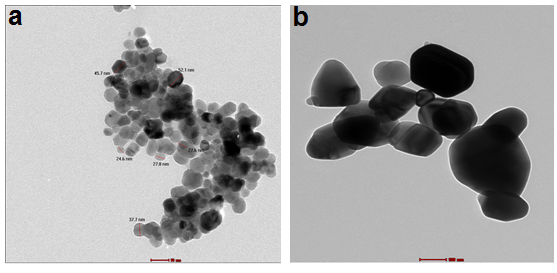 | Figure 5. TEM images of ZnO nanostructures (a) Z4 and (b) Z7 |
3.6. UV Analysis
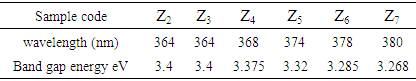
- The UV-vis absorption spectra of the ZnO-NPs prepared at different annealing temperatures are shown in Figure 6. A broad absorption peak was observed in each spectrum at 360-380 nm which is a characteristic band for the pure ZnO [27]. No other peak was observed in the spectrum confirms that the synthesized products are ZnO only. Interestingly, an obvious red shift in the absorption edge was observed for the products annealed at different temperatures. This might be due to changes in their morphologies, particle size and surface microstructures [21]. Z2 exhibits a strong absorption at 364 nm, Z3 at 364 nm, Z4 at 368 nm, Z5 at 374 nm, Z6 at 378 nm, and Z7 at 380 nm, which is blue, shifted with respect to the bulk absorption edge appearing at 381 nm (inset in figure 6). It is known that the ZnO particles which has absorption at higher wavelength in the UV-visible spectrum have higher particles size [27]. Thus, UV-Vis results were in good agreement with the XRD results in ZnO particles size prediction. The band gap energy can be determined by substituting the value of the absorption peak at a given wavelength in the following equation [28]Eg = hυg = hc/λgWhere h = 4.14x10⁻¹⁵ eVs, c = 2.99x10⁸ m/s, λg = wavelength, and the results are given in Table 2.
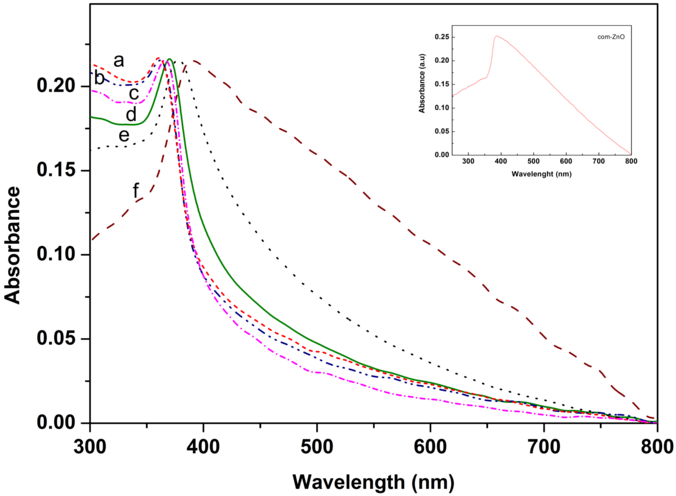 | Figure 6. UV-vis absorption spectra of ZnO NPs, prepared at different annealing temperatures (a) Z2, (b) Z3, (c) Z4, (d) Z5, (e) Z6, and (f) Z7 |
|
4. Conclusions
- Zinc oxide nanoparticles were synthesized via precipitation method after annealing the precursor at different temperatures ranging from 250-600°C. The effects of annealing temperature on particle size and structural properties of ZnO nanoparticles were carried out using FT-IR, XRD, SEM, TEM and UV-vis spectroscopy. The FT-IR showed a broad absorption band related to Zn-O vibration band. The XRD analysis confirmed that the precursor of ZnO was Zn5(OH)6(CO3)2 and the synthesized ZnO nanoparticles have pure wurtzite structure. The XRD and TEM analysis showed that the average particle size of ZnO particles increases with increasing annealing temperatures. In addition, the SEM results showed the formation of spherical shaped nanoparticles. The band gap of the ZnO NPs was estimated from the UV-vis absorption, and it was observed that there was a red shift in the absorption edge with increasing annealing temperature. From the TEM analysis, the average particle sizes of the ZnO NPs annealed at the temperatures of 350°C and 600°C were found to be 25 nm and 98.59 nm respectively.