-
Paper Information
- Paper Submission
-
Journal Information
- About This Journal
- Editorial Board
- Current Issue
- Archive
- Author Guidelines
- Contact Us
Nanoscience and Nanotechnology
p-ISSN: 2163-257X e-ISSN: 2163-2588
2014; 4(3): 44-51
doi:10.5923/j.nn.20140403.02
Synthesis and Characterisation of Polyamide/Halloysite Nanocomposites Prepared by Solution Intercalation Method
 Abstract
 Reference
 Full-Text PDF
 Full-text HTML
Sowrirajalu Bhuvana1, Muruganand Prabakaran2
1School of Chemical and Biomedical Engineering, Nanyang Technological University, Singapore
2Environment and Water Technology Centre of Innovation, Ngee Ann Polytechnic, Singapore
Correspondence to: Sowrirajalu Bhuvana, School of Chemical and Biomedical Engineering, Nanyang Technological University, Singapore.
| Email: |  |
Copyright © 2014 Scientific & Academic Publishing. All Rights Reserved.
In this study, nanocomposites were prepared using a naturally occurring nanotubular material, Halloysite nanotubes with a completely amorphous polyamide (aPA) based on poly (hexamethylene isophthalamide). This nanocomposite system was prepared by solution intercalation method. Fourier Transform infrared studies on this system showed that there is very good interfacial interaction exists between the filler and the polymer through Hydrogen bonding. Polarized Optical Microscopy and Transmission electron Micoscopy studies showed the well dispersed morphology of nanocomposites with Halloysite content up to 4 wt%. Differential scanning calorimetric results indicated that nanotubes did not induce the formation of a crystalline phase in this amorphous polymer. The Dynamic Mechanical Analysis and Thermal studies showed that the incorporation of halloysite has significantly improved the storage modulus of this nanocomposite system as well as its thermal stability.
Keywords: Morphology, Polymer-filler interaction, Mechanical Properties, Nanocomposites, Halloysite
Cite this paper: Sowrirajalu Bhuvana, Muruganand Prabakaran, Synthesis and Characterisation of Polyamide/Halloysite Nanocomposites Prepared by Solution Intercalation Method, Nanoscience and Nanotechnology, Vol. 4 No. 3, 2014, pp. 44-51. doi: 10.5923/j.nn.20140403.02.
Article Outline
1. Introduction
- Polymer nanocomposites are a new family of high performance materials, which have developed rapidly during the recent two decades [1]. Polymer nanocomposites come in many types, among which, clay/polymer nanocomposites and carbon nanotube/polymer nanocomposites have been investigated widely. For the former, smectite-type clays, such as montmorillonite (MMT) and hectorite are used as fillers. The new material shows excellent mechanical properties and thermal stability compared to neat polymer. However, it is surprising that the addition of MMT was found to have insignificant effects on the fracture and impact strength of the polymer matrix, even when the MMT was highly exfoliated [2]. In the technological field of polymer nanocomposites, new potential applications were obtained using carbon nanotubes as reinforced nanofibers and to impart unique electrical and thermal properties to the polymer matrix. Due its typical structure with high aspect ratio and anisotropic structure, carbon nanotubes show characteristic electrical and thermal properties. However, in contrast of layered silicate polymer nanocomposites, applications of carbon nanotubes have been hindered mainly because of their high cost for production and synthesis [3]. Recently, Halloysite nanotubes (HNTs) which are a kind of alumino-silicate clays mined from natural deposites were found to be new nanofiller for the polymers and improved properties of the resultant nanocomposites were also reported. They are chemically similar to kaolin, but differ by having a predominantly hollow microtubular structure with a high aspect ratio, rather than a stacked plate-like structure. More importantly, the unique crystal structure of halloysite nanotubes resembles that of CNTs. Therefore, halloysite particles may have the potential to provide cheap alternatives to the expensive CNTs because of their tubular structure in nano-scale and also due to their similarity to the other layered clay minerals such as MMTs, having the possibility to be further intercalated chemically or physically [4, 5].It is generally believed that the interfacial interactions are important in determining the final performance of polymer nanocomposites incorporated with inorganics. The interfacial interactions between polymer matrix and inorganics mainly include van der Waals force, hydrogen bonds, covalent bonds and ionic bonds. Many approaches have been developed to improve the interfacial interactions of the nanocomposites, including the modification of inorganics [6] or matrix [7]. However, in the case of polymer/HNT nanocomposites, the unique crystal structure of HNTs and low hydroxyl density on the surface makes them relatively easy to disperse in a polymer matrix compared to other nanoclays [8]. In the previous studies, our group has extensively studied the inter and intra molecular interactions in the polymer/clay nanocomposite systems [9]. The main objective of the present work is to investigate the molecular interaction between the Halloysite nanotubes and the polyamide matrix by using FTIR technique, to study the dispersion of the nanotubes in polymer matrix by microstructural analysis and also to investigate the effect of incorporation of these halloysite nanotubes on the mechanical properties of the aPA.
2. Experimental Section
2.1. Materials
- The amorphous polyamide (aPA) was obtained from Lanxess under the product trade name Durethane T40. The Halloysite nanotubes (HNT) and 2, 2, 2-trifluoro ethanol (99%) were purchased from Aldrich Chemicals. Prior to blending, the polymer and the nanotubes were dried in vaccum oven at 80℃ for about 24hrs.
2.2. Preparation of Nanocomposite
- About 4.9g of aPA was dissolved in 10ml of 2, 2, 2-Trifluoro ethanol and allowed to stir at room temperature for about 24hrs. The HNT dispersion (0.1g in 10ml) was also prepared by the same method. After complete dissolution of the polymer, the HNT dispersion was added to it and allowed to mix together by stirring at room temperature for another 24hrs.Finally the films were cast in a plastic dish in a closed hood. After the solvent evaporated the films were then dried in vaccum oven at 70℃ for 2days.
2.3. Characterization
- Transmission Electron Microscopy was used for the Morphological investigation of the nanocomposites and halloysite nanoclay. TEM was conducted on a JEM 3010 electron micro scope. Thin films of nanocomposites embedded in epoxy was prepared and then microtomed to get thin sections of about 50nm in thickness. In order to determine the microstructure of the halloysite powder, the as-received powder of neat halloysite was suspended in ethanol. Afterwards a droplet of the suspension was sprayed on a grid for transmission electron microscopy (TEM) studies.Surface morphology of the nanocomposite was analyzed by polarized optical microscopy (POM, XJP400T, KOZO) at room temperature. The lens magnification was10x.Wide angle X-ray Diffraction (WAXD) was recorded by monitoring the diffraction angle 2θ from 5° to 25° on a Bruker D8 X-ray diffractometer. The X-ray crystallographic unit monitored with a Guinier focusing camera. This unit was equipped with a nickel filtered Cu Kα radiation source (λ = 0.1542 nm). The scanning rate was 0.02°/min.Fourier Transform Infrared Spectrometer (FTIR) was conducted using a Nicolet 5700 spectrometer to investigate the possible interaction between the HNTs and the polymer matrix. Film thickness was controlled to obtain an in-plane peak height of 1 absorbance units or less. Spectra were taken from 400cm-1 to 4000cm-1. The beam splitter was KBr and the detector was DTGS. The resolution was 4 cm-1. Each spectrum shown is an average of 64 individual scans. Thermo Gravimetric Analysis (TGA) was conducted using a Diamond TG/DTA analyzer from 30℃ to 800℃ at a heating rate of 10℃ per min. under Air atmosphere. For each sample, two replicates were run and the average value was taken. The reproducibility of the measurements was ±2℃.Differential Scanning Calorimetry (DSC) analysis was carried out on a Mettler Toledo DSC 822 analyzer under Nitrogen atmosphere. The samples were first heated to 200℃ to remove any thermal history, then cooled to 30℃ and finally heated to 200oC with the heating rate of 10℃/min.Dynamic mechanical analysis measurements were performed with a DMA Q800 analyzer using tension mode. Measurements were carried out on rectangular specimens with dimensions of 20 x 0.5 x 0.05 mm. in a temperature interval from room temperature to 200℃. The analysis was done under tension mode at a constant frequency of 1 Hz with the heating rate of 0.3℃/min and simultaneously analyzed for storage modulus (E’) loss modulus (E’’) and tan δ. Before the experiments, the samples were dried at 80℃ for 48 h under vacuum.
3. Results and Discussion
3.1. Morphology of Neat HNT and Amorphous Polyamide/HNT Nanocomposites
- The morphology of the prepared nanocomposites were studied using different techniques. The WXRD results for the pure HNTs, and the aPA/HNT nanocomposite systems are shown in Figure 1. The pure HNTs show a diffraction peak at 2θ = 12.14 corresponding to (001) basal spacing of 0.728 nm, determined by using Bragg’s Law. This result indicates that the halloysite was mainly in the dehydrated form and typically referred to as (7A°)-Halloysite [10]. This basal reflection of HNTs is coming due to its tubular morphology, high degree of disorder, small crystal size and interstratifications of layer with various hydration states [11]. This peak of HNTs in the composite is shifted to a lower 2θ value as compared to that of the pure HNT. For nanocomposite with 2% HNT, the 2θ of (001) plane shifted to 12.01. For 6% HNT, the 2θ value is observed at 12.08. The reduction of 2θ and increasing of the basal spacing of the HNTs may be attributed to the intercalation of the HNTs by the amorphous polymer matrix, which clearly confirm the formation of nanocomposites [12]. Apart from the aforementioned peak at low 2θ, the diffraction pattern of neat HNT is showing other peaks at a 2θ of 20.06 and 24.94 respectively, which are related (0 2 0) and (0 0 2) basal reflection.
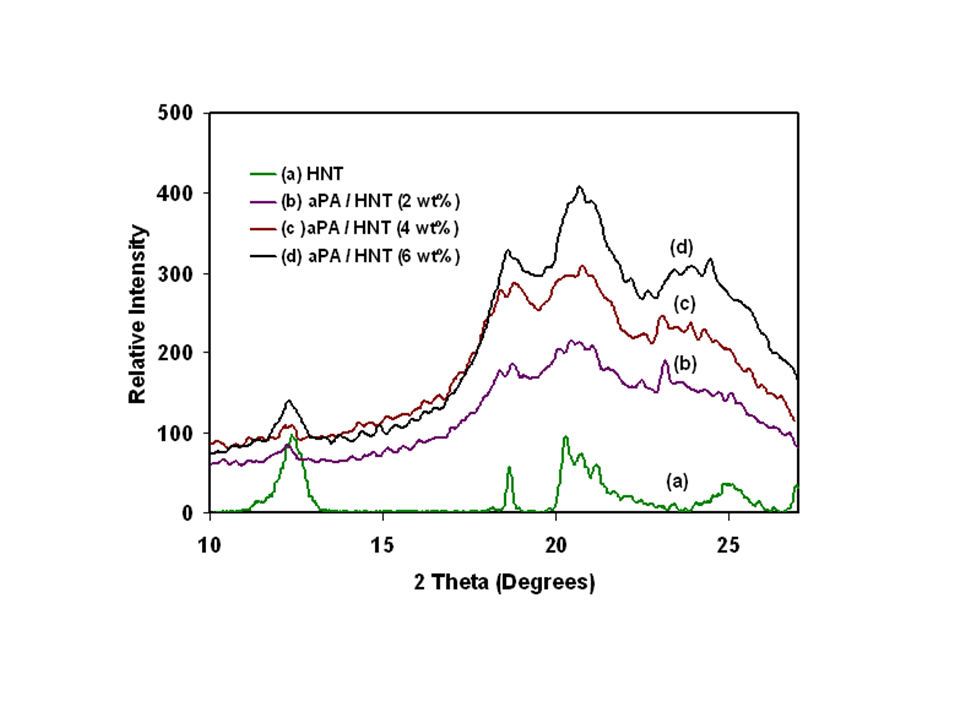 | Figure 1. XRD Patterns of neat Halloysite and aPA/ Halloysite nanocomposites |
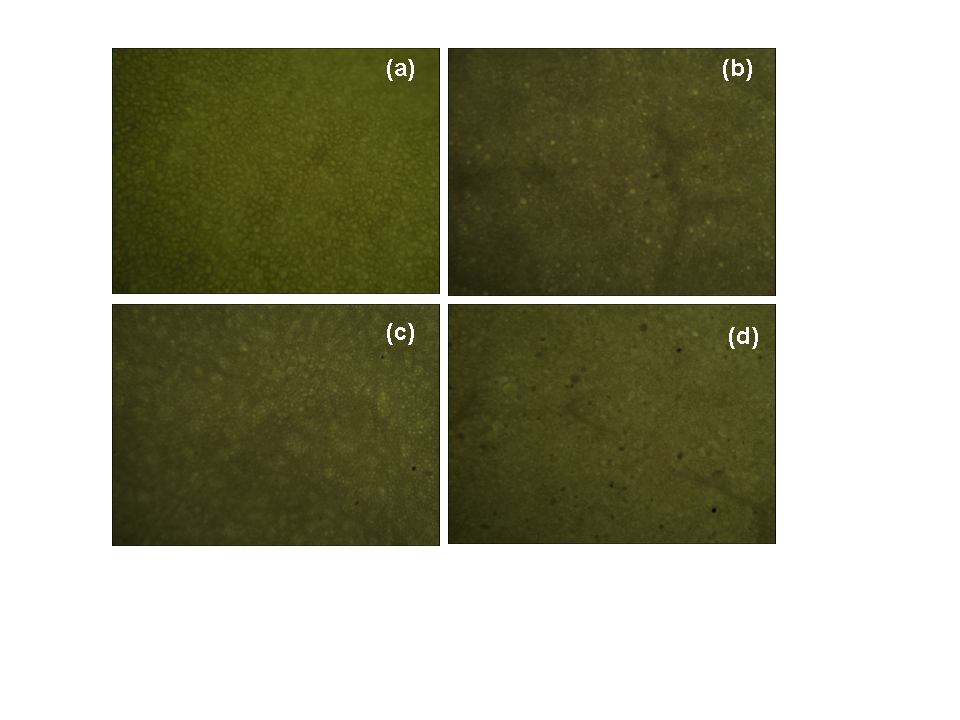 | Figure 2. POM images of a) Neat aPA b) aPA / HNT (2 wt %), c) aPA / HNT (4 wt %) d) aPA/ HNT (6 wt %) |
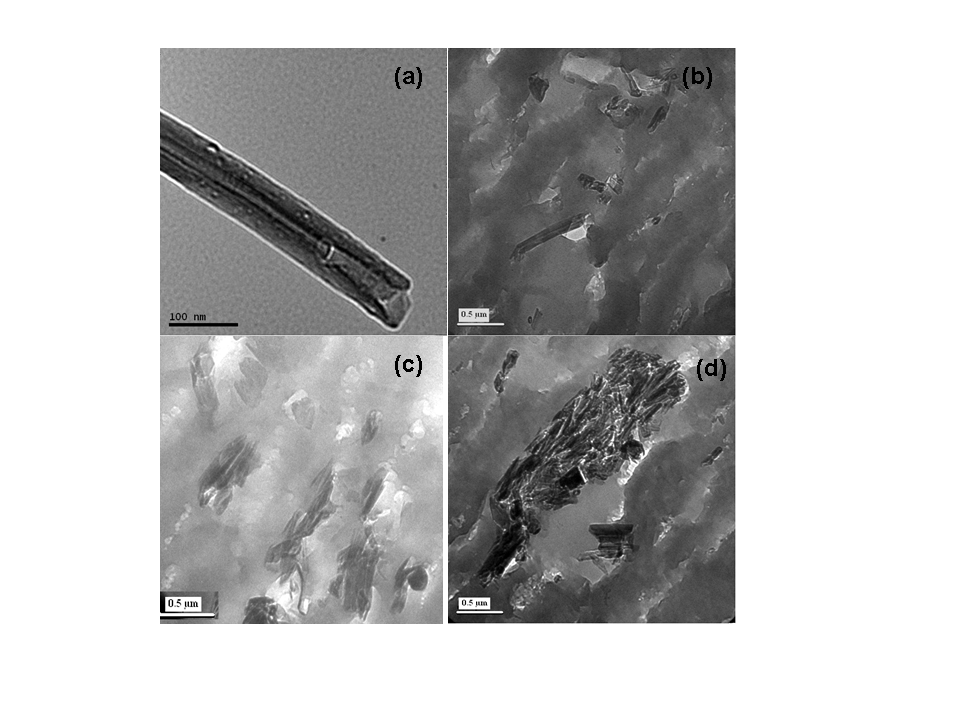 | Figure 3. TEM images of a) HNT b) aPA / HNT (2 wt%), c) aPA / HNT (4 wt%) d) aPA/ HNT (6 wt%). Scale bar for a) 100nm b,c,d) 500nm |
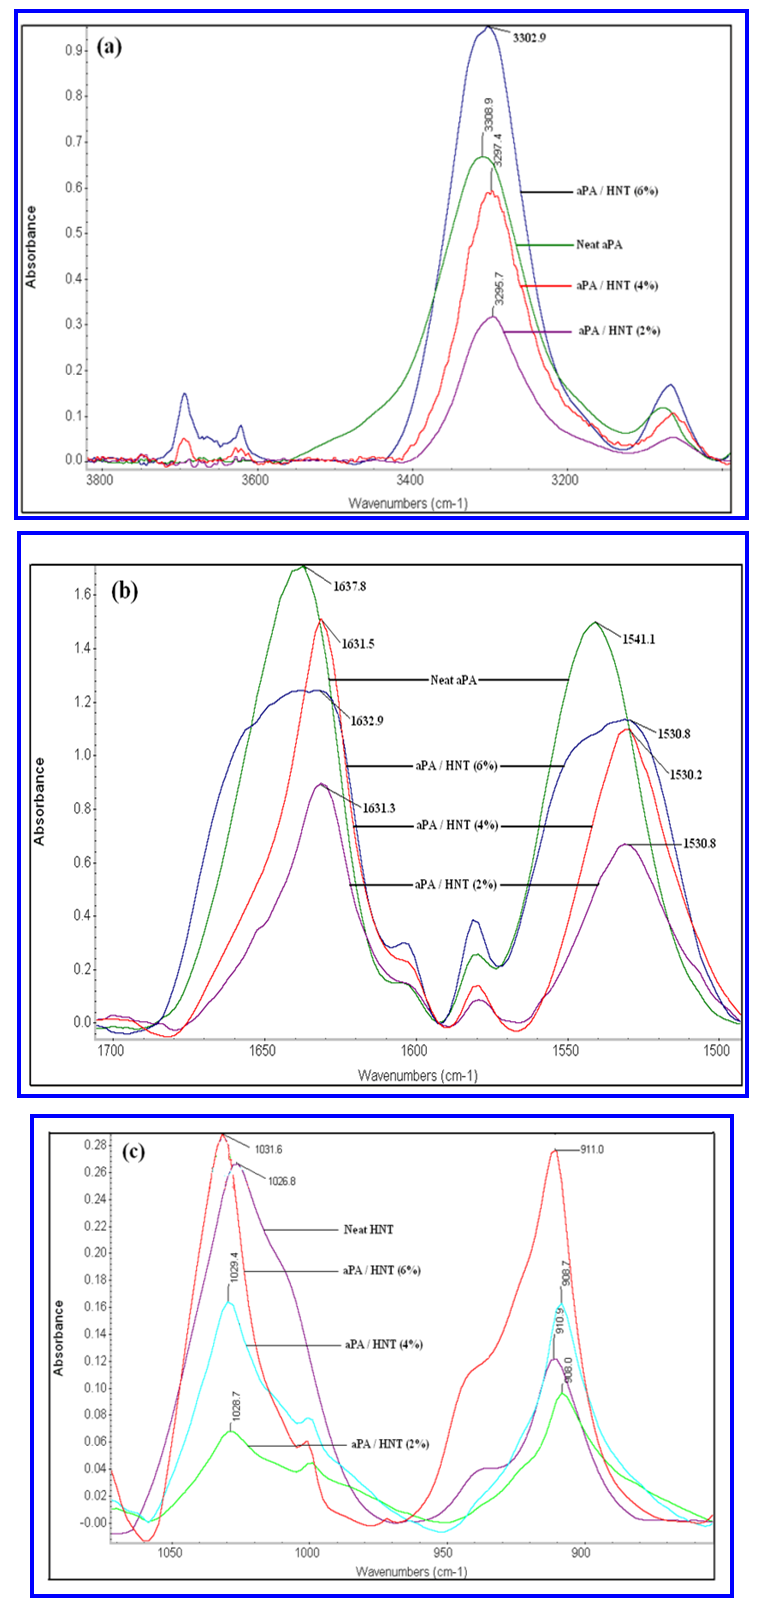 | Figure 4. FTIR Spectra of Neat aPA and aPA/HNT nanocomposites in the region a) 3000 -3800 b) 1500 – 1700 b) 1500 – 1700 and c) 850 – 1050 and c) 850 – 1050  |
3.2. Fourier Transform Infra red Studies
- In order to verify the interfacial interactions between the HNTs and the matrix, FTIR was conducted on HNTs, neat aPA and nanocomposites.Typical crystalline unit of HNTs, consists of two-layer structure and contains two types of hydroxyl groups, outer hydroxyl groups and inner hydroxyl groups, which are situated in the unshared plane of tetrahedral sheet (silicon and oxygen) and shared octahedral sheet (aluminum and oxygen) respectively. As a consequence, the outer side of HNTs is siloxane and only a few of Si–OH groups are located in HNT ends and surface defects. However, most of Al–OH groups are situated in the inner side [13]. Hence, it is believed that there will be more interaction (Hydrogen bond formation) between the silanol group of HNTs and the amide groups of the matrix than that of the aluminols and matrix.Figure 4 show the FTIR spectra of neat HNT and nanocomposites respectively. In Figure 4a, for neat aPA the –NH stretching vibration of the amide group is observed at 3308cm-1.However, for the nanocomposite systems, there is a shift of about 13cm-1 is observed for this amide stretching absorption. For nanocomposite with 2 wt% HNT composition, this peak is observed at 3295cm-1. In Figure 4b, the strong characteristic peak at 1638 cm−1 and 1541cm-1 in neat aPA spectrum is assigned to the stretching vibration of amide carbonyl group. This absorption peak in 2 wt% HNTs/aPA system is shifted to 1631 cm−1 and 1530 cm-1.Similarly, In Figure 4c, the strong absorption around 1026 cm-1 and 910 cm-1 is assigned to the absorptions of Si–O stretching vibrations and Al–OH vibrations in HNTs respectively. It is observed that the corresponding absorption peaks in aPA/HNT 2% system are shifted to 1028 and 908 cm−1, and as the HNT content increases to 6 wt%, the peak further shifts to 1031cm-1and 911cm-1. Because most of the Al–OH groups are situated in the inner side of the crystalline structure as described above, the shift for the absorption of aluminols is much smaller than that for the Si–O. It is believed that the shifts of FTIR absorption peaks are resulted from the formation of hydrogen bonds between the oxygen atoms of Si-O bonds or hydroxyl groups on the surfaces of HNTs and amide group of the polymer matrix.
3.3. Thermal Properties
- Table 1 shows the Tg of nanocomposite system. The value of Tg for all specimens was determined from the midpoints of the corresponding glass-transition region. The Tg of pure polymer is 127℃, which is almost similar to the previous studies. Generally addition of nanofillers tends to induce phase transitions in polymer systems. But in this system, there is only one transistion observed in all the samples indicating that the polymer as well as the nanocomposites is completely amorphous.
|
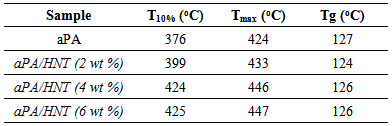
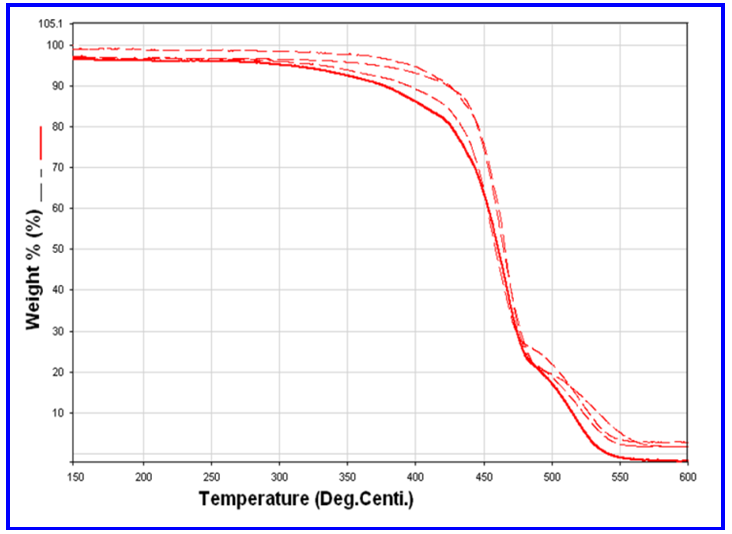 | Figure 5. TGA curves of neat aPA and its nanocomposites |
3.4. Dynamic Mechanical Analysis
- Dynamic mechanical measurements over a range of temperatures provide valuable insight into the structure, morphology and viscoelastic behaviour of polymeric materials. These measurements form an important part of the technique for establishing relaxation transitions. It is an effective method to study the effect of incorporation of nanofillers on the polymer chain mobility. Generally, Uniform dispersion of filler especially in nanoscale leads to high mechanical properties of composites.On the contrary, the aggregated fillers in the polymer matrix act as the stress–concentration points, leading to deteriorated properties [15]. Figure 6a shows the plot of Dynamic Modulus versus Temperature of the nanocomposite systems. The storage modulus of the nanocomposite system increases with increase in HNT content of 2 and 4 wt%. But for aPA/ 6 wt% HNT there is a slight decrease in modulus which may be due to the presence of nanotube agglomeration as evidenced from the POM and TEM images. However, the storage modulus of the nanocomposite systems is significantly higher than the neat aPA. The significant increases in mechanical properties of the nanocomposites were attributed to the reinforcement effect, unique nanostructure and property of the rigid silicate nanotubes with high strength and stiffness. This means that the incorporation of halloysites into aPA matrix remarkably enhances stiffness and load bearing capability of the material.Tg is commonly defined as the temperature where the maximum in the loss tangent (tan δ) occurs [16]. Generally, the tan δ peak (at low frequency) is at a temperature 10–20°C above the Tg, as measured by dilatometry or differential thermal analysis (DTA). The temperature of maximum loss modulus (E’’) is very close to Tg. Akay et al., showed that the glass-transition temperature (Tg) expressed in terms of the temperature of the loss-modulus peak rather than the tan δ peak produces results consistent with the extent of the stress shielding of the matrix by fillers in composites. According to him, the definition of Tg by E" peak indicates more precisely the temperature at which stiffness (as expressed by E') suffers significant deterioration [17]. Figure 6b shows the effect of HNT concentration on Tg, as represented by the maxima of Loss modulus peak. Although there is only very little difference in Tg of the materials, it should be noted that, for nanocomposites with 2 wt% and 4 wt% HNT, there is a slight shift in Tg towards lower temperature.A similar trend has been observed with PP/HNT and Epoxy/HNT nanocomposites, in which the Tg shifts to lower temperature with increase in HNT content.This is because, the well dispersed HNT weakens the polymer chain entanglement as well as the primary intermolecular interaction (i.e Hydrogen bonding between the amide and the carbonyl group) of the polyamide matrix and enables the free movement of polymer chain segments and leads to decreased Tg [18-20]. Although there is interaction between HNT and aPA, since the concentration of HNT is low, this interaction is overshadowed by the free space created by the dispersed HNT leading to slightly decreased Tg by enhanced polymer chain motion. However, for nanocomposites with higher HNT content, the loss modulus peak shifts to higher temperature. It is believed that this may be because of the aggregation of HNT at high concentration, which restricts the polymer chain movement [21, 22]. This could indeed be occurring, since the tan δ peak height for aPA/HNT 6 wt% is slightly higher than the neat polymer as evidenced from Figure 6c.
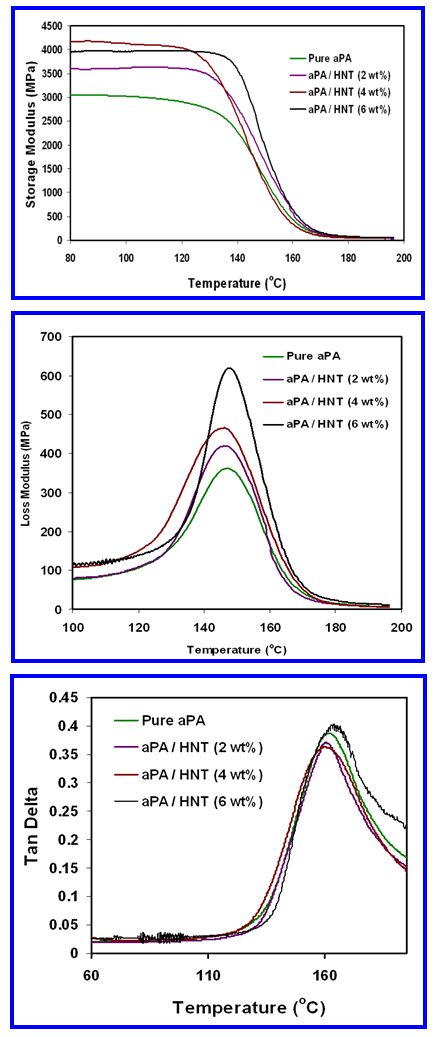 | Figure 6. DMA curves of the nanocomposite |
4. Summary
- In this work, nanocomposites based on a completely amorphous polyamide and Halloysite nanotubes were successfully prepared by solution intercalation technique and their structure-property relationship was studied. The FTIR studies showed that there exists a very good interaction between the polymer and HNT because of the dispersion of Halloysite in polyamide matrix. DSC results showed that, the incorporation of HNT did not produce any phase transition in the polymer. The addition of HNT significantly improves the storage modulus of the nanocomposite system and at higher concentration, the nanotubes tend to agglomerate. The incorporation of HNT has improved the thermal stability of nanocomposite system by entrapping the degradation products in its lumen structure.