-
Paper Information
- Previous Paper
- Paper Submission
-
Journal Information
- About This Journal
- Editorial Board
- Current Issue
- Archive
- Author Guidelines
- Contact Us
Nanoscience and Nanotechnology
p-ISSN: 2163-257X e-ISSN: 2163-2588
2013; 3(5): 130-134
doi:10.5923/j.nn.20130305.04
X-ray Diffraction and UV-Visible Characterizations of α-Fe2O3 Nanoparticles Annealed at Different Temperature
 Abstract
 Reference
 Full-Text PDF
 Full-text HTML
1Department of Physics, North Orissa University, Baripada 757003, Odisha, India
2Department of Physics, Salipur College, Salipur 754103, Odisha, India
Correspondence to: P. Mallick, Department of Physics, North Orissa University, Baripada 757003, Odisha, India.
| Email: |  |
Copyright © 2012 Scientific & Academic Publishing. All Rights Reserved.
Effect of annealing on the microstructure, optical absorption properties of hematite ( -Fe2O3) nanoparticles were studied. Crystallite size of
  -Fe2O3 increased from ~ 34 to 44 nm with increasing annealing temperature from 500 to 700℃. Strain in the sample decreased with increasing annealing temperature. UV-visible characterization indicated the existence of both direct and indirect band gap in the samples. The samples annealed at all temperatures showed the direct band gap at ~ 2.67 eV. However, the indirect band gap increased from 1.6 to 1.94 eV when the annealing temperature increased from 500 to 600℃ and remained almost same for sample annealed at 700℃. The observed values of optical band gaps were in close agreement with the reported values. Our results indicated that the thermal annealing would give rise to well crystalline
  -Fe2O3 nanoparticles with reduced strain.
Keywords: Iron Oxide, Nanoparticle, Annealing, Microstructure, Band Gap
Cite this paper: P. Mallick, B. N. Dash, X-ray Diffraction and UV-Visible Characterizations of α-Fe2O3 Nanoparticles Annealed at Different Temperature, Nanoscience and Nanotechnology, Vol. 3 No. 5, 2013, pp. 130-134. doi: 10.5923/j.nn.20130305.04.
Article Outline
1. Introduction
- In recent years, research on transition metal oxide (TMOs) nanoparticles has attracted much attention for their potential technological applications. Iron oxide is one of the most important transition metal oxide. Iron oxide exhibits different phases such as FeO,
 -Fe2O3,
  -Fe2O3,
  -Fe2O3 and Fe3O4. Hematite (
 -Fe2O3) is the most stable iron oxide under ambient conditions. It is a low cost non-toxic environment friendly material easily available in nature[1]. It shows n-type semiconducting properties with band gap = 2.2eV which lies in the visible region[2].
  -Fe2O3 exhibits rhombohedrally centred hexagonal structure of the corundum type with a close packed oxygen lattice in which two-thirds of the octahedral sited are occupied by Fe (III) ions[3].
  -Fe2O3 exhibits canted antiferromagnetic (weakly ferromagnetic) at room temperature, antiferromagnetic below the Morin transition temperature of 250 K and paramagnetic above its Néel temperature of 948 K[4].
  -Fe2O3 shows wide varieties of applications such as light-induced water splitting[5], catalysis[6], gas sensors[7], solar cells[8], field emission devices[9], magnetic recording [10] drug delivery[11], tissue repair engineering[12], magnetic resonance imaging[13], pigments[14], lithium-ion batteries[10] and spin electronic devices[15].Several methods have been adopted for the synthesis of nanoparticles of
  -Fe2O3 such as sol–gel[16], chemical precipitation[17], forced hydrolysis[18, 19], hydrothermal [20, 21], sonochemical[22], solution combustion[23], high-energy ball milling[24] etc. Among the above method, some of them are very expensive and required large time for the synthesis of final product. It is therefore essential that the synthesis route would facilitate for large scale synthesis of nanoparticles of
  -Fe2O3 in cost effective and easier manner.In this paper, we report the synthesis of
  -Fe2O3 nanoparticles using a simple low cost chemical route and studied the effect of thermal annealing on their the microstructure and optical absorption properties.
2. Experimental Methods
 -Fe2O3 nanoparticles were synthesized by chemical route using iron nitrate (Fe(NO3)3.9H2O) (MERCK, India) as starting material. In this procedure, homogeneous solutions of required amount of Fe(NO3)3.9H2O in distilled water was prepared with the help of magnetic stirrer. This solution was aged for 1 day and then dried at 100℃. Then the resultant product is calcined at 300℃ for 1 hour and then pressed into pellets. These pellets are annealed at 500, 600 and 700℃ for 1 hour in order to get
  -Fe2O3 nanoparticles used in the present study.The structural and microstructural evolutions of
  -Fe2O3 nanoparticles were studied by X-ray diffraction with CuK
  radiation using Bruker X-ray diffractometer (Model: D8 Advance). The optical absorption spectroscopy of
  -Fe2O3 nanoparticles were performed using diffuse reflectance spectroscopy by a double beam UV-Visible spectrophotometer (Simadzu, UV-2450) with an integrating sphere assembly.
3. Results and Discussion
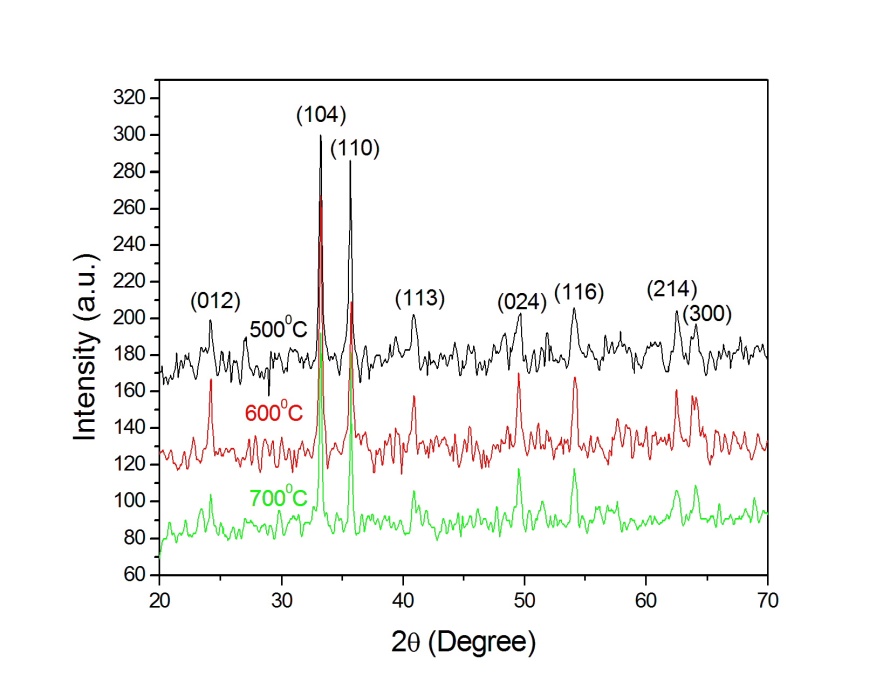 | Figure 1. XRD pattern of  -Fe2O3 nanoparticle annealed at different temperature -Fe2O3 nanoparticle annealed at different temperature |
 ) of
) of  -Fe2O3 and are well consistent with the JCPDS card (card no: 33-0664). In order to see the effect of annealing temperature on the microstructural properties we estimated the average crystallite size (
 ) and the strain (
 ) present in
  -Fe2O3 nanoparticles from the full width at half maximum (FWHM) of the first major XRD peak using the following equations[25]:
 | (1) |
 | (2) |
 is the FWHM,
  is the Bragg angle and
  is the wavelength of Cu K
 radiation. Figure 2 shows the variation of crystallite size and strain for
  -Fe2O3 nanoparticle annealed at different temperature. Crystallite size increased from ~ 34 to 44 nm when annealing temperature increased from 500 to 700℃. Increase of crystallite size for
  -Fe2O3 nanoparticles from ~ 18 to 54 nm was reported when the annealing temperature increased from 300 to 500℃[26]. So our samples contain relatively smaller crystallites even though we use higher annealing temperature. This behaviour may be reflected in the optical band gap of the sample which discussed later. The strain in our sample decreased with increasing annealing temperature. Our results indicated that the annealing is essential for synthesis of good crystalline stain free
 -Fe2O3 nanoparticles.
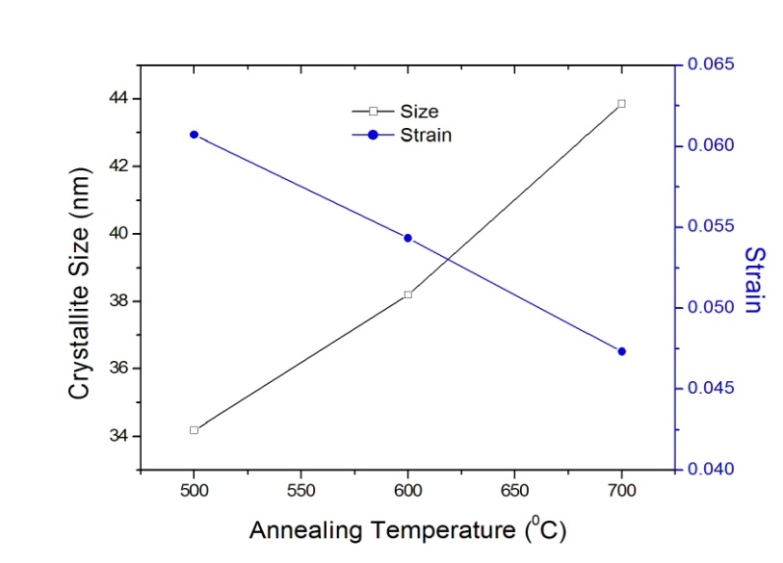 | Figure 2. Variation of crystallite size and strain for  -Fe2O3 nanoparticle annealed at different temperature -Fe2O3 nanoparticle annealed at different temperature |
 -Fe2O3 nanoparticles annealed at different temperature were estimated by using UV-Visible absorption spectroscopy. Figure 3 shows the variation of absorption coefficient,
  of
of  -Fe2O3 nanoparticles annealed at 500, 600 and 700℃ as a function of wavelength. The absorption intensity for all samples increased with decreasing wavelength due to nanocrystalline nature of the material[19]. It has reported that the absorption spectra of
  -Fe2O3 nanoparticles in the entire wavelength can be divided into 4 regions: region I (250–400 nm), region II (400-600 nm), region III (600-780 nm) and region IV (750-900 nm) based on different transitions[27]. Since in our case, absorption coefficient was recorded in the wavelength range 200-800 nm, we do not have much information about the region IV. It is worthy to mention that the absorption coefficients of Fe2O3nanocrystals in the range of 600-900 nm are minor[28].The absorption bands appeared in region I are due to the ligand-to-metal charge-transfer (LMCT) transitions (direct transitions) with combined contributions from the Fe3+ ligand field transitions 6A1(6S) to 4T1(4P) at 290–310 nm, 6A1(6S) to 4E(4D) and 6A1(6S) to 4T1(4D) at 360–380 nm[29, 30]. The absorption band in region II is associated with the double excitation processes 6A1(6S)+6A1(6S) to 4T1(4G)+4T1(4G) at 485–550 nm, and is most likely overlapped by the contributions of 6A1(6S) to 4E, 4A1(4G) ligand field transitions at 430 and the charge-transfer band tail[28, 29, 31]. This inter-band transition is primarily responsible for the red colour of hematite. Region III corresponds to the 6A1(6S) to 4T2(4G) ligand field transition at about 640 nm[28, 31]. The optical band gap was extracted according to the following relation[32]:
  | (3) |
 is the incident photon energy,
  is the absorption coefficient,
  is a materials dependent constant and
  is the optical band gap. The value of
  depends on the nature of transition. Depending on whether the transition is direct allowed, direct forbidden, indirect allowed or indirect forbidden, n takes the value 1/2, 3/2, 2 or 3 respectively[33]. The usual method of determining
  involves plotting
  vs.
vs.  . By extrapolating the linear portion of the
  vs.
vs.  plot to
  = 0, we can estimate the band gap from the absorption peak. Some reports indicated that
  -Fe2O3 is an indirect band gap material[34, 35] and some other reported the existence of direct band gap in
  -Fe2O3[36]. It has also been reported that
  -Fe2O3 exhibits both direct band gap and indirect band gaps[1, 2, 37, 38]. The spin forbidden Fe3+ 3d
 3d excitation gives rise to indirect transition and the direct transition corresponds to the O2- 2p
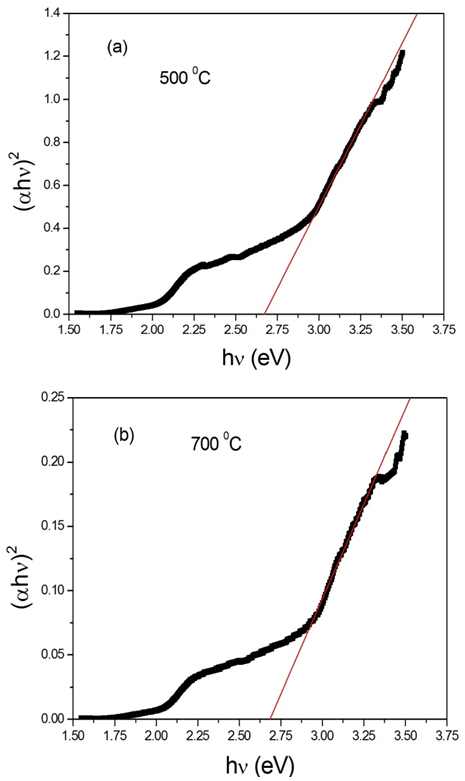
 Fe3+ 3d charge transfer[39, 40]. We therefore investigated the occurrence of both direct and indirect transitions in our case by plotting
 vs.
vs.  with n =1/2 (Fig. 4) and 2 (Fig. 5) respectively. The value of direct band gap for the sample annealed at all temperatures is ~ 2.67eV (Fig. 4). The observed values of direct band gaps in our case were in close agreement with the value (~ 2.65 eV) reported by Banerjee et al.[26]. The reported values of the indirect band gap for
  -Fe2O3 were varied from 1.38 to 2.09 eV[1, 2, 34, 35, 37, 38, 41]. The values of indirect band gap obtained from Fig. 5 for different annealed samples are in good agreement with the reported values. Unlike direct band gap, the indirect band gap increased from 1.6 to 1.94 eV when the annealing temperature increased from 500 to 600℃. The sample annealed at 700℃ exhibits indirect band gap at 1.93 eV. Similar type of observation has been reported by Al-Kuhaili et al.[2]. These authors have shown that the indirect band gaps increased when heated substrate is used during deposition whereas the direct band gaps did not show any variation. Our results are in agreement with the reported results[2].
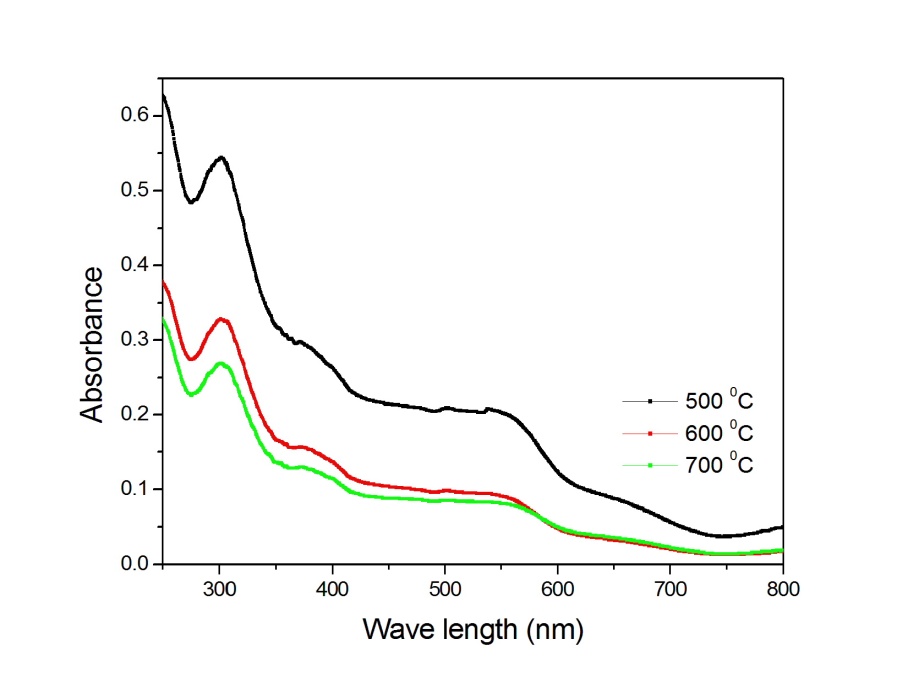 | Figure 3. Variation of absorption coefficient of  -Fe2O3 nanoparticles annealed at 500, 600 and 700℃ with wavelength -Fe2O3 nanoparticles annealed at 500, 600 and 700℃ with wavelength |
 | Figure 4. Variation of  vs. photon energy, vs. photon energy,  for for  nanoparticles annealed at (a) 500℃ and (b) 700℃ nanoparticles annealed at (a) 500℃ and (b) 700℃ |
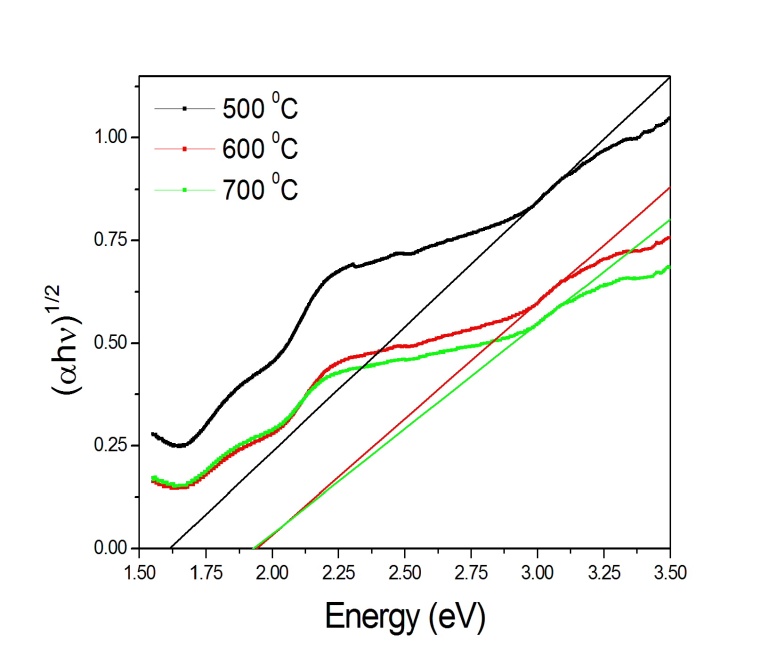 | Figure 5. Variation of  vs. photon energy, vs. photon energy,  for for  nanoparticles annealed at different temperatures nanoparticles annealed at different temperatures |
4. Conclusions
- We report the effect of thermal annealing on the microstructure, optical absorption properties of hematite nanoparticles synthesized by low cost chemical route. Crystallite size and strain present in the sample increased and decreased respectively with increasing the annealing temperature. UV-visible optical characterization of these samples indicated the existence of both direct band gap and indirect band gaps. The value of direct band gap for the sample annealed at all temperatures estimatedto be ~ 2.67 eV. The indirect band gap on the other hand increased from 1.6 to 1.94 eV when the annealing temperature increased from 500 to 600℃ and remained almost same for sample annealed at 700℃. The observed values of optical band gaps were in close agreement with the reported values. Our results indicated that the thermal annealing would give rise to well crystalline
 -Fe2O3 nanoparticles with reduced strain.
ACKNOWLEDGEMENTS
- The authors thank to Prof. N.C. Mishra, Utkal University, Bhubaneswar for his encouragement and also for providing Laboratory facility to carry out this work. DST, Govt. of India is acknowledged for proving XRD facility at Utkal University, Bhubaneswar under FIST programme.