M. Raghasudha1, D. Ravinder2, P. Veerasomaiah3
1Department of Chemistry, Jayaprakash Narayan College of Engineering, Mahabubnagar, 509001, Andhra Prdesh, India
2Department of Physics, Nizam College, Basheerbagh Osmania University, Hyderabad, 500001, India
3Department of Chemistry, Osmania University, Hyderabad, 500007, India
Correspondence to: D. Ravinder, Department of Physics, Nizam College, Basheerbagh Osmania University, Hyderabad, 500001, India.
| Email: |  |
Copyright © 2012 Scientific & Academic Publishing. All Rights Reserved.
Abstract
Nanoparticles of CoCrxFe2-xO4 with stoichiometric proportion x =0.0, 0.1, 0.3, 0.5, 0.7, 0.9 and 1.0 were prepared by the Citrate-gel auto combustion method. The samples were sintered at 500℃ for 4h in air. Structural characterization of sintered samples was carried out by X-ray diffraction and Fourier Transform infra-red spectroscopy (FTIR). X-ray diffraction studies of all the Chromium substituted Cobalt nano ferrites showed a homogeneous single phased cubic spinel with a crystallite size of the particles in the range of 6-12nm. FTIR spectra of samples under investigations reveal the formation of a single phase cubic spinel, showing two significant absorption bands. The high frequency band ( ) around 600 cm-1 is attributed to the intrinsic vibrations of tetrahedral complexes and the low frequency band (
 ) around 400cm-1 is due to octahedral complexes. The dielectric parameters such as dielectric constant (real and imaginary parts-
 and
and  ), loss tangent (tan
 ) and AC conductivity (
 ) for all the samples were studied as a function of frequency in the range of 20Hz to 2MHz at room temperature using Agilent E4980A Precesion LCR meter. The dielectric constant, loss tangent and AC conductivity shows a normal dielectric behavior with frequency which reveals that the dispersion is due to the Maxwell-Wagner type interfacial polarization in general and hopping of charge between Fe2+ and Fe3+. A qulitative explanation is given for composition and frequency dependance of the dielectric constnat, dielectric loss tangent and AC conductivity of the nano ferrite. A relaxation peak was observed in the loss tangent property of nano ferrite sample with composition CoCr0.1Fe1.9O4 . The loss tangent for the synthesized samples was found to be decreased from 0.062 to 0.055 in higher frequency region showing the potential applications of these materials in high frequency micro wave devices. On the basis of these results the explanation of dielectric mechanism in Co-Cr nano ferrites is suggested.
Keywords:
Co-Cr Nano Ferrites, Citrate-gel Technique, X-ray Diffraction, FTIR Spectroscopy, Dielectric Parameters, LCR Meter
Cite this paper: M. Raghasudha, D. Ravinder, P. Veerasomaiah, FTIR Studies and Dielectric Properties of Cr Substituted Cobalt Nano Ferrites Synthesized by Citrate-Gel Method, Nanoscience and Nanotechnology, Vol. 3 No. 5, 2013, pp. 105-114. doi: 10.5923/j.nn.20130305.01.
1. Introduction
Polycrystalline ferrites are very good dielectric materials and have many technological applications ranging from microwave to radio frequencies[1]. One important characteristic of ferrites is their high values of resistivity, low magnetic and dielectric losses[2] which make them ideal for high frequency applications. Synthesis of nanoferrites, especially spinel ferrites, characterized by a low size distribution is important due to their remarkable electrical and magnetic properties and wide practical applications in information storage systems, ferrofluid technology, magnetocaloric refrigeration and medical diagnostics[3,4]. Owing to the dielectric behavior, they are sometimes called multiferroics. They are commercially important because they can be used in, many devices such as Phase Shifter, high frequency transformer cores, switches, resonators, computers, TVs and mobile phones[5,6]. Among spinel ferrites nanocrystalline Cobalt spinel ferrites with cubic (FCC) structure are significant due to their high electrical resistivity, good chemical stability and mechanical hardness [7]. The electrical properties of ferrites depend upon several factors including the route of preparation, composition of constituents, grain structure or size and the amount and type of substitution[8]. Most of the time, replacement of Fe3+ with trivalent cations like Al3+, Cr3+ etc in cobalt is required to attain specific objectives (increase of resistivity, decreasing saturation magnetization and the high temperature applications)[9]. These facts motivated us to investigate the dielectric behavior of Cobalt ferrites over a wide range of frequencies at room temperature. In this study, we prepared nano sized CoCrxFe2-xO4 compounds containing different levels of Cr with the assumption that dielectric properties would be improved by substitution of Fe3+ ions with Cr3+ ions by citrate-gel auto combustion method. Here, Citrate gel method is preferred as it offers many advantages over the other conventional methods such as low temperature processing and better homogeneity for the synthesis, production of ultra fine particles with a narrow size distribution, short processing time, low sintering temperature etc. Substitution of Cobalt Ferrites with Cr3+ ions at B site should be effective in enhancing the electrical resistivity. In the present work the aim of Cr3+ ion substitution for Fe3+ ions is to reduce dielectric loss. In this article we report the influence of Cr substitution on structural and dielectric properties of CoCrxFe2-xO4 ferrites synthesized by Citrate - gel auto combustion method as a function of frequency and composition at room temperature.
2. Experimental
2.1. Materials of Co-Cr Ferrites
Ferrites with chemical formula CoCrxFe2-xO4 (x= 0.0, 0.1, 0.3, 0.5, 0.7, 0.9 and 1.0) have been prepared by the Citrate-gel auto combustion method using Cobaltous Nitrate-(Co(NO3)26H2O) (SDFCL-sd fine Chem. Limited, 99% pure AR grade), Ferric Nitrate-(Fe(NO3)29H2O)( Otto Chemie Pvt. Limited, 98% pure GR grade), Chromium Nitrate - (Cr(NO3)29H2O)(Otto Chemie Pvt. Limited, 98% pure GR grade), Citric acid - (C6H8O7.H2O) (SDFCL-sd fine Chem. Limited, 99% pure AR grade), Ammonia - (NH3) (SDFCL-sd fine Chem. Limited, 99% pure AR grade) as starting materials for the synthesis.
2.2. Synthesis
Required quantities of metal nitrates were dissolved in a minimum quantity of distilled water and mixed together. Aqueous solution of Citric acid was then added to the mixed metal nitrate solution. Ammonia solution was then added with constant stirring to maintain PH of the solution at 7. The resulting solution was continuously heated on the hot plate at 100℃ upto dryness with continuous stirring. A viscous gel has resulted. Increasing the temperature upto 200℃ lead the ignition of gel. The dried gel burnt completely in a self propagating combustion manner to form a loose powder. The burnt powder was ground in Agate Mortor and Pistle to get a fine Ferrite powder. Finally the burnt powder was calcined in air at 500℃ temperature for four hours and cooled to room temperature.
2.3. Characterization
The structural characterization of the synthesized samples was carried out by Phillips X ray diffractometer (model 3710) using Cu Kα radiation (λ=1.5405A0) at room temperature by continuous scanning in the range of 2θ0 to 85 θ0 to investigate the phase and crystallite size.The infra red spectra of synthesized Co-Cr nano-ferrite powders (as pellets in KBr) were recorded by SHIMADZU Fourier Transform Infrared Spectrophotometer (model P/N-206-73500-38) in the range of 400 to 800 cm-1 with a resolution of 1cm-1 which confirms the formation of a single phase cubic spinel.For dielectric measurements the powders were added with a small amount 2% PVA as a binder to press the powders into circular pellets of diameter 13mm and thickness 1mm applying a pressure of 5 tons. The prepared pellets were sintered at 500℃ for four hours in air in muffle furnace for the densification of the sample. For dielectric measurements silver paint was applied on both sides of the pellets and air dried to have good ohmic contact. The dielectric measurements were made using Agilent E4980A Precesion LCR meter at room temperature in the frequency range 20Hz to 2MHz.Using LCR meter the dielectric parameters such as Capacitance of the pellet, tan δ (loss tangent) and Capacitance of air with the same thickness as the pellet were measured. The real part of the dielectric constant (ε') was determined from the following formula[10]. where ε'= Real part of dielectric constant Cp = Capacitance of the Pellet in FaradayCAir = Capacitance of Air in FaradayThe imaginary part of the dielectric constant (ε") or dielectric loss was measured by using the following relation[11]
 The ac conductivity was calculated using the values of frequency (f) and loss tangent factor as[11]
 Where ε0=Constant permittivity of free space = 8.854x10⁻¹² F/mε'= Real part of dielectric constanttan δ = loss tangent
3. Results and Discussions
3.1. XRD Analysis
The X-ray diffraction patterns of all the samples were shown in Figure 1. XRD patterns and the crystalline phases were identified by comparison with reference data from the ICSD card No. 22-1086 for Cobalt ferrites (CoFe2O4). The XRD patterns of all the Chromium substituted Cobalt ferrites showed a homogeneous single phased cubic spinel belonging to the space group Fd3m (confirmed by ICSD Ref 22-1086). The X-ray diffraction patterns of all the samples were shown in Figure 1. XRD patterns and the crystalline phases were identified by comparison with reference data from the ICSD card No. 22-1086 for Cobalt ferrites (CoFe2O4). The XRD patterns of all the Chromium substituted Cobalt ferrites showed a homogeneous single phased cubic spinel belonging to the space group Fd3m (confirmed by ICSD Ref 22-1086) with a crystallite size in the range of 6-12nm as reported in our earlier publication[12].
3.2. FTIR Spectroscopic Analysis
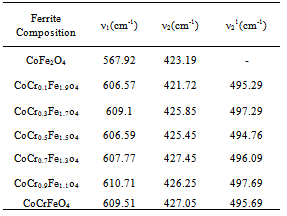
FT-IR spectroscopic analysis is an additional tool for the structural characterization. The formation of the spinel structure of Co-Cr ferrite system is supported by FT-IR analysis. FTIR spectra of the prepared ferrite nano particles measured in the frequency range of 400cm-1 to 800 cm-1 are shown in Figure-2. Two prominent absorption bands ν1 and ν2 corresponding to the stretching vibration of the tetrahedral and octahedral sites around 600 and 400cm-1 respectively were observed. These absorption bands represent characteristic features of spinel ferrites in single phase. The difference between ν1 and ν2 is due to the changes in bond length of Fe-O at the Octahedral and Tetrahedral sites. The FT-IR spectroscopic results are summarized in Table- 1. From the table it is clear that the high frequency band (ν1) lies in the range of 567 to 610cm-1 while a significant change was observed in ν2 band by Cr substitution corresponding to octahedral site. It is observed that the ν2 band (octahedral site) lies in the range of 421 to 427cm-1 and has a subsidiary band ν21in the range of 494 to 497cm-1, for all the samples except for pure Co ferrite. This may be due to John-Teller distortion produced by doping Cr+3 which has been reported earlier[13]. Waldron[14] and Hafner[15] have studied the vibrational spectra of ferrites and attributed the high frequency band (v1) at around 600cm-1 to the tetrahedral site A and low frequency band (v2) at around 400cm-1 to the octahedral site.Table 1. FTIR parameters of Co - Cr nano ferrites
 |
| |
|
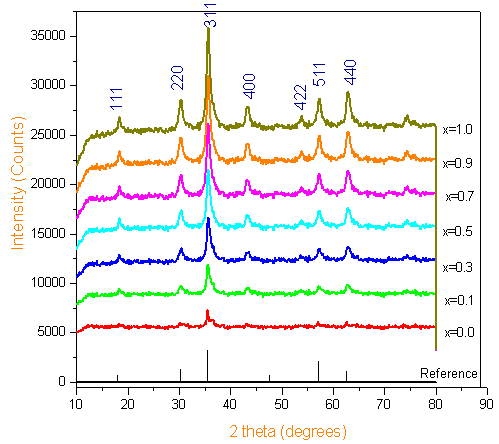 | Figure 1. XRD Patterns of Co-Cr ferrites calcined at 500℃ |
3.3. Dielectric Properties
3.3.1. Dielectric Constant (ε' and ε")
The dielectric properties of ferrites strongly depend on several factors, including the method of preparation, chemical composition and grain size. The frequency dependence of the real and imaginary part of dielectric constant (ε' and ε") for all the samples was studied at room temperature in the range of 20Hz to 2MHz. Figure 3 and 4 depicts the variation of the real and imaginary part of the dielectric constant (ε' and ε") as a function of frequency for mixed ferrites CoCrxFe2-xO4 with different compositions (x= 0.0, 0.1, 0.3, 0.5, 0.7, 0.9 and 1.0). It is observed that all the samples have higher dielectric constant at lower frequency and there is a decreasing trend in value with increasing frequency which is a normal behavior of ferromagnetic materials. The decrease in ε' is sharp initially from 20Hz to 1000Hz (lower frequency) and then ε' value decreases slowly with the increase in frequency and showed almost frequency independent behavior at high frequency regions[16]. Similar behavior was observed in our publications on Mg-Zn Ferrites (Ravinder and Latha, 1999), Li-Cd ferrites (Radha and Ravinder, 1995) and Mg-Cr nano ferrites (Raghasudha and Ravinder, 2013). 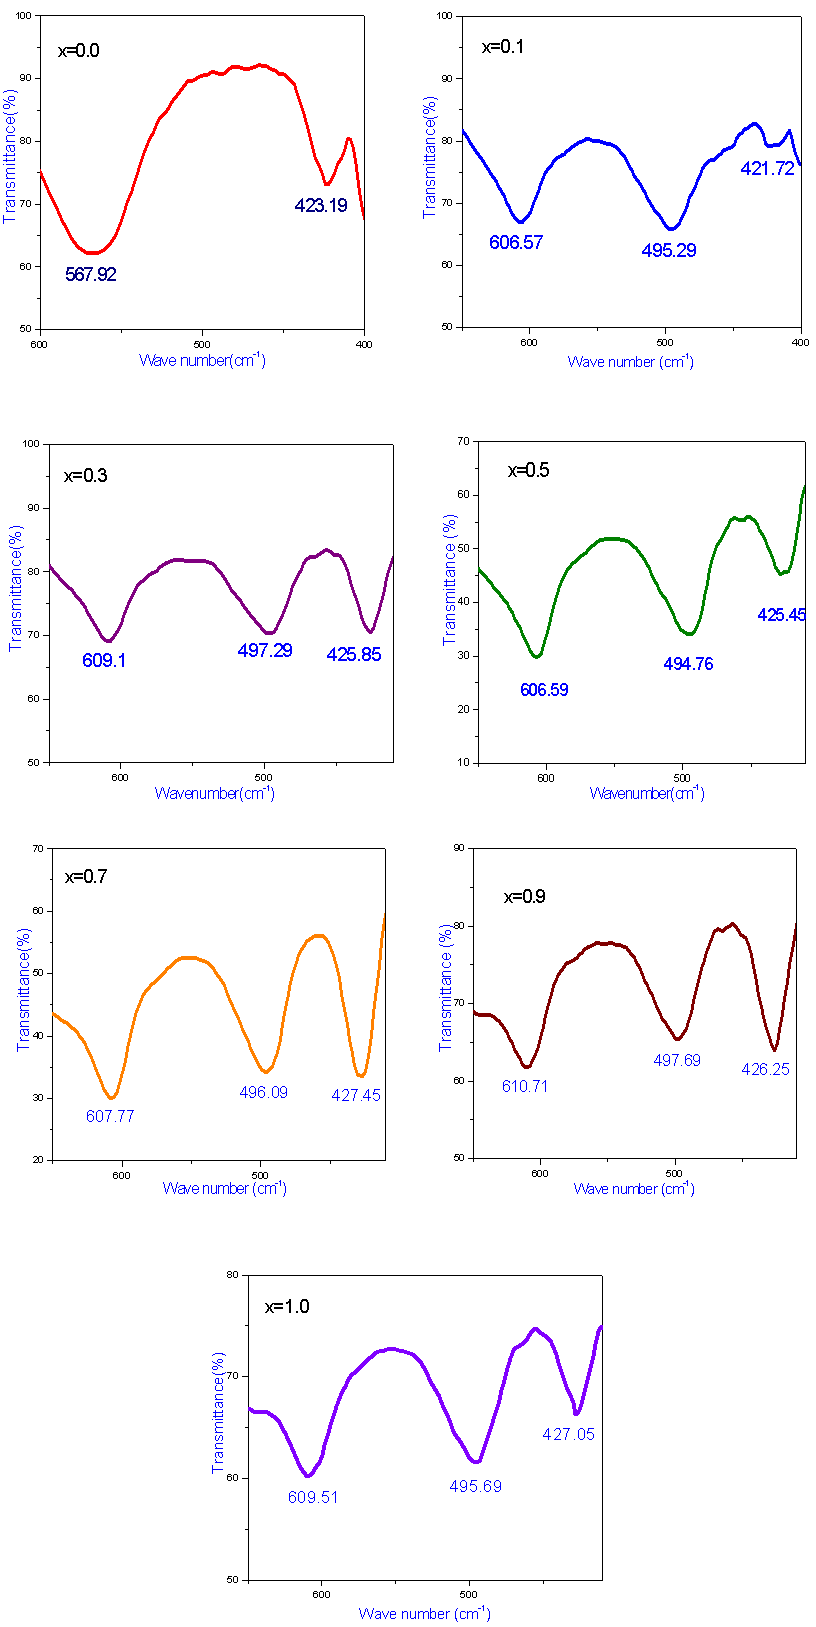 | Figure 2. FTIR patterns of Co-Cr ferrites |
The data revealed that none of the samples exhibit any anomalous behavior of peaking. The variation of dielectric constant with frequency may be explained on the basis of space-charge polarization phenomenon[17]. According to this, dielectric material has well conducting grains separated by highly resistive grain boundaries. On the application of electric field, space charge accumulates at the grain boundaries and voltage drops mainly at grain boundaries[18]. Koops proposed that grain boundary affect is more at low frequencies[18]. As the frequency increased beyond a certain limit the electron exchange between Fe2+ and Fe3+ ions does not follow the variations in applied field, so the value of dielectric constant becomes constant. According to Maxwell and Wagner[19, 20] two layer model, the dielectric structure of ferrite material is assumed to be made of two layers. First layer being a conducting layer consisting of large conducting ferrite grains separated by the other thin poorly conducting intermediate grain boundaries.Rabinkin and Novikova[21] pointed out that polarization in ferrites is through a mechanism similar to the conduction process. The electron exchange between Fe2+ and Fe3+ ions results in local displacement of electrons in the direction of applied field that determines polarization. The Polarization decreases with increasing frequency, and then reaches a constant value. It is due the fact that beyond a certain frequency of external field, the electron exchange Fe2+↔Fe3+ cannot follow the alternating field. The high value of dielectric constant at lower frequency is due to the predominance of the species like Fe2+ ions, oxygen vacancies, grain boundary defects, etc[19] while the decrease in dielectric constant with frequency is natural that is any species contributing to the polarizability is found to show the applied field lagging behind at higher frequencies[22].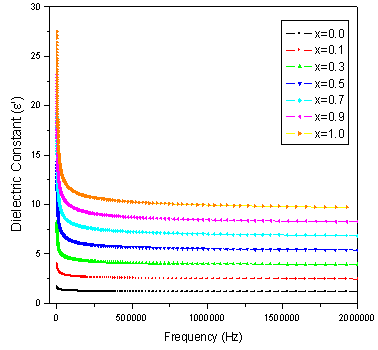 | Figure 3. Variation of real part of dielectric constant (ε') with frequency (f) |
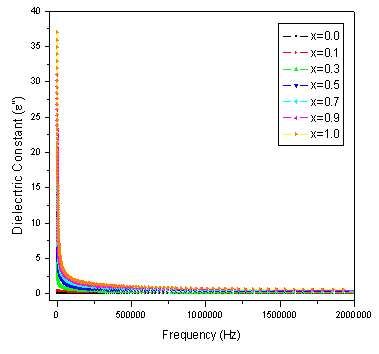 | Figure 4. Variation of imaginary part of dielectric constant (ε") with frequency (f) |
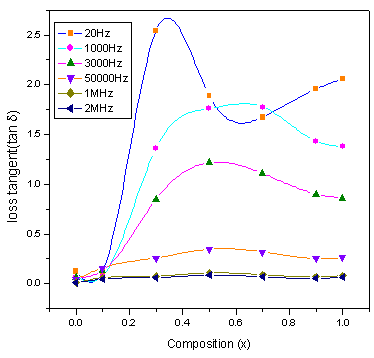
3.3.2. Loss Tangent (tan δ)
The value of tan δ measures the loss of electrical energy from the applied electric field into the samples at different frequencies. It is observed that the tan δ shows a decreasing trend with increasing in frequency. The loss tangent (tan δ) is defined as the ratio of the loss or resistive current to the charging current in sample. Also it is known that there is strong correlation, between the conduction mechanism and the dielectric constant behavior (Polarization mechanism) in ferrites. Variation of tan δ (the loss tangent) as a function of frequency (20Hz to 2MHz) at room temperature for all compositions is shown in Figure.5. It is observed that the tan δ showed a decreasing trend with increase in frequency which is normal behavior of any ferrite materials. All the samples showed normal behavior except x=0.1 (shown in the inset of fig.5). In case of Co-Cr ferrite with x=0.1 composition normal behavior is observed up to 1000Hz and after that the peaking behavior is observed up to 15000Hz. This type of peaking behavior (Debye-type relaxation) is observed when the jumping frequency of the Fe+2 and Fe+3 ions is exactly equal to the frequency of the applied field[17] i.e.ωτ= 1Where τ is the relaxation time of hopping process and ω is the angular frequency of the field ( ). The values of dielectric loss tangent decrease from 0.062 (x=0.3) to 0.055 (x=0.9) at 2 MHz . This shows that with increase in Cr concentration the energy losses decrease at high frequencies. The low loss values at higher frequencies show the potential applications of these materials in high frequency micro wave devices. From the figure it is clear that the loss decreases rapidly in the low frequency region while the rate of decrease is slow in high-frequency region and it shows an almost frequency independent behavior in high frequency region. The behavior can be explained on the basis that in the low frequency region, which corresponds to a high resistivity (due to the grain boundary), more energy is required for electron exchange between Fe2+ and Fe3+ ions, as a result the loss is high. In the high frequency region, which corresponds to a low resistivity (due to the grains), small energy is required for electron transfer between the two Fe ions at the octahedral site. Moreover, the dielectric loss factor also depends on a number of factors such as stoichiometry, Fe2+ content, and structural homogeneity which in turn depend upon the composition and sintering temperature of the samples[23].
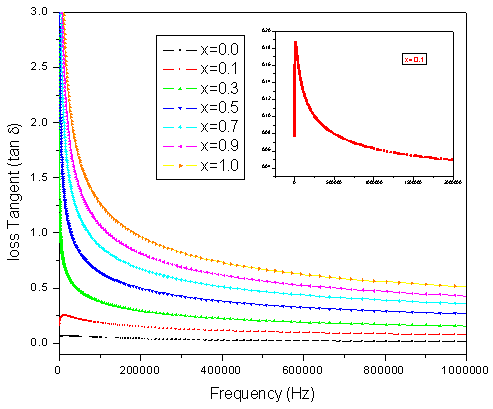 | Figure 5. Variation of loss tangent (tan δ) with frequency |
3.3.3. AC Conductivity (σAC)
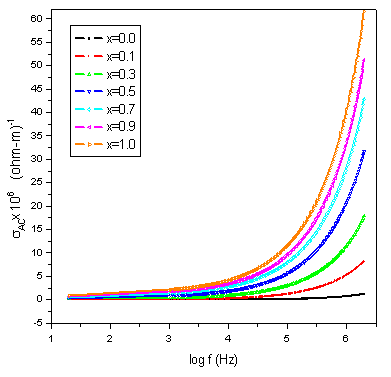 | Figure 6. Variation of AC conductivity with log f |
Conductivity is the physical property of a material which characterizes the conducting power inside the material. The electrical conductivity in ferrites is mainly due to the hopping of electrons between the ions of the same element present in more than one valence state. Figure.6 shows the variation of the AC conductivity (σAC) of mixed Co-Cr ferrites of all compositions as a function of frequency in the range of 20Hz to 2MHz at room temperature. At low frequency range the AC conductivity was nearly independent of the frequency and showed an increasing trend with increase in frequency for all the samples. This behavior is akin to Maxwell-Wagner type. The dielectric structure of ferrites is given by Koops phenominologics theory and Maxwell-Wagner theory[24, 18]. At lower frequencies the conductivity was found low due to the grain boundaries that are more active which acts as hindrance for mobility of charge carriers and hence the hopping of Fe2+ and Fe3+ ions is less at lower frequencies. As the frequency of applied field is increased, the conductive grains become more active thereby promoting the hopping between Fe2+ and Fe3+ ions and also responsible for creating charge carriers from different centers. These charge carriers take part in the conduction phenomenon thereby increasing the AC conductivity. The linear increase in conductivity was observed with frequency that confirms the polaron type of conduction. The frequency dependent conduction is attributed to small polarons[25]. At higher frequency where conductivity increases greatly with frequency, the transport is dominated by contributions from hopping infinite clusters. Finally, low values of conductivity around room temperature indicate that the studied compositions may be good candidates for the microwave applications that require negligible eddy currents[26].
3.3.4. Compositional Dependence of Dielectric Parameters (ε', ε", tan δ and σAC)
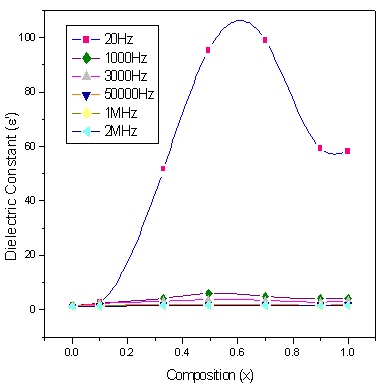 | Figure 7. Variation of ε' with composition at selected frequencies |
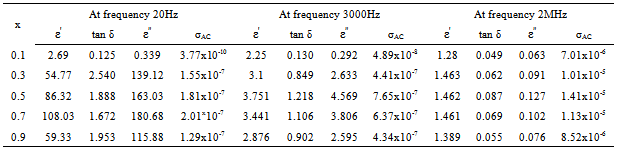
Figures.7,8,9,10 represents the variation of dielectric parameters (ε', ε", tan δ and σAC) as a function of Cr composition at selected frequencies (20Hz, 1000Hz, 3000Hz, 50000Hz, 1MHz and 2MHz) respectively. It can be seen that all the dielectric parameters ε', ε", tan δ and σAC increase upto50% of Cr doping, thereafter, these parameters decrease with further doping of Cr which is clear from Table .1.It shows the values of dielectric parameters for different compositions of the Co-Cr ferrite system at particular frequencies. The increase in dielectric constant up to x=0.5 may be due to the formation of Fe3+ ions on octahedral sites. This typical behavior can be explained on the basis that in Cr containing ferrites, Cr ions prefer to occupy the octahedral coordination until the ratio of Cr substitution becomes greater than 60%, where after, Cr ions may increase in tetrahedral sites causing migration of equal number ions to the octahedral sites[27].The behavior can be explained by assuming that the mechanism of dielectric polarization is similar to that of the conduction in ferrites. (Robinkin and Novikova 1960). They observed that the electronic exchange interaction between Fe2+↔Fe3+ results in local displacement of the electrons in the direction of an electric field which determines the polarization of ferrites. The presence of Fe2+ ions in excess amount favors the polarization effect[28]. Thus more dispersion was observed in the sample with low Cr3+ ion substitution. This is because at low Cr3+ concentration the presence of Fe2+ ions is in excess amount. As the Cr3+ ion substitution increased it occupies the octahedral site in the ferrite system, thereby decreasing the number of Fe3+ ions and there is a least possibility of electronic exchange interaction between Fe2+↔Fe3+, which results in decrease in dielectric parameters with increasing Cr content in the present system. Table 2 shows the values of dielectric parameters for different compositions of the Co-Cr ferrite system at selected frequencies.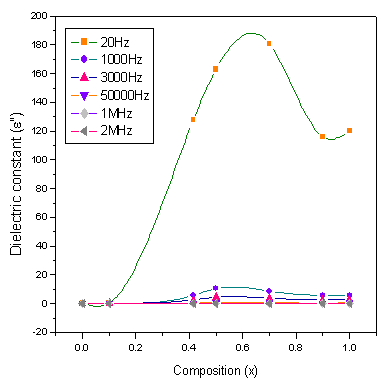 | Figure 8. Variation of ε" with composition at selected frequencies |
 | Figure 9. Variation of tan δ with composition at selected Frequencies |
Table 2. Dielectric parameters of different compositions of CoCrxFe2-xO4 at selected frequencies (20Hz, 3000Hz and MHz)
 |
| |
|
4. Conclusions
• We have successfully synthesized single phase CoCrxFe2-xO4 nano ferrites with cubic spinel structure through Citrate-gel auto combustion method with very fine crystallite size.• FTIR absorption spectra of the compositions under investigations reveal the formation of a single phase cubic spinel, showing two significant absorption bands. The high frequency band (ν1) around 600 cm-1 is attributed to the intrinsic vibrations of tetrahedral complexes and the low frequency band (ν2) around 400 cm-1 is due to octahedral complexes. The spectra showed the characteristic peaks of ferrite sample.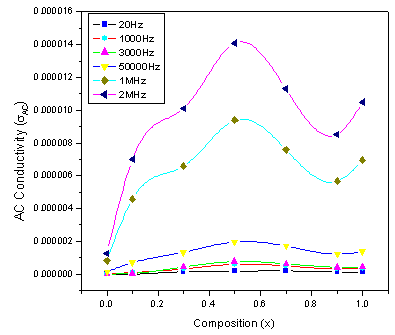 | Figure 10. Variation of σAC with composition at selected frequencies |
• A normal dispersion in dielectric parameters (ε', ε", tan δ) with frequency was observed for all samples and this has been explained on the basis of space charge polarization mechanism as discussed in Maxwell-Wagner model.• AC conductivity measurement indicates that with increase in Cr3+ substitution in Co-Cr nano ferrites, AC conductivity increases linearly with frequency which suggest that the conduction in the present system may be due to the polaron hopping mechanism.• Low values of conductivity around room temperature indicate that the studied compositions may be good candidates for the microwave applications that require negligible eddy currents.• All the samples showed a decreasing trend in tan δ with increase in frequency which is normal behavior of any ferrite materials. In case of Co-Cr ferrite with x=0.1 composition normal behavior is observed upto 1000Hz and after that the peaking behavior is observed upto 15000Hz. This type of peaking behavior (Debye-type relaxation) is observed when the jumping frequency of the Fe+2 and Fe+3 ions is exactly equal to the frequency of the applied field. • The values of dielectric loss tangent decrease from 0.062 (x=0.3) to 0.055(x=0.9) at 2 MHz. This shows that with increase in Cr concentration in Co-Cr nano ferrites the energy losses decrease at high frequencies. The low loss values at higher frequencies show the potential applications of these materials in high frequency micro wave devices.
ACKNOWLEDGEMENTS
One of the authors (MRS) is grateful to K.S. Ravikumar, Chairman, Jayaprakash Narayan College of Engineering, Mahabunagar (Dist) for his support and continuous encouragement in carrying out research work. She is also thankful to Prof. R. Ramesh Reddy, Principal Jaya Prakash Narayan college of Engineering for his motivation towards research activity. One of the authors (D.R) is grateful to Prof. T.L.N. Swamy, Principal Nizam College for his encouragement to carry out this research work. The authors are thankful to Prof. C. Gyana Kumari, Head, Department of Chemistry, Osmania University, Hyderbad for her encouragement in carrying out the research activities.
References
| [1] | Kharabe R G, Devan R S, Kamadi CM and Chougule B K, Smart Material Structures. 15 N, 36 (2006). |
| [2] | Y. Yamamoto, J. Makino, Journal of Magnetism and Magnetic Materials.133, 500 (1994). |
| [3] | A.K. Giri. E.M. Kirkpartrick, P. Moongkhamllang, S.A. Majetich, Journal of Applied Physics Letters. 80, 2341(2002). |
| [4] | A.K. Giri, K. Pellerin, W. Pongsakswad, M. Sorescu, S. Majetich, IEEE Transanctions on Magnetics. 36, 3029 (2000) |
| [5] | J. Smit, H.P.G. Wijn, Ferrites. 136 (1959). |
| [6] | M. Sugimoto, Journal of Ceramic American Society, 82, 2, 269 (1999). |
| [7] | A.M. Ibrahim, M.M. Abd El-latif, M.M. Mahmoud., Journal of Alloys and Compounds 506, 201(2010). |
| [8] | K. Kondo, T. Chiba, S. Yamada, Journal of Magnetism and Magnetic Materials 541, 254(2003). |
| [9] | R.C. Kambale.N.R. Adhate, B.K. Chougule, Y.d. Kolekar, journal of Alloys and Compounds 507 372-377 (2010). |
| [10] | Dr. S.L. Gupta, Sanjeev Gupta, “Electricity, Magnetism and Electronics”, First Edition, Jaiprakash Nath and Company. 1, 60(1991). |
| [11] | Erum Pervaiz, I.H. Gul, Journal of Magnetism and Magnetic Materials, 324, 3695-3703 (2012). |
| [12] | M. Raghasudha, D. Ravinder, P. Veerasomaiah, Advances in Materials Physics and Chemistry. 3, 89-96 (2013). |
| [13] | V.A. Potakova, W.D. Zverv and V.P. Romanov, Physics Status Solidi (A). 12, 623 (1972) |
| [14] | R.D. Waldron, Physics Revision .99, 1727 (1955). |
| [15] | Sr. Hafner, Z. Krist. 115, 331 (1961) |
| [16] | Chandra Babu.B,Naresh. V, Jayaprakash. B, Buddhudu. S, Ferro Electrics letter.38, 124 (2011). |
| [17] | N. Rezlescu, E. Rezlescu, Physics Status Solidi A, 23, 575 (1974). |
| [18] | I.H. Gul, A. Maqsood, M. Naeem, M. Naeem Ashiq, Journal of alloys and compounds. 507,201 (2010). |
| [19] | J.C. Maxwell, Electricity and Magnetism, 1, Oxford University Press, Oxford, (section 328) (1929). |
| [20] | K.W. Wagner, American Physics. 40, 317(1973). |
| [21] | I.T. Rabinkin, Z.I. Novikova, Ferrites, IZV Acad. Nauk USSR Minsk, (1960) |
| [22] | B. Baruwati, K.M. Reddy, V. Sunkara, R.K. Manorama, O. Singh, J. Prakash, Applied Physics Letters, 85, (14), (2004 ). |
| [23] | Devan RS, Chougule BK, Journal of Applied Physics, 101:014109 (2007) |
| [24] | Koops, CG, Physics Revision, 83, 121(1951) |
| [25] | Alder D and Fienleib. Journal Physics Revision B. 2, 3112(1970). |
| [26] | M.A. Elkestawy, Journal of Alloys and Compounds 492 616-620 (2010). |
| [27] | D. Elkony, Egypt, Journal of solids, Vol.27 (2), 285 2004 |
| [28] | Sagar.E.Shirsath, B.G. Toksh, Mahesh Kumar L. Mane, V.N. Dhage, D.R. Shengule, K.M. Jadhav, Powder Technology. 212, .218-223 (2011) |
 Abstract
 Reference
 Full-Text PDF
 Full-text HTML