-
Paper Information
- Next Paper
- Previous Paper
- Paper Submission
-
Journal Information
- About This Journal
- Editorial Board
- Current Issue
- Archive
- Author Guidelines
- Contact Us
Nanoscience and Nanotechnology
p-ISSN: 2163-257X e-ISSN: 2163-2588
2013; 3(3): 52-55
doi:10.5923/j.nn.20130303.04
Effect of CuO Addition on the Structural and Optical Properties of NiO Nanoparticles
 Abstract
 Reference
 Full-Text PDF
 Full-text HTML
P. Mallick, C. S. Sahoo
Department of Physics, North Orissa University, Baripada 757003, India
Correspondence to: P. Mallick, Department of Physics, North Orissa University, Baripada 757003, India.
| Email: |  |
Copyright © 2012 Scientific & Academic Publishing. All Rights Reserved.
NiO and CuO nanoparticles were synthesized by sol-gel method from nickel nitrate and copper nitrate respectively. For the synthesis processes, respective nitrate is used as precursor and ethanol is used as solvent. The obtained gels were dried at 300℃. The dried gels of both the samples were mixed into 1:1 ratio and ground thoroughly. The pressed pellet of the mixture is subjected to calcinations at 500℃ in order to achieve NiO/CuO nanocomposite. Structural and optical characterizations of the NiO/CuO nanocomposite were investigated by using XRD and UV-Visible spectrophotometer respectively. The crystallite size in pure NiO was decreased from 20 nm to ~17 nm and the strain increased from 0.18% to 0.23% when the same formed nanocomposite with CuO. Urbach energy estimated from UV-Visible spectra increased from 0.548 eV in pure NiO to 0.795 eV in NiO/CuO nanocomposite. This indicates CuO induced disorder in the NiO/CuO nanocomposite sample. Our study thus confirms that by making nanocomposite with CuO has influenced significantly on the crystallite size and strain of NiO nanoparticles.
Keywords: Nanoparticle, NiO, Nanocomposite, Sol-gel, UV-Visible Spectroscopy
Cite this paper: P. Mallick, C. S. Sahoo, Effect of CuO Addition on the Structural and Optical Properties of NiO Nanoparticles, Nanoscience and Nanotechnology, Vol. 3 No. 3, 2013, pp. 52-55. doi: 10.5923/j.nn.20130303.04.
Article Outline
1. Introduction
- The expansion from single-component material to composite systems becomes an active area of research because different composites offer great possibilities for tailoring the performance of the final product[1]. In recent years, nanoscale transition metal oxides (TMOs) have been intensively studied due to their different potential applications. As compared to other TMOs, the Nickel oxide (NiO) is an attractive material well known for its chemical stability. NiO making composite with different oxide materials increased interest because of their unique properties. For example: ZnO/NiO nanocomposite exhibit high conductivity and a dual catalytic functionality in both the cathode and the anode[2], protective performance of polyurethane paint improves with increasing the content of NiO based nanocomposite[3] etc.In the present study, we synthesized NiO/CuO nanocomposite by cost effective sol-gel route and studied the evolution of structure, microstructure and optical absorption property of NiO/CuO nanocomposite. The aim of this study is to see the effect of CuO on the structure, microstructure and optical absorption property of NiO nanoparticles.
2. Experimental Methods
- NiO nanoparticles were synthesized by sol-gel method[4]. For the synthesis processes, Ni(NO3).6H2O is used as precursor and ethanol is used as solvent. Homogeneous solution of nickel nitrate in ethanol was prepared using magnetic stirrer and kept for 1 day for gel formation. The obtained gels were dried at 100℃. The dried gel is calcined at 300℃. For the synthesis of CuO, Cu(NO3). 3H2O is used as raw material instead of Ni(NO3 ).6H2O which is used for the synthesis of NiO. The calcined gels of each material was mixed into 1:1 weight ratio and then grounded properly for getting homogeneous mixture. Then the pellet out of the mixtures was prepared and the pellet was then annealed at 500℃ in order to get the NiO/CuO nanocomposite. The structural and optical properties of the NiO nanoparticles were studied by using Bruker X-ray diffractometer (D8 Advace) and UV-Visible spectrophotometer (Simadzu, UV-2450) respectively.
3. Results and Discussion
- Figure 1 shows the XRD pattern of NiO/CuO nanocomposite. Bragg peaks present in the XRD pattern are due to NiO and CuO nanoparticles only. No other impurity phases are present in the XRD pattern indicating the synthesis of good NiO/CuO nanocomposite material. NiO nanoparticles show Bragg planes of (111), (200), (220), (311) and (222) from lower angle to higher angles respectively indicating the formation of fcc structures of bulk NiO[4]. These planes of NiO are marked with *. The other XRD peaks are matched and indexed well with the reported peaks of CuO nanoparticles[5]. The lattice parameter (
 ) of NiO nanoparticles in the present case is ~ 0.4173 nm which is slightly smaller than that obtained for NiO nanoparticles (0.4179 nm) without CuO inclusion. In order to see the effect of CuO nanoparticles on the microstructural properties (like size, strain etc.) of the NiO, we have estimated the average crystallite size (
 ) and the strain (
 ) present in NiO sample from the full width at half maximum (FWHM) of the XRD peaks by using the following equations[6]:
  | (1) |
 | (2) |
 is the FWHM,
  is the Bragg angle and
  is the wavelength of Cu K
  radiation. The values of and
  estimated from XRD line width were about 17 nm and 0.24 % respectively for the NiO/CuO nanocomposites. These values (
 and
and  ) calculated for pure NiO were found to be ~ 20 nm and 0.18 % respectively[4]. The present study thus indicated that the lattice parameter and crystallite size are decreased and the strain is increased in NiO when it formed composite with CuO. This may be due to the accumulation of CuO on the grain boundary of NiO which inhibit the crystal growth and leads to strain generation in NiO grains.
  | Figure 1. X-ray diffraction pattern of NiO/CuO nanocomposite. The peaks are indexed with (h, k, l) for CuO nanparticles and the peaks marked with * for NiO |
 of NiO nanoparticles as a function of wavelength is shown in Fig. 2. It is also clearly seen from the figure that the absorption coefficient tends to decrease exponentially as the wavelength increases like the case of pure NiO nanoparticles[4]. This behaviour is typical for many semiconductors and can occur for a variety of reasons, such as internal electric fields within the crystal, deformation of lattice due to strain caused by imperfection and inelastic scattering of charge carriers by phonons[7-9].
 | Figure 2. Variation of absorption coefficient of NiO/CuO nanocomposite as a function of wavelength |
 | (3) |
 is the incident photon energy,
  is the absorption coefficient,
  is a materials dependent constant and
  is the optical band gap. The value of
  depends on the nature of transition. Depending on whether the transition is direct allowed, direct forbidden, indirect allowed or indirect forbidden, n takes the value 1/2, 3/2, 2 or 3 respectively[9]. The usual method of determining
  involves plotting
  vs.
vs.  . One can estimate the optical absorption band from the absorption spectra by extrapolating the linear portion of the
  vs.
vs.  plot to
  = 0. Figure 3 shows the variation of
  vs. photon energy,
  for NiO nanoparticles for n values of 1/2 and 2. This n values indicate the direct (for n = 1/2) and indirect (for n = 2) optical transitions[11]. The UV-Visible study thus indicated occurrence of the direct optical transition and the indirect optical transition for NiO nanoparticles composite with CuO are at 3.56 eV and 2.19 eV respectively. The direct band gap of NiO (3.56 eV) in the present case closely matches with the same of pure NiO nanoparticles (3.54 eV[4]). Indirect band gap on the other hand decreased by 0.36 eV when the same is compared with pure NiO nanoparticles[4]. The absorption coefficient at lower photon energy usually follows the Urbach rule[12]:
  | (4) |
 is the constant and
  is the Urbach energy. It has been reported that both static structural and dynamic phonon disorder can be quantified through
  [13]. It has also been reported that for high quality crystalline semiconductors,
  is a direct measure of temperature-induced disorder and for amorphous or highly doped materials,
  becomes larger because of the contributions from both thermal and structural disorders[14]. We estimated the Urbach energy from UV-Visible spectra for both pure NiO and for NiO/CuO nanocomposite.
  increased from 0.548 eV in pure NiO to 0.795 eV in NiO/CuO nanocomposite. This indicates CuO induced disorder in the NiO/CuO nanocomposite sample.
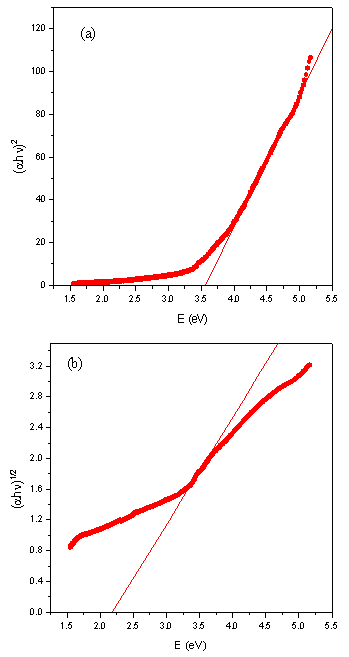 | Figure 3. Variation of  vs. photon energy, vs. photon energy,  for NiO/CuO nanocomposite with (a) n =1/2 and (b) n = 2 for NiO/CuO nanocomposite with (a) n =1/2 and (b) n = 2 |
4. Conclusions
- The effect of CuO on the structure, microstructure and optical absorption property of NiO is studied. The addition of CuO into NiO in forming nanocomposite leads to the decrease of crystallite size and lattice parameter and increase of lattice strain. UV-Visible study indicated the occurrence of both direct optical transition and indirect optical transition. The optical band of NiO in our case is nicely matches with the reported optical band gap of NiO nanoparticles. Our study confirms that by making composite with CuO has influenced significantly on the crystallite size and strain of NiO nanoparticles.
ACKNOWLEDGEMENTS
- The authors thank to Prof. N.C. Mishra, Utkal University, Bhubaneswar for his encouragement and also for providing Laboratory facility to carry out this work. DST, Govt. of India is acknowledged for proving XRD facility at Utkal University, Bhubaneswar under FIST programme.