-
Paper Information
- Paper Submission
-
Journal Information
- About This Journal
- Editorial Board
- Current Issue
- Archive
- Author Guidelines
- Contact Us
Nanoscience and Nanotechnology
p-ISSN: 2163-257X e-ISSN: 2163-2588
2013; 3(2): 27-33
doi:10.5923/j.nn.20130302.01
Statistical Thermodynamics of Schottky Defects in Metal Nanoparticles
 Abstract
 Reference
 Full-Text PDF
 Full-text HTML
M. Salis1, 2, C. M. Carbonaro1, 2, M. Marceddu2, P. C. Ricci1
1Department of Physics, University of Cagliari, s.p. n° 8 Km 0.700 -09042 Monserrato, Cagliari, Italy
2CGS, University of Cagliari, s.p. n° 8 Km 0.700 -09042 Monserrato, Cagliari, Italy
Correspondence to: M. Salis, Department of Physics, University of Cagliari, s.p. n° 8 Km 0.700 -09042 Monserrato, Cagliari, Italy.
| Email: |  |
Copyright © 2012 Scientific & Academic Publishing. All Rights Reserved.
The controversy about the size dependence of the vacancy concentration in metal nanoparticles is here reconsidered in the framework of the statistical thermodynamics. The fractional concentration of vacancies in a spherically shaped metal nanoparticle is calculated by taking into account both the core and the surface defective systems. Notwithstanding the formation energies of core and surface defects are found to increase as the particle size decreases, it is shown that the fractional concentration reaches a maximum at small particle sizes, provided that the formation energy of the surface vacancies in macro-crystals is sufficiently smaller than that expected in the bulk. This apparently counterintuitive conclusion, which may reconcile early opposite views, is a mere consequence of the high surface to volume ratio in nanostructures. Numerical calculations performed for copper nanoparticles are presented
Keywords: Nanoparticles, Defects, Metals, Thermodynamics
Cite this paper: M. Salis, C. M. Carbonaro, M. Marceddu, P. C. Ricci, Statistical Thermodynamics of Schottky Defects in Metal Nanoparticles, Nanoscience and Nanotechnology, Vol. 3 No. 2, 2013, pp. 27-33. doi: 10.5923/j.nn.20130302.01.
Article Outline
1. Introduction
- In the last decade, nanosized and nanostructured materials have become one of the major topics of interest in several fields of applied sciences and industry[1,2]. Due to the high surface to volume ratio, nanomaterials show significant deviations from the properties exhibited in the macroscopic domain: among the others, decreased melting temperature[3], increased heat capacity[4] and size-tunable optical properties[5] are some of the most studied effects observable at the nanoscale[6]. Other properties, like the concentration and the formation energy of intrinsic defects, are expected to show anomalies, but up to now they are very difficult to be experimentally investigated[7-9]. Already being a central topic in solid state science, the study of defects in nanosystems is opening new challenges in nanoscience: the growing range of applications of nanostructures poses new questions on defects related physical - chemical properties. Indeed, defects play a key role in catalytic and photocatalytic properties[10,11], crystal phase transitions[11-13], self-diffusion[14,15], electrical and thermal transport[14,15] and optical properties[16-22]. In this perspective, a better understanding of the physics of intrinsic defects in nanosystems, in particular concerning formation energy and diffusion of defects, is mandatory from both base and applicative research point of view.Among the different defective nanosystems, the reference model is the monoatomic spherically shaped metal nanoparticle, with intrinsic vacancy defects (thermal or Schottky vacancy)[15]. The formation of vacancies can be explained as the displacement of atoms from the crystal core to the surface. Since this process involves the breakup of atomic bonds, it was thought that the formation energy could be related to the crystal cohesive properties[23-26]: based on semi-empirical arguments, a proportionality law between the vacancy formation energy and the average cohesive energy was proposed. Analogous idea was sustained by highlighting that the cohesive energy and the melting temperature displayed similar dependence on particle size[26,27], which in turn may result from a special case of an universal law, as recently claimed[28]. Based on these arguments, the prediction is that the formation energy of the vacancies decreases as the particle size decreases[23-28]. On the contrary, by considering the surface energy and stress, the thermodynamic expectation is that the formation energy of a vacancy in the crystal core increases as the particle size decreases[15]. Accordingly, the concentration of vacancies is expected to be reduced in nanosystems. It should be observed, however, that this conclusion opens new questions since it is in contrast with experimental results on diffusion processes[26].In this work we reconsider the problem of intrinsic vacancy formation in metal nanoparticle within the framework of statistical thermodynamics. The defect concentration and formation energy are calculated by means of standard methods, starting from a nanosphere metal model that, unlike earlier works, includes the nanoparticle structure and also the presence of surface defects. It is shown that, when the vacancy formation energy at the surface is lower than that in the core, the fractional concentration of vacancies (core+surface) may increase as the particle size decreases. For sake of clarity, the paper is structured as follows: thermodynamics and surface energy basic concepts are recalled in section 2; the model of spherical nanoparticle and related free energy are presented in section 3, where calculations are carried out for core vacancies; in section 4 the investigation is extended to the surface; the comprehensive analysis of the problem (core and surface), is presented in section 5 and is discussed with numerical examples in section 6.
2. Basic concepts
- Thermodynamics defines the equilibrium state of a system provided that fluctuations of thermodynamics variables are negligible with respect to their average values[29]. In practice, the standard approach is correctly applied when the number of a system constituents is larger than (indicatively)
 [15,28]. In the case of a crystal nanosphere, it means a system size larger than 5 nm. To be more restrictive when considering the crystal surface[30], size larger than 10 nm will be the dimension of our model system; extrapolation of the obtained results to the lower size are meaningful only at a qualitative level. We point out that new thermodynamics approaches were developed to tackle the fluctuation problem of small sized systems[6], but they are out of our concerns, being based on different physical problems or related to free parameters. It is known that a finite crystal shows an excess of free energy with respect to the bulk that, in the simplest case, can be written as[31]
  | (1) |
 is the surface free energy per unit area. Any transformation producing a change of the surface area has an additional energy cost given by
 | (2) |
 | (3) |
 constant) and the second term to the surface stretching. In the case of spherical particles eq. (3) becomes
 | (4) |
 is the surface stress and r the particle radius. As for the process creating a single vacancy in the core of a nanoparticle, we must consider the change of the crystal volume due to both the creation of a new surface site, and, eventually, to a change of the volume due to the relaxation of defect. In the former case we have
  , that is the volume cell per atom corresponding to the vacancy created, and in the latter case we have
  , that is the relaxation from
  to
to  . Therefore the formation energy of a vacancy in the core of the crystal is given by[15]
  | (5) |
 is the formation energy in the bulk. Since for most metals it is expected that
  and
and  [15], eq. (5) predicts that the formation of vacancies is hardly favored at the nanoscale. In the next sections we show that, under specific conditions, vacancy concentration can show a different behavior if surface vacancies are taken into account. Although the last term of eq. (5) is not essential for a qualitative discussion, and could be omitted, in next calculations we will preserved it, because
  is a defect property. Thus, in the following we define the energy of the vacancy in the crystal core as
 | (6) |
3. The Model of Spherical Particle
- The most energetically favored shape is the Wulff polyhedron, which exposes only low energy and low index faces[1,15]. However, it was shown that, on the average, eq. (5) can be extended with good approximation also to facetted crystals[15]. By keeping this in mind, we model the faceted nanocrystal polyhedron as a sphere with radius r and volume V. The nanocrystal is constituted by N atoms,
 lying on the surface and
  located in the core. In a vacancy-free crystal
  , where
  is a proper geometrical factor. We assume
  to be the edge of each unit cell and also the thickness of the surface layer whose volume is
 | (7) |
 | (8) |
 vacancies, the total number of crystal sites is
  and the number of atoms of the surface layer (free of vacancies) is
 | (9) |
 it holds (
 )
)  | (10) |
 due to the vacancy relaxation.The lattice dynamics may be described according to the Einstein model, with atoms behaving as harmonic oscillators localized in the N lattice sites[27]. Accordingly, a ground energy
  (
( ) and a frequency
  are assigned to each core atom. In the same way, a ground energy
  (
( ) and a frequency
  are assigned to each surface atom in our model. Moreover core defects are considered as oscillators with ground energy
  and frequency
  . In this simplification a specific vibrational mode is attributed to each defect (defetc mode) instead of the atomic vibrations in the nearby of the vacancy[14]. Anharmonic effects are accounted for by the bulk modulus[32] and, in turn, by surface stress f[15].The form of the partition function of a system of
  localized identical oscillators of frequency
  ground energy
  (which includes zero energy and binding energy) can be written as[14,33]
 | (11) |
 | (12) |
 | (13) |
 , that is,
 | (14) |
 , we obtain
 | (15) |
 stands for the fractional concentration of core vacancies[14], that is
 | (16) |
 | (17) |
 with a core one
  . We take into account this excess of free energy for the calculation of the nanoparticle surface free energy. By using eqs. (1) and (7), and by defining
 | (18) |
 | (19) |
 . Thus, the vacancy concentration inside the nanocrystal core, written as a function of the particle radius, is:
 | (20) |
 is the concentration in the crystal bulk.
4. Surface Defects
- We will consider now the case where vacancy sites are present also on the crystal surface. Let
 be the number of unoccupied sites in the surface layer, and
  the total number of vacancies in the nanoparticle. The following relations hold
 | (21) |
 | (22) |
 | (23) |
 be the energy of a vacancy sites and
  the corresponding defect mode frequency. In analogy with eq. (11) - (15), the partition function is written as:
 | (24) |
 | (25) |
 | (26) |
 is the fractional concentration of surface defects:
 | (27) |
 | (28) |
 | (29) |
 stands for fractional concentration in the surface of macrocrystals. The formation energy of a surface vacancy is
 | (30) |
 , due to the created surface defect, and an energy term
  , due to the removed surface atom. Moreover, the quantities
  and
and  must be subtracted due to the filling of the core vacancy site, while the quantity
  , pertaining the canceled vacancy, has to be maintained, since the considered displacement does not change the total number of crystal sites.
5. Comprehensive Fractional Concentration of Defects
- The previously derived results show that the fractional concentrations in both the core and the surface of crystal, decrease as the particle size decreases. However, the total core and surface fractional concentration
 | (31) |
 . Indeed provided that
  is sufficiently small, the dependence of the concentration C on the radius r is dominated by the surface to volume ratio. To elucidate this statement, let consider the following relations: by eqs. (16) and (21), and by taking into account that
 we may write :
 Analogously, from eq. (27) it follows
 so that, the total number of vacancies is
 With the same degree of approximation so far considered, provided that
  the ensuing expression is derived from eq. (31) :
 | (32) |
6. Discussion
- For a first qualitative discussion, let assume
 , then eq. (32) is reduced to
 | (33) |
 . The analysis of eq. (33) shows that, for
 sufficiently large, concentration
  exhibits a maximum at radius
  given by
 | (34) |
 . The maximum condition is
 | (35) |
 . The formation energy of a defect is dependent on the number of related broken bonds. On the other hand, the surface can be considered, in a way, as an extended defect whose energy can be evaluated by counting up the number of broken bonds on the basis of surface and bulk coordination numbers comparison[34]. Thus, it can be inferred that
  , even if its actual value is difficult to estimate since the defect formation often implies a local lattice relaxation (in the macrocrystal) whose energy cannot be disregarded[35]. From a qualitative point of view we may conjecture that the vacancy formation energy is proportional to the coordination number of the lattice site we are dealing with. Thus, for example, the formation energy of a vacancy at the (1,1,1) surface of a fcc metal (macrocrystal) is 75% of the formation energy in the bulk, being 9/12 the ratio of related coordination numbers[34].In the case of copper nanoparticles the following parameter may be used:
  ,
, 
 and
and  [15]. Thus, according to eq. (35), at 300 K (supposed to be the equilibrium temperature) we should have
  , in order to have a maximum of
  . This value is larger than the one previously estimated on the basis of coordination numbers (about 1 eV). Conversely, assuming
  , we retrieved
  Å at 300K and
  Å at 600K. Figure 1 shows
  vs r functions, calculated for different
  at the same equilibrium temperature (600K). The range of energies taken into account spans from 150 to 300 meV in order to include our expectation on
  . It is clear that in the low size range the fractional concentration can be one order of magnitude higher than the value expected in the bulk.
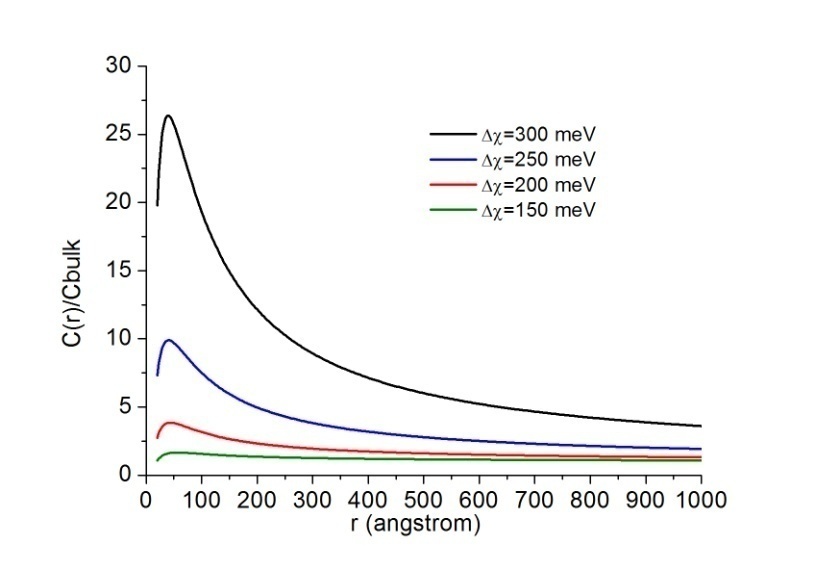 | Figure 1. Fractional concentration of (surface+core) vacancies in nanosphere relative to the one expected in the bulk at 600K. The latter is considered as the fractional concentration of core defects for infinite crystal. The curves are calculated by means of eq. (33) by considering several  values spanning from 150 to 300 meV values spanning from 150 to 300 meV |
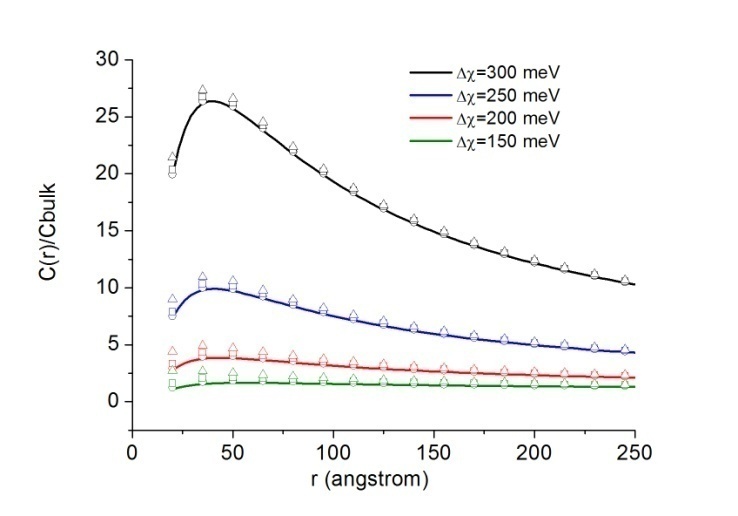 | Figure 2. Fractional concentration of (surface+core) vacancies in nanosphere relative to the one expected in the bulk at 600 K. The curves are calculated by means of eq. (32) by considering the same  values used for Figure 1 and values used for Figure 1 and  . For each . For each  are considered several are considered several  : 0 (solid); -0.25 (circle); -0.5 (square); -0.75 (triangle) : 0 (solid); -0.25 (circle); -0.5 (square); -0.75 (triangle) |
 , curves
  are calculated by assuming
  . Figure 2 compares
  curves (solid line) with the ones calculated by taking into account the actual defect volume by means of
  (dashed lines)[15]; in addition, curves calculated with
  and
and  [26] are shown as well. In the former case, the fractional concentration of core defect is expected to be independent of particle size and, in the latter case, to increase as the particle size decreases. In all the considered cases, the fractional concentration of surface defects, lacking the stress term, maintains its original size dependence. At glance, it appears that deviations from the case of non-relaxing defects are significant only in the low size range, for large
  and small
  . Besides that, the comparison among different curves proofs that numerical results are weakly dependent on
  . Therefore the relaxation term can be neglected at least for a size range where we can be confident with the standard thermodynamics. The reason is that the influence of
  is attenuated by the counteraction of the core defect concentration and the surface to core defect concentrations ratio (eq. 32).A remark pertains the effect of the local strain on the vacancy formation energy. An analysis based on the molecular static relaxation method suggests that in Wulff shaped crystals of size smaller than 10 nm
  can shows variations of some tens of meV around the predicted values for equally sized spherical particles[15]. The major concern about
  could arise from an energy jump of about 100 meV for vacancies created in the subsurface layer (also present in large crystals). To account for this feature in the model dealt with, it suffices to build the partition function by using a properly modified expression for the energy excess of defects created in the subsurface layer, that is,
  where
where  stands for the energy jump. Accordingly, eq. (32) is modified by an additional term
  which slightly reduces the defect concentration. Indeed, by considering the limiting case
  ,
,  , that leads to the largest correction in the numerical calculation, we replace eq. (32) by
 which clearly does not invalidate the above discussion.The energy jump of
  in the subsurface layer is ultimately ascribed to the decreased interlayer spacing at the surface[15]. It could be expected that also the formation energy of surface vacancies is affected by this behavior of the surface near atoms. However, our above conclusions only changes by an addition of an energy amount
  to
to  at worst. This means that still there is room for
  to allow a significant increase of the defect fractional concentration. As a final remark we stress that this work is concerned with the equilibrium state of nanocrystals. Really, depending on the preparative process, nanocrystals out of equilibrium can be produced so that the defect content becomes unpredictable and many kind of surface defects are to be taken into account[36]. Of course, this does not reduces the importance of the thermodynamic investigation since it represents the only way to understand the ultimate crystal state.
7. Conclusions
- The fractional concentration of Schottky vacancies in spherical shaped metal nanoparticles has been investigated by means of thermodynamics techniques. Both core and surface vacancies were taken into account. Depending on the equilibrium temperature and on the formation energies of vacancies in the macrocrystal, the proposed model indicated that the total core and surface fractional concentration shows a maximum for particle radius as small as some tens of angstrom. This feature can be explained by taking into account the counteracting effects due to the surface energy, which increases the formation energy of the vacancies (in both the core and the nanoparticle surface), and the surface/volume ratio, which increases the relative concentration of surface defects as the particle size decreases.