-
Paper Information
- Next Paper
- Previous Paper
- Paper Submission
-
Journal Information
- About This Journal
- Editorial Board
- Current Issue
- Archive
- Author Guidelines
- Contact Us
Nanoscience and Nanotechnology
p-ISSN: 2163-257X e-ISSN: 2163-2588
2012; 2(6): 190-200
doi: 10.5923/j.nn.20120206.07
Low Frequency Dielectric Study of PAPA-PVA-GR Nanocomposites
 Abstract
 Reference
 Full-Text PDF
 Full-Text HTML
I. Latif, Taghreed B. Alwan, Ammar H. Al-Dujaili
Department of Chemistry, College of Education, Ibn Al-Haytham, University of Baghdad, Baghdad, Iraq
Correspondence to: Ammar H. Al-Dujaili, Department of Chemistry, College of Education, Ibn Al-Haytham, University of Baghdad, Baghdad, Iraq.
| Email: |  |
Copyright © 2012 Scientific & Academic Publishing. All Rights Reserved.
A new polymer poly[2, 2-bis ((4-acetylbenzoyloxy) methyl) propane-1,3-diyl bis(4-acetylbenzoate)] (PAPA) was synthesized by solution polymerization of pentaerythretole with terephthaloyl chloride. This polymer was characterized by FT-IR spectroscopy. Graphene (GR) was prepared using hydrothermal method. Evaluation of graphene structure was performed using FT-IR and XRD. Polymer composites were prepared by ultrasonic mixing of PAPA and PVA with different GR percentages. Composites films were prepared by a conventional solvent casting technique. The morphological image of the composite materials was studied by scanning electron microscopy (SEM) and the surface topography of these composite materials was studied by Atomic Force Microscopy (AFM). Effects of GR nanoparticles percentage on dielectric properties of PAPA/PVA/GR nanocomposites film at low frequency (100Hz–100 kHz) were studied.
Keywords: Nanocomposite, Graphene, Polymer, Dielectric Properties
Cite this paper: I. Latif, Taghreed B. Alwan, Ammar H. Al-Dujaili, "Low Frequency Dielectric Study of PAPA-PVA-GR Nanocomposites", Nanoscience and Nanotechnology, Vol. 2 No. 6, 2012, pp. 190-200. doi: 10.5923/j.nn.20120206.07.
Article Outline
1. Introduction
- Since the 2010 Nobel Prize in physics was awarded to Professors Andre Geim and Konstantin Novoselov[1, 2] for their ground-breaking experiments on graphene and the attention of the scientist are growing daily to the single layer of graphite (GR) extraordinary thermal, mechanical, electrical and other properties. GR is a monolayer of sp²- hybridized carbon atoms arranged in a two-dimensional lattice[3]. One of the most promising applications of this material is in polymer nanocomposites, chemically modified GR have been used to make functional polymer composites[4-7]. Chemical functionalization of GR surface by either oxidation procedure or physical adsorption/grafting protocols have been found to be a feasible and effective means for improving the dispersion of GR in organic and/or aqueous media. In addition, the attached functional groups may enhance the interfacial interactions between the GR and the polymer matrix. The advantage of modifying the GR surface by physical adsorption is that the structural integrity of the conjugated network remains unaltered, whereas formation of defects is observed after treatment of the graphitic nanostructures by oxidative conditions and/or grafting reactions.In recent years, elastomeric materials with high dielectric constant have been considered for different functional applications such as artificial muscles, high charge-storage capacitors and high-K gate dielectric for flexible electronics[2, 8]. Several methods have been explored in order to increase their dielectric permittivity although the most common approach involves the addition of high dielectric constant ceramics to the elastomeric matrix. This strategy usually requires high loading fractions and, hence, produces an unwanted increase of the system rigidity for the applications already mentioned[9-11]. In some other cases, dielectric constant increments have been met with relatively high loss tangent values (tan (δ)) and frequency dependence which is also undesirable for capacitor applications[12, 13]. Obtaining composites with both high dielectric permittivity and low loss tangent values at the same time is specially challenging due the interfacial polarization or Maxwell - Wagner-Sillars (MWS) process. This mechanism occurs at the interface between materials with different permittivity and/or conductivities and involves rather high ε' and tan (δ) values at low frequencies due to the accumulation of virtual charges at the filler/polymer interface[14]. Altering the interfacial interaction between filler and polymer matrix can regulate the dielectric contrast between matrix and filler and thus, prevent the MWS polarization[15-17]. Therefore, chemical modification of filler particles has to be taken into account in order to achieve high permittivity composites with low dielectric losses. Nevertheless, filler surface modifications can significantly raise the production costs and thus, make them unfeasible to be produced on large scale. Thermally expanded GR sheets are of great interest to overcome the aforementioned problems. The thermal reduction of the graphite oxide has the advantage to produce chemically modified graphene sheets (or so-called functionalized graphene sheets FGS) without the need of further modification steps. Besides, the huge aspect ratio of these carbon-based nanoparticles (experimental value 1850 m²/g)[18] reduces considerably the percolation threshold compared to any other type of high dielectric constant filler. Accordingly, very small loading fractions can offer interesting permittivity enhancements without adversely affecting the dielectric losses and mechanical properties of a given polymer matrix[19] show that FGS are an ideal candidate as high dielectric constant fillers in capacitor applications . The presence of remaining functional groups at their surface is able to improve the filler matrix compatibility, enhance the nanoparticle distribution and make them suitable to develop novel, flexible and easy to process capacitors with relatively high dielectric constant and low tan (δ) values[19]. To the best of our knowledge, there is no report on fabricating graphene/polymer composites by using noncovalently modified pristine graphene nanoplatelets. In addition, dielectric data such as dielectric permittivity, ac conductivity, and electric modulus have not been widely studied in graphene/polymer composites[15]. Accordingly, we prepared PAPA/PVA/GR nanocomposites via ultrasonic mixining and investigated their electrical behaviour at various low frequencies in details.
2. Experimental
2.1. Materials
- All chemicals including sulfuric acid (98%), hydrochloric acid (36 wt%), hydrogen peroxide (30 wt%), potassium permanganate, sodium nitrate were purchased from Merck - Germany and pentaerythritol, terephthaloyl chloride, sodium hydroxide, PVA (Mn=72000), and N,N-dimethylformamide (DMF) were purchased from Sigmae-Aldrich Chemicals and used as received. Graphene was prepared from natural flake graphite powder (Sinopharm Chemical Reagent Co., Ltd).
2.2. Instruments
- For the characterization of GR, polymer and PAPA / PVA/GR nanocomposites the following instruments were used: Elemental analyzer (C, H, N) (Perkin-Elmer model 2400). FT-IR spectrophotometer (8300 FT-IR Shimadzu Spectrophotometer), XRD (Shimadzu XRD-6000) with copper radiation (Cu Kα, 1.5406 Å), Atomic Force Microscopy (AFM, AA 3000 Scanning probe Microscope), Scanning electron microscopy (SEM) (VEGA TE SCAN USA). For the dielectric properties was used Precision LCR meter HP 4274 A connected with HP 4275 A and Test Fixture HP 16047 A at frequency range 100 Hz to 100 kHz.
2.3. Synthesis of Graphene Oxide (GO)
- Hummer method was used[20] to oxidize the graphite for the synthesis of graphene oxide (GO). First, 2 g graphite, 1 g sodium nitrate and 46 mL of sulfuric acid were mixed and strongly stirred at 0℃ for 15 min in a 500 mL reaction flask immersed in ice bath. Then 6 g potassium permanganate was added slowly to the above solution and cooled for 15 min. After this, the suspended solution was stirred continuously for 1 h, and 92 mL of water was added slowly to the suspension for 10 min. Subsequently, the suspension was diluted by 280 mL of warm water and treated with 10 mL of H2O2 (30%) to reduce residual permanganate to soluble manganese ions. Finally, the resulting suspension was filtered, washed with distilled water, and dried in a vacuum oven at 60℃ for 24 h to obtain GO, Figure 1.
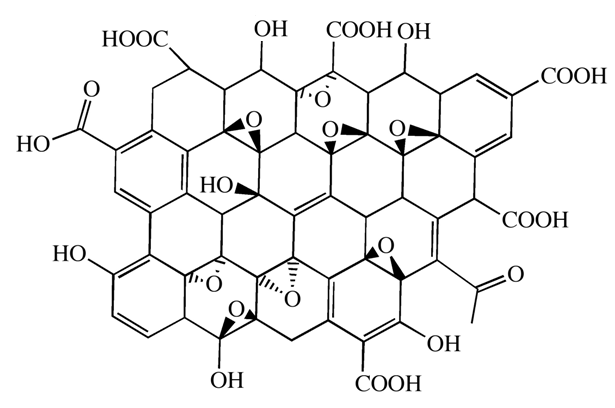 | Figure 1. The proposed structure for GO |
2.4. Synthesis of Graphene (GR)
- Graphene was synthesized in a typical procedure, GO (100 mg) was loaded in a 250 mL round bottomed flask and water (100 mL) was then added, yielding an inhomogeneous yellow-brown dispersion. This dispersion was sonicated using ( Soniprep 150 Plus) until it became clear with no visible particulate matter. Hydrazine hydrate (1.00 mL, 32.1 mmol) was then added and the solution heated in an oil bath at 100℃ under a water-cooled condenser for 24 h over which the reduced GO gradually precipitated out as a black solid. This product was isolated by filtration, washed continuously with water (5
 100 mL) and methanol (5
 100 mL), and dried in oven (50℃)[21].
2.5. Synthesis of Poly[2,2-bis((4-acetylbenzoyloxy) methyl) Propane-1,3-diyl bis(4-acetylbenzoate)] (PAPA)
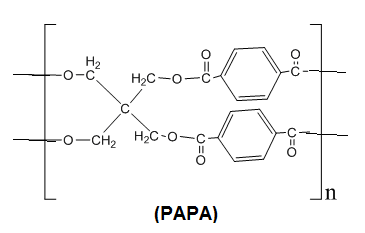 To a stirring solution of pentaerythritol (1.36 g, 10 mmol) in dry pyridine 5 mL and dry DMF 2 mL, at -5℃ a solution of terephthaloyl chloride (4.06 g, 20 mmol) in dry DMF 7 mL was added dropwise under N2 atmosphere. The stirring was continued for half an hour at -5℃ and then overnight at room temperature. At the end of the reaction, for quench growth polymer solution was slowly trickled in to stirred methanol, giving rise to a stringy precipitate, which was washed thoroughly with hot methanol, collectedly filtration and dried at 60℃ for 12 hrs under vacuum to leave 90% of solid polymer.
2.6. Film Fabrication
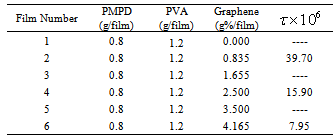
- Six polymer composite films were prepared from PAPA and PVA with different GR percentage as shown in Table 1. Each film as in Table 1 dissolved in 20 mL DMF and mixed completely under constant stirring for one hour while the mixture was heated up to 50℃, then the mixture was left to cool down to room temperature 24℃ with stirring of the mixture was carried out to ensure a homogenous composition. The obtained PAPA/PVA composite were mixed ultrasonically for 15-25 minutes with desired GR percentage composition as in Table 1. To cast the films were poured the above mixtures in a casting glass plate 5
 5 cm and let it dry at room temperature for 120 hours. At the expiry of this time, the films were ready which were peeled off the casting glass plate.
|
2.7. Dielectric Constant Measurements
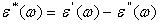
- The above fabricated films were cut into 2x1.5 cm pieces to fit a homemade silver electrode for characterization by measuring dielectric properties using Precision LCR meter. The dielectric parameter as a function of frequency is described by the complex permittivity
 | (1) |
 and imaginary part
  are the components for the energy storage and energy loss, respectively, in each cycle of the electric field.
  is the angular frequency;
  ,
,  is applied frequency. The measured capacitance, C was used to calculate the dielectric constant,
  using the following expression.
 | (2) |
 is the thickness between the two electrodes (film thickness),
  is the area of the electrodes,
 is permittivity of the free space,
  F.m-1 and whereas for dielectric loss,
  and
and  is tangent delta[22]:
  | (3) |
 | (4) |
 and
and  are the real and imaginary part of electric modulus and it was calculated by Eqs. (5 and 6):
 | (5) |
 | (6) |
 can be obtained from the plotting of
  versus log frequency.
 | (7) |
 | (8) |
 | (9) |
3. Results and Discussion
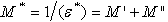
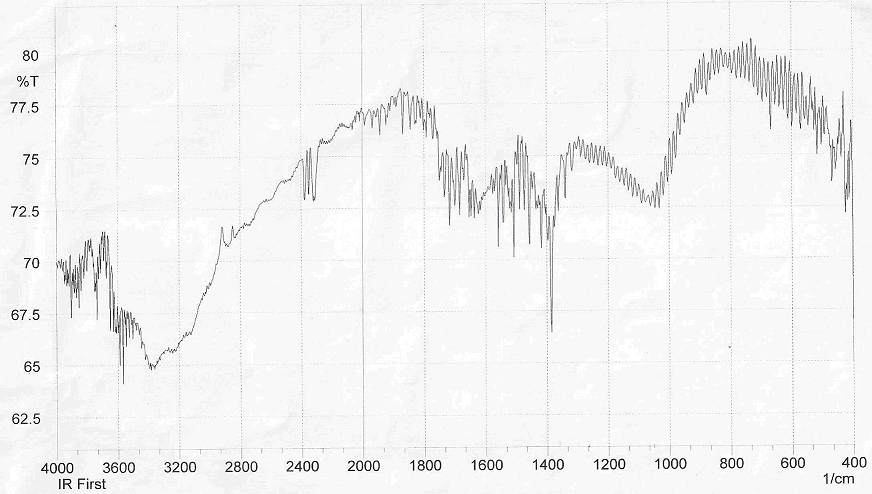
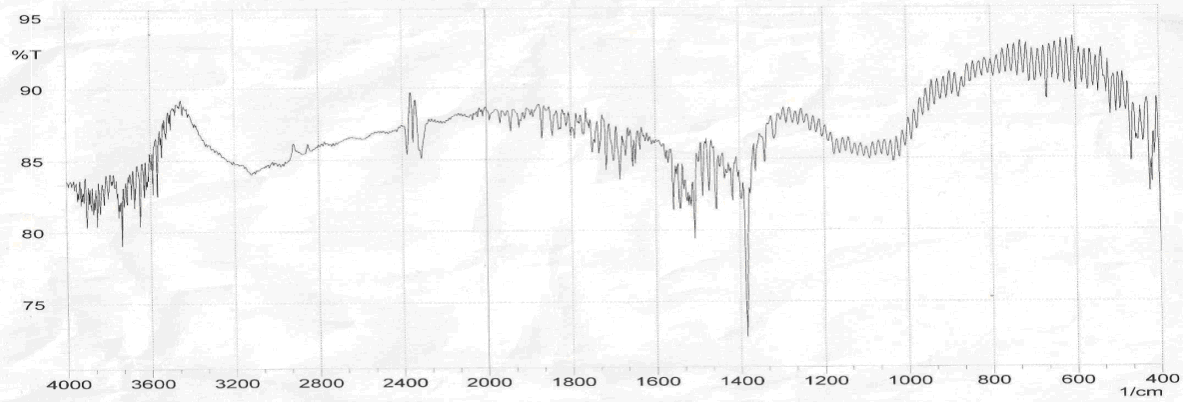
- Figure 2 shows several characteristic peaks of FT-IR for GO corresponding to O-H vibration at 3200-3400 cm-1, C=O stretching at 1726 cm-1, C=C skeletal vibration from unoxidized graphitic domains at 1627 cm-1, O-H deformation at 1396 cm-1, epoxy symmetrical ring deformation at 1154 cm-1, C-O stretching mixed with C-OH bending at 1032 cm-1. After reduction of GO as seen in Figure 3, the peaks corresponding to C=O stretching at 1726 cm-1, disappeared while the peak at 1557 cm-1 (C=C) was retained, the stretching vibrations at 1060 cm-1 on the GO and reduced GO spectra indicate the presence of C‒C skeletal vibrations of the graphite ring. This showed that reduction results in the formation of sp² carbon structure. Thus, it can be concluded that GR sheets were produced via reduction of GO.The structure of PAPA polymer was confirmed by using elemental analysis and FT-IR spectroscopy. The observed values of C and H percentages (data not shown) of the repeating units are in agreement with theoretical values. In the spectrum of PAPA polymer, presented in Figure 4, the intense bands at 3402 and 1717 cm−1 were attributed to stretching vibrations, of the O-H and C=O stretching bands coming from pentaerythritol and terephthaloyl chloride monomers respectively. These analyses of this compound are good evidence which corresponds to the structure of suggested polymer.
 | Figure 2. FT-IR spectra of GO |
 | Figure 3. FT-IR spectra of GR sheets |
 | Figure 4. FT-IR spectrum of PAPA nanocomposite |
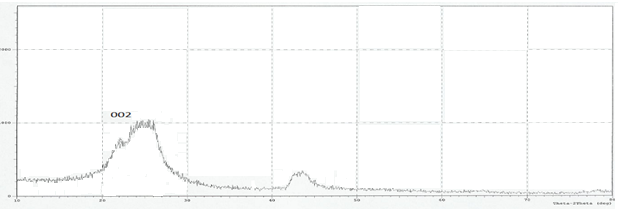
 | Figure 5. XRD patterns of GO |
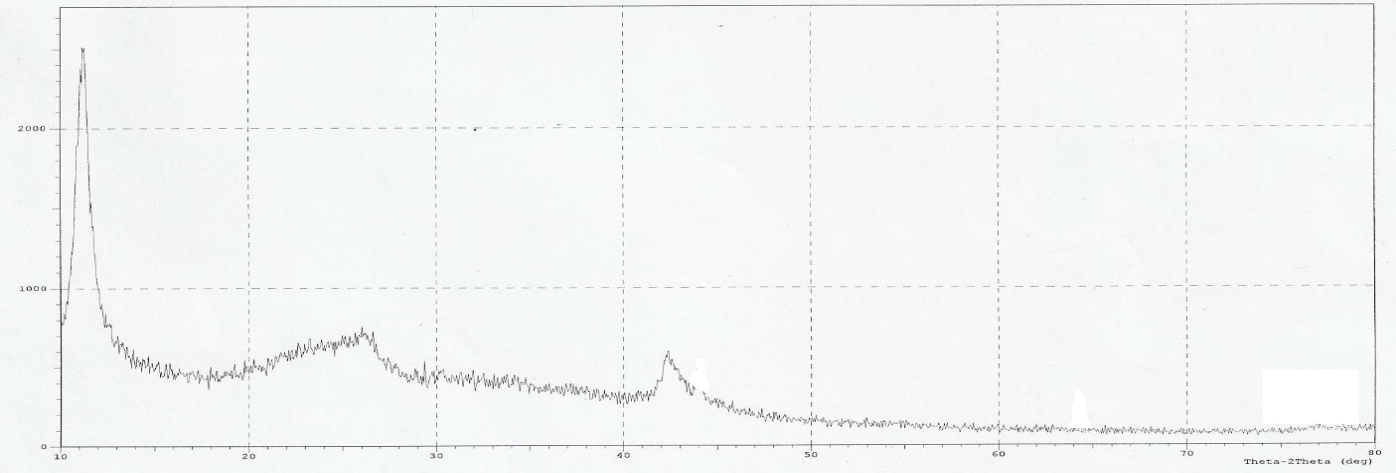
 | Figure 6. XRD pattern of GR powder sample |
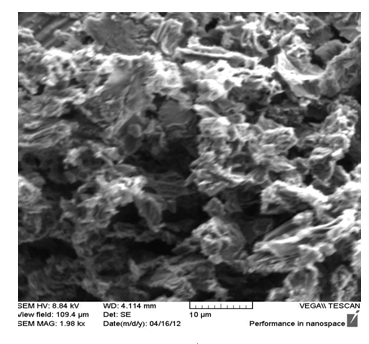 | Figure 7. SEM image of GR sample |
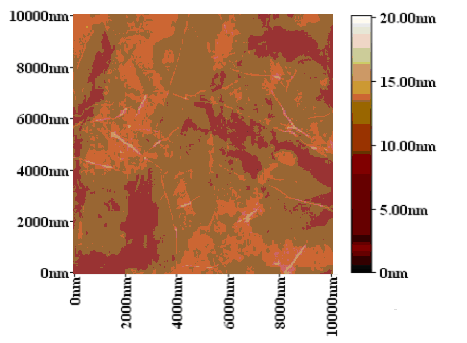 | Figure 8. AFM image of GR sample |
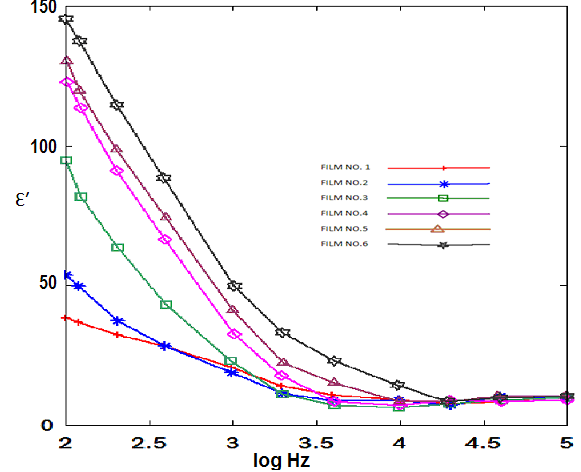
 ) with frequency for all GR composite percentage (Table 1 ) at constant temperature (24℃). At low frequencies, permittivity attained higher values, in all cases, which diminished rapidly with frequency increasing. This is reasonable since in the low frequency region the alternation of the field is slow, providing thus sufficient time to permanent and induced dipoles to align themselves according to the applied field, leading to enhanced polarization. Enhanced values of (
 ) especially at low frequencies can be attributed interfacial polarization, and/or electrode polarization. Electrode polarization is related to the buildup of space charges at the specimen-electrode interfaces and is characterized by very high values of both real and imaginary part of dielectric permittivity[29-31]. Examined samples were tested under identical experimental conditions, having similar geometrical characteristics and composition. Thus, if electrode polarization was the prevalent effect in a certain type of nanocomposite, should be also the prevalent tendency to all other types. Under this point of view, the higher values of (
 ) could be attributed to enhanced conductivity and interfacial polarization (IP). IP results from the accumulation of unbounded charges at the interfaces of the constituents, where they form large dipoles; its intensity is connected to the extent of the existing interfacial area within the composite system, giving thus indirect evidence of the achieved distribution of nano inclusions[34]. Figure 10 was recorded a systematic increase of (
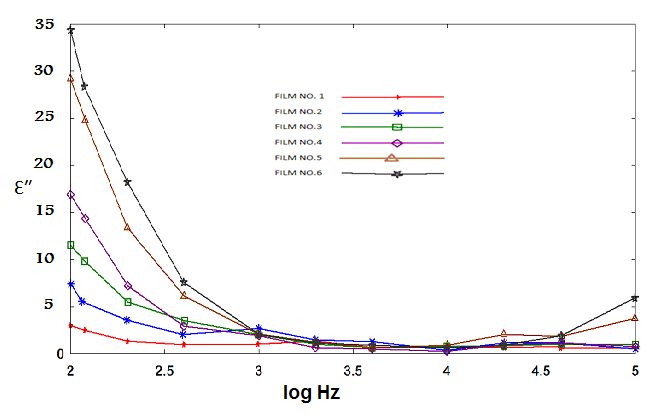
 ) with filler content for all samples. Since polarization and stored energy is directly proportional to permittivity. Dielectric loss, (Figure 11) was increased with increasing of GR composite percentage and the peaks shift to increase with decrease of the frequency.
 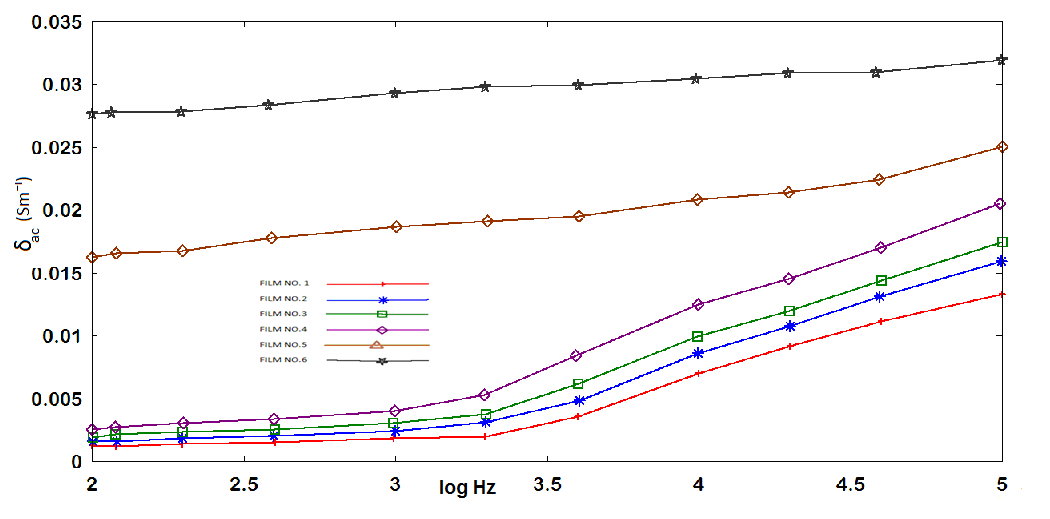 | Figure 9. AC conductivity versus log frequency |
 | Figure 10. Real permittivity versus log frequency |
 | Figure 11. Imaginary permittivity versus log frequency |
 ,
, respectively) versus frequency for the PAPA/PVA/GR nanocomposite is depicted in Figures 12 and 13 respectively. The imaginary part of electric modulus (
 ) versus frequency spectra revealed to relaxation mechanism, which recorded at high frequencies, was attributed to interfacial polarization (IP). In Figure 13 the peak shifts to higher frequency with the increasing of GR composite concentrations. Figure 13 shows also that the height of the peak increase with the GR composite concentration as relaxation time τ decreases. The frequency at the maximum of the peak (Fig. 13) of
 is the relaxation frequency
  as tabulated in the inset in Figure 13.
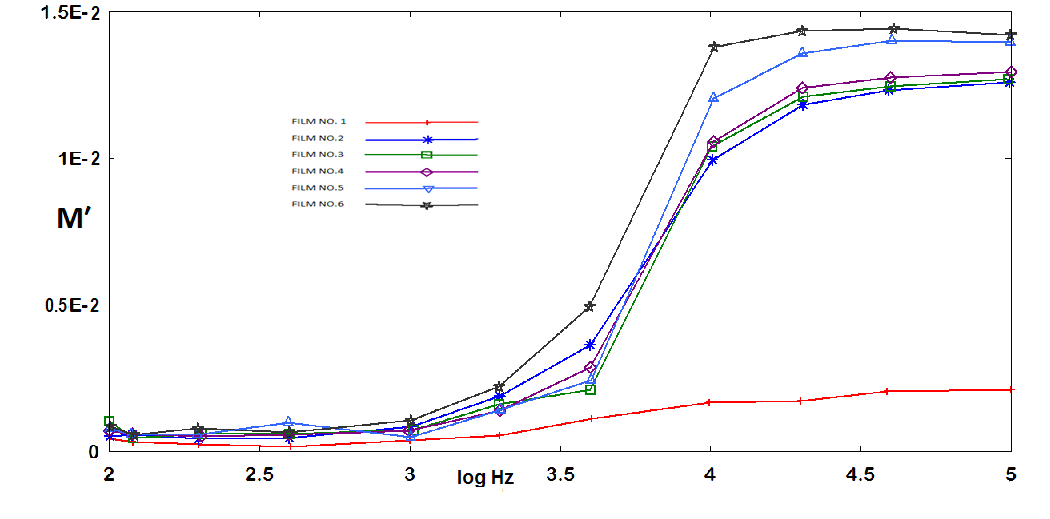 | Figure 12. Real part of electrical modulus versus log frequency |
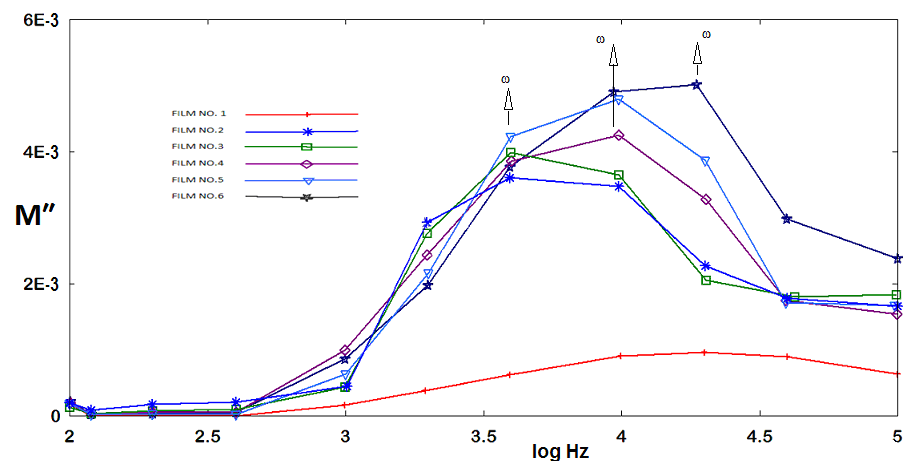 | Figure 13. Imaginary part of electrical modulus versus log frequency |
4. Conclusions
- PAPA/PVA/GR composites were fabricated in six different GR composite percentages. The structural, morphology and electrical properties of the composites are characterized by x-ray diffraction (XRD), Fourier transform IR spectra (FT-IR), AFM and SEM. The electrical conductivity, dielectric properties and electric modulus of PABA/PVA/GR composites were measured in a range of frequencies from 100 Hz to 100 kHz. The results showed that the AC conductivity (σ) and dielectric constant (
 ) of the PABA/PVA/GR composites were frequency dependent. At low GR weight percentage contents (≤ 2.50%) the electrical conductivity of the GR composites increases with increasing frequency. These specimens show a typical insulating behaviour with a frequency-dependent conductivity, but when the GR weight percentage reach 4.165% the curve was showed a week slope which indicate that the DC conductivity increase continuously with increasing of GR weight percentages in the composite and the effect of the frequency became weaker on the conductivity and became more and more independent on the frequency. The behaviour of imaginary part of electrical modulus versus log frequency shows also that the height of the peak increase with the GR composite percentages as relaxation time decreases.