Nanoscience and Nanotechnology

p-ISSN: 2163-257X    e-ISSN: 2163-2588

2012;  2(6): 184-189

doi: 10.5923/j.nn.20120206.06

Alternative Metodology for Gold Nanoparticles Diameter Characterization Using PCA Technique and UV-VIS Spectrophotometry

J. C. Martínez1, N. A. Chequer1, J. L. González2, T. Cordova3

1Mathematics and Biotechnology Academy, Instituto Politécnico Nacional-UPIIG, Silao de la Victoria, 36275 GTO, Mexico

2Biophysics and Science life Laboratory, Universidad de Guadalajara-CULAGOS, Lagos de Moreno, 47460 JAL, Mexico

3Departmet of Physics & Engineering-DCI, Universidad de Guanajuato campus Leon, 37150 GTO, Mexico

Correspondence to: N. A. Chequer, Mathematics and Biotechnology Academy, Instituto Politécnico Nacional-UPIIG, Silao de la Victoria, 36275 GTO, Mexico.

Email:

Copyright © 2012 Scientific & Academic Publishing. All Rights Reserved.

Abstract

The rapid developments in nanostructured materials and nanotechnology is starting to have a profound impact in many applications of the biomedical areas, including biomolecules, tissue engineering, and detection of biomarkers, cancer diagnosis, cancer therapy, and bioimaging. Nanotechnology applications hinge frequently on the availability in well-characterized size distributions for gold nanoparticles. In this work we implemented a methodology in order to determine gold nanoparticles size by using the UV-Vis spectra and the multivariate analysis with the principal components' analysis method. The sample size of gold nanoparticles used for correlation of this methodology were previously known (5, 10, 15, 20, 30, 40, 50, 60, and 80 nm), they were supplied by Sigma Aldrich and Ted Pella Inc. All GNPs were measurement with a spectrometer Shimadzu UV-VIS 1800 Rayleigh model over the range from 400 to 700 nm. The UV-VIS spectra was compared with the implemented methodology in order to show excellent behavior and similitude in results, which one suggests this is an outstanding usefully tool to determine the gold nanoparticle diameter.

Keywords: Gold Nanoparticles, UV-Visible Spectra, Principal Component Analysis

Cite this paper: J. C. Martínez, N. A. Chequer, J. L. González, T. Cordova, "Alternative Metodology for Gold Nanoparticles Diameter Characterization Using PCA Technique and UV-VIS Spectrophotometry", Nanoscience and Nanotechnology, Vol. 2 No. 6, 2012, pp. 184-189. doi: 10.5923/j.nn.20120206.06.

1. Introduction

Nanoparticles form a class of materials with diameters in the range from 1 to 100 nm. These systems are produced commonly in nature, and they are called colloids, aerosols and submicron solids; these are dust particles and suspended solids in aqueous systems, smoke, clouds and mist. Other nanoparticles are deliberately made for unique applications in areas of medicine and electronics[1-3]. Fabricated metal colloids have been used for hundreds of years in manufacture of stained glass[4-6]. Gold is a highly functional metal, which has a lot of applications in chemistry and material's science[7] and it is known as one of the best metals to form stable nanoparticles. Recently, nanotechnology has attracted considerable interest in the field of scientific measurement, with a particular focus on gold nanoparticles (GNPs) and their usefulness in biomedical analysis[8-12]. GNPs have shown a particular feasibility for Surface Enhanced Raman Spectroscopy (SERS) where they serve to greatly increase the sensitivity and specificity of Raman classification[13-16].
It can apply a variety of techniques to characterize the metal nanoparticles intended for a particular use, including spectroscopic methods (UV-visible absorption, Raman scattering) or microscopy (transmission electron microscopy, scanning atomic force microscopy). The precise synthesis of nanoparticles with narrow size dispersion presents particular challenges, the most common diagnostic of size distribution is electron microscopy, which is expensive and time consuming.
UV-visible spectroscopy is widely used in the study of nanomaterials as a diagnostic of nanoparticle formation. Used in conjunction with affinity labeling, UV-visible spectroscopy often provides the means of choice to gauge response in an analysis using nanoparticles. It has been further suggested that the spectroscopic properties of nanoparticles can provide an indicator of their size distribution by fitting the position of the surface plasmon resonance (SPR) to a simple wavelength function[17-19].
In this article, it is suggested a methodology by which principal component's analysis (PCA) can be used to determine gold nanoparticle size from a simple measurement of the UV-visible spectrum. Unlike, previous methods, which rely solely on calibrating the positions of peaks in the SPR spectrum, PCA analysis of variance in the full dimensionality of the absorbance measurement.
The PCA function is an unsupervised procedure to analysis of the inherent multivariate structure of the data. It reduces the dimensionality of a data set by finding an alternative set of coordinates: principal components (PCs). PCs are linear combinations of the original variables, which are orthogonal to each other and designed in such as way that each one successively accounts for the maximum remaining variance of the data set. Plots of principal component scores against one another can reveal relationships, such as natural data clustering, differentiation and outliers. In addition, plotting the principal component loadings as a function of a given variable can determine whether that variable accounts for a substantial variance.
Important applications relating to imaging processing, data compression, pattern recognition, clustering, classification and time series prediction have developed over last years based upon PCA[20-22]. PCA methods applied with various spectroscopic techniques have grown to become key tools in the biomedical analysis, including techniques capable of assisting in the diagnosis of multiple diseases such as breast and cervical cancer [23-24], and leukemia[25].

2. Experimental Section

It was analysed nine different GNPs samples of known sizes in colloid solution. Table 1 show these reference products along with technical information.
Table 1. Summarization of reference products with their supplier and their technical information
     
It was taken five spectra of each gold colloid suspension in the range from 400 to 700 nm. These spectrums were recorded with an 1800 Rayleigh spectrophotometer, of 1 nm acquisition resolution. Samples were illuminated by halogen and deuterium lamps. The absorbance measurements were made using 0.5 cm path length quartz cuvettes. Quartz cell containing distilled water served as a reference. Figure 1 shows visible spectra of gold colloids for 5, 10, 15, 20, 30, 40, 50, 60 and 80 nm. The observed shifts are congruent with the increased nanoparticle diameter[18]. The SPR is clearly visible as a peak in the range between 514 and 550 nm. For small particles, this peak is damped due to the reduced mean free path of the electrons.
These measurements encompassed a total of 45 visible spectrums. In order to have a spectrum's comparator, it was normalized each spectrum to the SPR feature, which in each case represented the maximum. The spectrums were pre-processed by baseline correction with asymmetric least squares smoothing[26-28].
Unlike other algorithms, this one is faster and simpler, even for large data sets, and asymmetric weighting apply everywhere. This algorithm served well to remove noise background and additional external sources of noise.
Figure 1. Visible spectrum of gold colloid suspensions of 5, 10, 15, 20, 30, 40, 50, 60 and 80 nm diameters from bottom to top, respectively
Spectroscopy techniques for biological samples evaluations are strengthened from this approach to re-move florescence, shot noise, dark current and spikes from cosmic rays. In Figure 2 is compared a raw spectrum with one normalization and baseline smoothing. All the algorithms for data analysis were implemented in Matlab R2009a commercial software.
Figure 2. Spectrum process a) Raw spectrum. b) Baseline correction
PCA offers a way of identifying patterns in sets of correlated data and expressing these characteristics in such a way that highlight their similarities and differences[29]. Main advantage of PCA is that the patterns in data have been identified; they can be compressed by reducing the number of dimensions, without much loss of information[30-31]. PCs are linear combinations of the original variables, which are orthogonal to each other and constructed so that each one successively accounts for the maximum remaining variance of the data set. Plots of principal component scores, against one another, reveal relationship's existence among the samples, including data clustering and segmentation, as well as outliers. In addition, the principal components' loadings can be plotted to determine which variables cause the greatest variance.
It is often useful to have a comparative measure of the width of the variance from the mean along different dimensions in a variable space. The covariance offers such a measure. The covariance is always measured between two component dimensions. If we calculate the covariance between one dimension and itself, it is gotten the variance in that component. A useful way to assemble all the possible covariance values between all the different dimensions the variable space for an analysis is to calculate them all and put them in a matrix, called the covariance matrix. Since the covariance matrix is square, we can calculate its eigenvectors and eigenvalues. These are important, as they provide useful information about the patterns of variations in the data. In general, once eigenvectors are found from the covariance matrix, the next step is to order them by eigenvalues, highest to lowest. This gives us the components or dimensions in the order of their significance. With this ordering, we can decide to ignore the components of lesser significance. It lost some information, but if the eigenvalues are small, it is not lost too much. In this paper, it was used the first three principal components.
When It was applied PCA to the data presented above pertaining to the visible spectra of gold nanoparticles several clusters appeared. Each cluster corresponds to a gold nanoparticle spectral group of a particular size. Plotting principal component values as a function of gold nanoparticle size, we find that we can obtain a function that can be used to determine GNP size based on the principal component of its visible spectrum extract from PCA applied to a set of standard suspensions.

3. Results and Discussions

Applying the Principal Component Analysis to the 45 visible absorption spectra it was obtained for these nine gold nanoparticle diameters from 5 to 80 nm.
The main distinguishing information obtained from by PCA is well represented by the first few components.
In figure 3 is showing the behavior pattern based on GNP size the first three PCs, where is clearly distinguished and easily identifies particle size in a GNP suspension by its visible spectrum.
This plot suggests that PCA is an excellent technique that could be used to discriminate spectroscopically particles of different sizes. For the characterization, it was used the principal component 1 (PC1), already that presented a favourable contribution between the principal component 2 (PC2) and principal component 3 (PC3).
The above behavior can see in Figure 3 (a, b), there is a clear relation between PC1 and the diameters of the gold nanoparticles. This is, it is observed that the value of the PC1 increases as the size of the gold nanoparticle.
Figure 3. PCA plots show the patterns for different GNPs size. The main information obtained from the PCA is described by the first principal components. a) Principal Component 1 vs. Principal component 2. b) Principal Component 1 vs. Principal component 3
Figure 4. The first principal component as a function of the GNPs diameter
In the figure 4 is shown the first principal component as a function of the GNP diameter fitting (red solid line) to equation (1). It was found that this behavior in the first principal component is congruent with the diameter (dPCA) of the nanoparticle by a polynomial function ()
(1)
Where, x is the first principal component value. The fit parameters, 
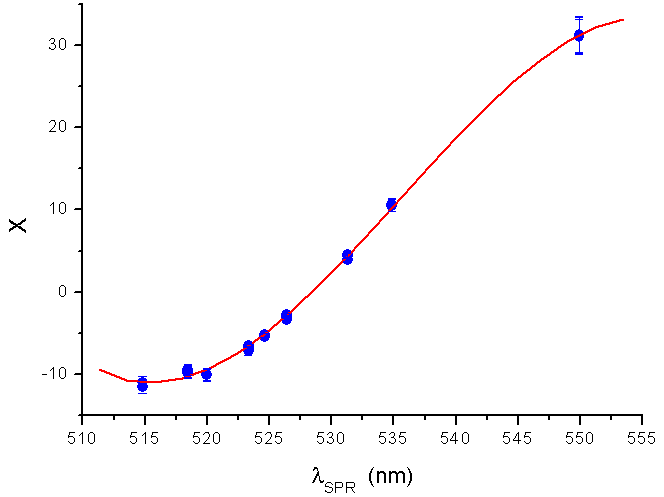
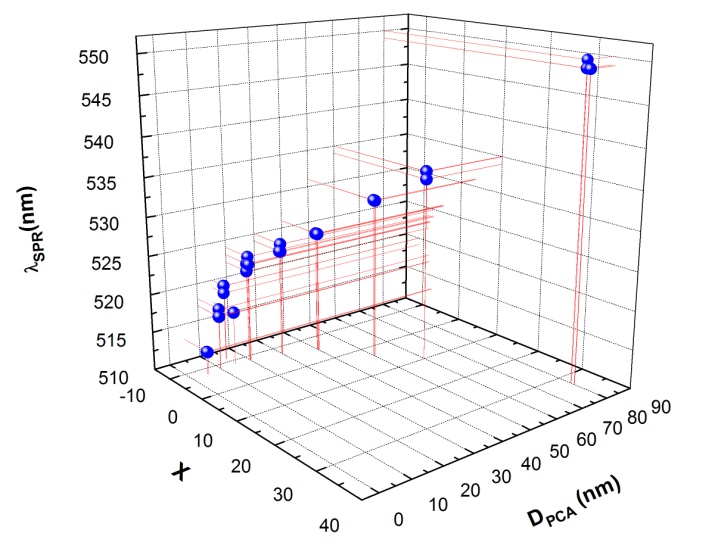
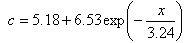
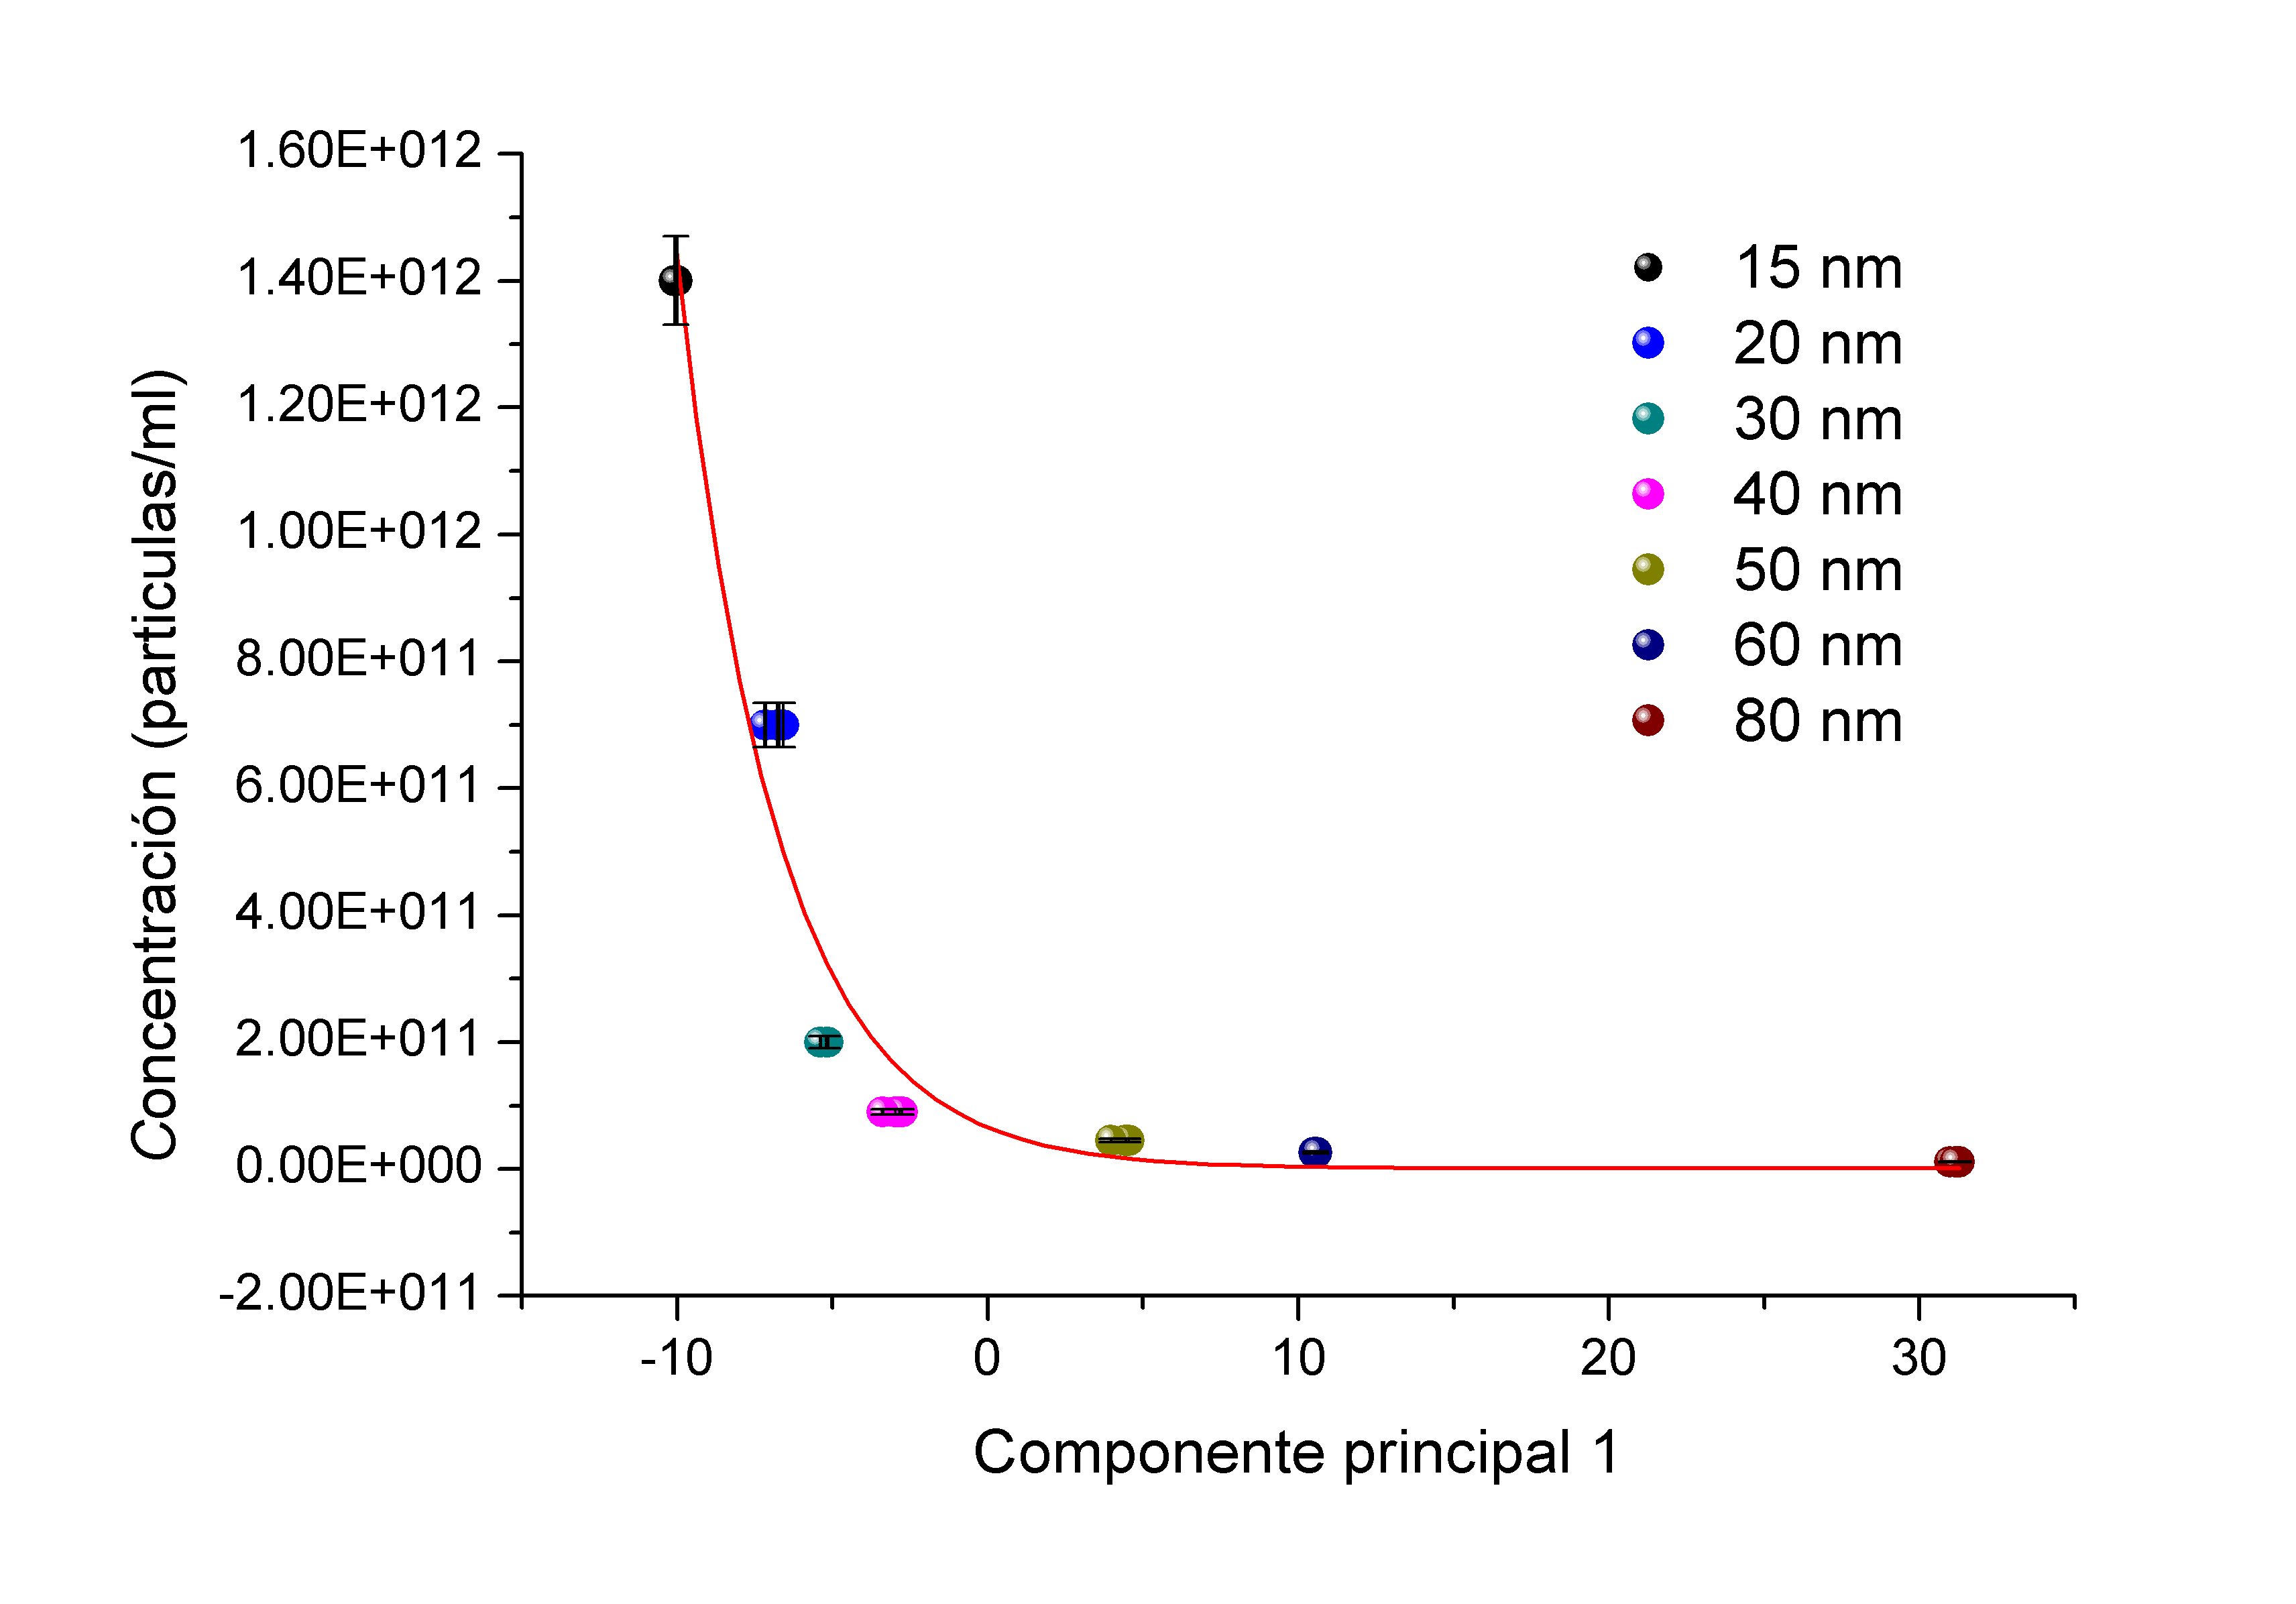
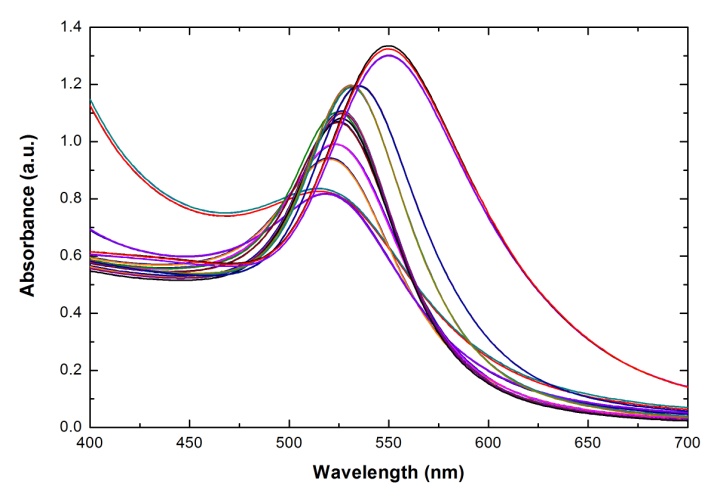
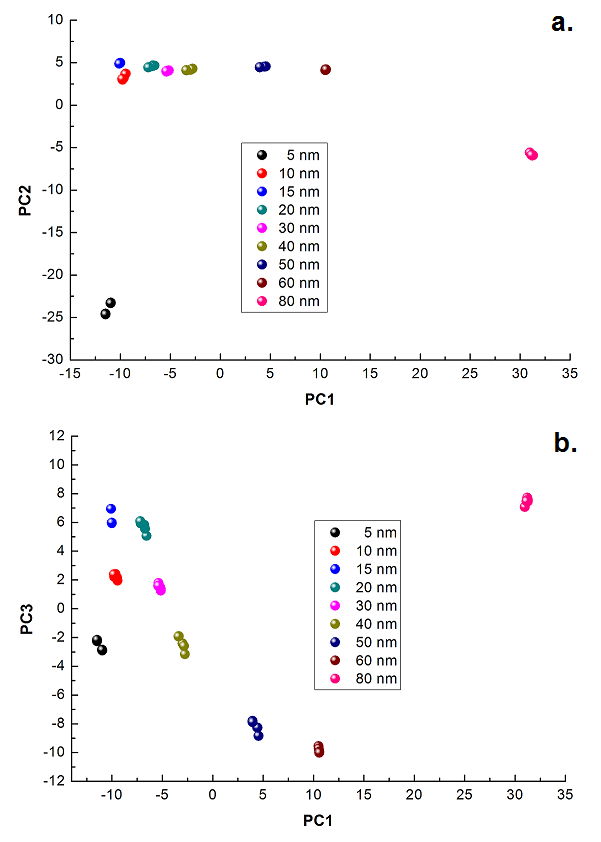
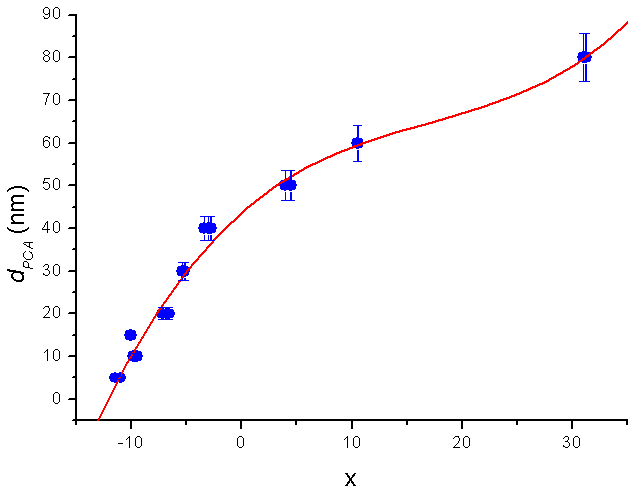
, and and the result of fitting to a polynomial of degree 3 between the first principal component and the diameter of the GNP.
In the figure 5 is shown the value graph for the dominant component vs. the position of the Surface Plasmon Resonance peak in the spectrum of each suspension, it is found a systematic variation. This one can be fitted to a third order polynomial function for wave length in nm ().
(2)
Where 
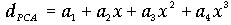
is the position of the SPR peak and the fit parameters, and .
Figure 5. The first principal component as a function of the surface plasmon resonance peak
Figure 6. It is shown the close behavior for the first principal component, resonant peak and the nanoparticle diameter
Finally, the value of the main component varies according to the resonant peak, so it was previously observed with the nanoparticle diameter that also varies according to the resonant peak and the value of the principal component, as shown in figure 6.
In table 2 are shown the comparative calculated diameters of our GNPs using the position of the SPR peak in a fit function reported by Haiss et al.[17], and the results based on the PCA standardization for the study presented here.
Table 2. Comparisons between GNP diameters: using the surface plasmon resonance peak in the fit function reported by Haiss et al.[17], and principal component's analysis
     
Finally, in figure 7 is shown the first principal component 1 vs. the concentration of GNPs, listed in Table 1. The fitting for above description, according to equation (3) is also shown in figure 7.
(3)
Figure 7. Fitting of the concentration of particles as a function of first principal component

4. Conclusions

It was shown that the method of principal components analysis can be considered as an alternative tool in order to determine the diameter of GNPs. Diameter, surface plasmon resonance peak and concentration of particles can be calculated as a function of the first principal component. It has also compared these results with a method relying on the assignment of SPR peak position, obtaining excellent results. Unlike this approach, in which the estimate of diameter depends on the choice of a single spectral position, the present principal component analysis examines absorbance over the full range of the spectrum. In addition, our method determines the particle diameter over the full the range from 5 to 80 nm. Finally, this model will support largely standardized protocols for manufacturing gold nanoparticles and it is considered that it is easily exported to others nanoparticle characterization.

ACKNOWLEDGEMENTS

Authors want to thanks at the Universidad DeLaSalle Bajío and the Instituto Politécnico Nacional-UPIIG for the partial support in this study.

References

[1]  Sperling R. A., Gil P. R., Zhang F., Zanella M., Parak W., “Biological applications of gold nanoparticles”, J., Chem. Soc. Rev., vol. 37, pp. 1896-1908, 2008.
[2]  Weibo C., Ting G., Hao H., Jiangtao S., “Applications of gold nanoparticles in cancer nanotechnology”, Nanotechnology Science Applications, vol. 1, pp. 17-32, 2008.
[3]  Devika B.Ch.,Arezou A.G., Warren C.W., “Determining the Size and Shape Dependence of Nanoparticle-Uptake into Mammalian Cells”, Nano Letters, vol. 6, pp. 662-668, 2006.
[4]  John M.T., Pure & Appl. Chem., 60, pp. 1517-1528, 1988.
[5]  Klaus, E.; Marion, L.; Martin, M., Matthias, P.; Helmut, S., Method for manufacturing substrates with transparent and color coating stable at high temperature and in the presence of ultraviolet rays, U.S. Patent, 6156388, Dec. 5, 2000.
[6]  Bing T., Yiying W., “Dye-Sensitized Solar Cells Based on Anatase TiO2 Nanoparticle/Nanowire Composites”, J. Phys. Chem.. B, 110, pp. 15932-15938, 2006.
[7]  Frank C., “Nanoengineering of Particle Surfaces”, Adv. Mater., 13, pp. 11-22, 2001
[8]  Marie Ch., Didier A., “Gold Nanoparticles: Assembly, Supramolecular Chemistry, Quantum-Size-Related Properties, and Applications toward Biology, Catalysis, and Nanotechnology”, Chem. Rev., 104, pp. 293-346, 2004.
[9]  Sang B. L., “Focus on nanoparticles for cancer diagnosis and therapeutics”, Nanomedicine, vol. 2, no. 5, pp. 647-648, 2007.
[10]  Hainfeld J.F., Slatkin D.N., Focella T.M., Smilowitz H.M., “Gold nanoparticles: a new X-ray contrast agent”, The Britsh Journal of Radiology, 79, pp. 248-253, 2006.
[11]  Xiaohua H., Ivan H., Wei Q., Mostafa A., “Cancer Cells Assemble and Align Gold Nanorods Conjugated to Antibodies to Produce Highly Enhanced, Sharp, and Polarized Surface Raman Spectra:  A Potential Cancer Diagnostic Marker”, Nano Letters, vol. 7, no. 6, pp. 1591-1597, 2007.
[12]  Mauro F., “Cancer nanotechnology: opportunities and challenges”, Nature Reviews Cancer, vol. 5, no. 3, pp. 161-171, 2005.
[13]  Tian Z.Q., “Surface-enhanced Raman spectroscopy: advancements and applications”, J. Raman Spectrosc., vol. 36, pp. 466-470, 2005.
[14]  Kneipp K.., Haka A.S., Kneipp H., Badizadegan K., Yoshizawa N., Boone C., Shafer P., Motz J., Dasari R., Feld M., “Surface-Enhanced Raman Spectroscopy in Single Living Cells Using Gold Nanoparticles”, Applied Spectroscopy, 2002, vol. 56, no. 2, pp. 150-154.
[15]  Hope T.B., Christopher B.C., I-Hsien, C., James P., James E.H., Melodie E.B., Joseph B. J., Theresa A.G., Gerard L.C., “Application of Surface Enhanced Raman Spectroscopy for Detection of Beta Amyloid Using Nanoshells”, Plasmonics, vol. 2, pp. 55-64, 2007.
[16]  Daniel M. K., Brian G. P., Orlin D.V., “Controlled assembly of SERS substrates templated by colloidal crystal films”, J.Mater.Chem, vol. 16, pp. 1207-1211, 2006.
[17]  Wolfgang H., Nguyen T. K., Thanh J. A., David G. F., “Determination of Size and Concentration of Gold Nanoparticles from UV-Vis Spectra”, Anal. Chem., vol. 79, pp. 4215-4221, 2007.
[18]  Nikhil R.J., Latha G., Catherine J. M., “Seeding Growth for Size Control of 5−40 nm Diameter Gold Nanoparticles”, Langmuir, vol. 17, pp. 6782-6786, 2001.
[19]  Kenneth R.B., Daniel G.W., Michael J.N., “Seeding of Colloidal Au Nanoparticle Solutions. 2. Improved Control of Particle Size and Shape”, Chem. Mater., vol. 12, no. 2, pp. 306-313, 2000.
[20]  Jan J.G., “On the relationships between SVD, KLT and PCA”, pattern recognition, vol. 14, no. 1-6, pp. 375-381, 1981.
[21]  Salim C., Amrane H., Boualem S., “A new PCA-based method for data compression and enhancement of multi-frequency polarimetric SAR imagery”, J. Intelligent data analysis, 6, pp. 187-207, 2002.
[22]  Mia H., Sanne E., “Robust PCA and classification in biosciences”, Bioinformatics, vol. 20, no. 11, pp. 1728-1736, 2004.
[23]  Pichardo J.L., Frausto C., Barbosa O., Huerta, R., Gonzalez J.L., Ramírez C.A., Gutierrez G., Medina C., “Raman spectroscopy and multivariate analysis of serum samples from breast cancer patients”, Lasers Med. Sci., 22, pp. 229-236, 2007.
[24]  González J.L., Rodríguez J., Martínez J.C., Frausto, C., Jave L., Aguilar A., Vargas H., Martínez E., presented at Laser Florence 2009, International Congress Laser Medicine with Pre conference Courses, November 6-November 7, Springer, Florence 2009, 12(26): pp. 91-95.
[25]  Martínez J.C., González J.L., Frausto C., Miranda M.L., Soria C., Medina J., presented at Laser Florence 2008, International Congress Laser Medicine with Pre conference Courses, October 31-November 1, Springer, Florence 2008, vol. 23: pp. 99-103.
[26]  Chad A.L., Anita M.J., “Automated method for subtraction of fluorescence from biological Raman spectra”, Applied spectroscopy, vol. 57, no. 11, pp. 1363-1367, 2003.
[27]  Hans F.M., Win T. K., Onno E.N., Age K.S., “Performance Optimization of Spectroscopic Process Analyzers”, Anal.Chem., vol. 76, no. 9, pp. 2656-2663, 2004.
[28]  Jirasek A., Schulze G., Yu, M., Blades M., Turner R., “Accuracy and Precision of Manual Baseline Determination”, Applied Spectroscopy, vol. 58, no.12, pp. 1488-1499, 2004.
[29]  Aleix M.M., Avinash C. K., “PCA versus LDA”, IEEE transactions on pattern analysis and machine intelligence, vol. 23, no. 2, pp. 228-233, 2001.
[30]  Sharad M., Eamonn, K., Kaushik C., Michael P., “Locally adaptive dimensionality reduction for indexing large time series databases”, ACM transactions on database systems, 27, pp. 188-228, 2002.
[31]  Saurav D., Goutam N., Asish B., “Application of PCA-based hybrid Taguchi method for correlated multicriteria optimization of submerged arc weld: a case study”, Int. J. Adv. Manuf. Technol., vol. 45, pp. 276-286, 2009.