-
Paper Information
- Next Paper
- Paper Submission
-
Journal Information
- About This Journal
- Editorial Board
- Current Issue
- Archive
- Author Guidelines
- Contact Us
Nanoscience and Nanotechnology
p-ISSN: 2163-257X e-ISSN: 2163-2588
2012; 2(5): 134-138
doi: 10.5923/j.nn.20120205.01
Chemical Capping Synthesis of Nickel Oxide Nanoparticles and their Characterizations Studies
 Abstract
 Reference
 Full-Text PDF
 Full-Text HTML
M. Nowsath Rifaya , T. Theivasanthi , M. Alagar
Center for Research and Post Graduate Department of Physics, Ayya Nadar Janaki Ammal College, Sivakasi, 626124, Tamilnadu, India
Correspondence to: T. Theivasanthi , Center for Research and Post Graduate Department of Physics, Ayya Nadar Janaki Ammal College, Sivakasi, 626124, Tamilnadu, India.
| Email: |  |
Copyright © 2012 Scientific & Academic Publishing. All Rights Reserved.
This work reports aspect related to chemical capping synthesis of nano-sized particles of nickel oxide. It is a simple, novel and cost effective method. The average particle size, specific surface area, crystallinity index are estimated from XRD analysis. The structural, functional groups and optical characters are analyzed with using of SEM, FTIR and UV- visible techniques. XRD studies confirm the presence of high degree of crystallinity nature of nickel oxide nanoparticles. Their particle size is found to be 12 nm and specific surface area (SSA) is 74m2 g-1. The optical band gap energy value 3.83ev has also been determined from UV-Vis spectrum.
Keywords: Chemical capping, Nickel Oxide, Specific Surface Area, Crystallinity Index
Cite this paper: M. Nowsath Rifaya , T. Theivasanthi , M. Alagar , "Chemical Capping Synthesis of Nickel Oxide Nanoparticles and their Characterizations Studies", Nanoscience and Nanotechnology, Vol. 2 No. 5, 2012, pp. 134-138. doi: 10.5923/j.nn.20120205.01.
Article Outline
1. Introduction
- Since the innovation of nanochemistry in past decades, numbers of materials in nano-scale have been synthesized via many methods[1]. Nanomaterials have been widely used in various fields, such as photoelectric, recording materials, catalysts, sensors, ceramic materials, etc., due to their special structures and properties[2–5]. In particular, nanosized nickel oxide exhibits particular catalytic[6, 7], anomalous electronic[8, 9] and magnetic[10, 11] properties. Another important application of NiO is in battery systems[12, 13]. Non-stoichiometric nickel oxide is a good P-type semiconductor owing to its defect structure[14], a potential gas sensor for H2[15] and high active in the degradation of phenol and phenolic derivatives[16]. These applications can be enhanced by decreasing the particle size (preferably to less than 20 nm) and are highly dependent on particle size; the precise control of the size and distribution in a nanometer region is required. Recently, several methods have been developed to prepare ultrafine nickel oxide powder, including low-pressure spray pyrolysis[17], surfactant - mediated method[18], simple liquid phase process[19] and other techniques[20–22] .This work reports the synthesis of nickel oxide nanoparticles by chemical capping method using nickel chloride, alanine, ethanol and ammonia. Using alanine – an aminoacid in synthesis process is the novelty of this work and the end product nickel oxide nanoparticles will be bio-compatible in nature and will be very useful for bio-sensor related applications.
2. Experimental
- The NiO nanoparticles are synthesized by chemical capping method. In the chemical capping technique, capping molecules terminate the nano particle growth by blocking the active sites. For the synthesis of NiO nano particles, alanine was used as the capping molecule. Two master solutions were prepared: solution A, consisting of 0.1M solutions of NiCl3 in ethanol and solution B consisting of 0.001M solution of alanine in ammonia. Solution A was added drop wise to solution B with continuous stirring and the mixture was maintained at a temperature of 80℃ at atmospheric pressure for 20 hrs. Due to the insolubility of synthesised nano particles in ethanol and ammonia, the green particles settled down. The nano particles were collected and washed several times in high purity water to remove the excess ions (NH+ and CL-). The samples were dried at 60℃ in air to remove moisture contents. The samples were prepared by heating this Ni(OH)3 nanoparticles at 350℃ for 90min.X-ray diffraction (XRD) measurements were performed using a MAC Science MXP18 diffractometer with Cu Kα radiation (λ = 1.5405Å) at 40 kV and 30mA with a scanning speed in 2θ of 4◦min−1. The crystallite sizes of nickel oxide were estimated using the Scherrer equation. The surface morphology of nickel oxide nanoparticles were observed by means of a scanning electron microscope (JSM-6330TF) operated at 10 kV. Fourier transform infrared spectra of green nickel oxide nano particles were recorded using SHIMADZU spectro photometer with KBr pellet technique from 4000cm-1 – 400cm-1. For U-V absorption spectra, these samples are dissolved in glycerin with the help of magnetic stirrer for an half an hour at room temperature and then it was examined by UV-vis spectrophotometer.
|
|
3. Results and Discussion
3.1. X-Ray Diffraction Studies
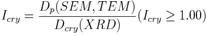
- The grown nanoparticles were characterized by powder X-ray diffractometer. Fig 1 shows the X-ray diffraction spectrum of NiO sample. This shows crystalline structure with 5 peaks. The XRD pattern shows a significant amount of line broadening which is a characteristic of nanoparticles. The XRD pattern exhibits prominent peaks at 37.3°, 43.3°, and 63°. The crystal size can be calculated according to Debye-Scherrer formula[23].
 | (1) |
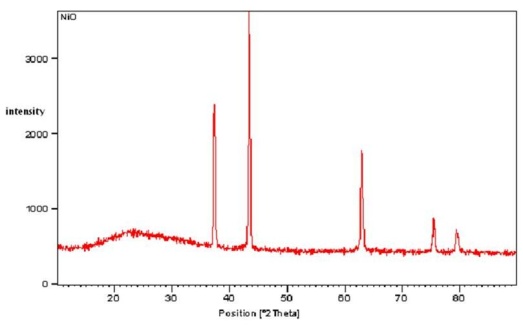 | Figure 1. XRD pattern of NiO Sample |
 | (2) |
3.2. XRD - Crystallinity Index
- It is generally agreed that the peak breadth of a specific phase of material is directly proportional to the mean crystallite size of that material. From our XRD data, a peak broadening of the nanoparticles is noticed. The average particle size, as determined using the Scherrer equation, is calculated to be 12.2 nm. Crystallinity is evaluated through comparison of crystallite size as ascertained by SEM particle size determination. Crystallinity index Eq. is presented below:
 | (3) |
3.3. XRD - Specific Surface Area
- Specific surface area (SSA) is a material property. It is a derived scientific value that can be used to determine the type and properties of a material. It has a particular importance in case of adsorption, heterogeneous catalysis and reactions on surfaces. SSA is the Surface Area (SA) per mass.
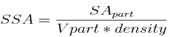 | (4) |
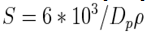 | (5) |
3.4. SEM Analyses
- The surface morphological features of synthesized nanoparticles were studied by scanning electron microscope. Fig 2 shows the SEM image of NiO nanoparticles with magnification of 5000. The instrumental parameters, accelerating voltage, spot size, and magnification and working distances are indicated on SEM image. The results indicate that mono-dispersive and highly crystalline NiO nanoparticles are obtained. The appearances of some particles are in spherical shape and some are in rod shape. We can observe that the particles are highly agglomerated and they are essentially cluster of nanoparticles. The SEM picture indicates the size of polycrystalline particles. The observation of some larger nanoparticles may be attributed to the fact that NiO nanoparticles have the tendency to agglomerate due to their high surface energy and high surface tension of the ultrafine nanoparticles. The fine particle size results in a large surface area that in turn, enhances the nanoparticles catalytic activity. So we can conclude that the prepared NiO particles are in nanometer range. The average diameter of the particle observed from SEM analysis is 97 nm, which is larger than the diameter predicted from X-Ray broadening.
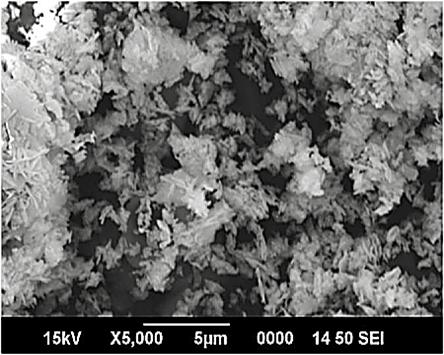 | Figure 2. SEM image of nickel oxide nanoparticles |
3.5. FTIR Analyses of Nickel Oxide Nanoparticles
- Fig 3 shows Fourier transformed spectrum of NiO nano particles at room temp. The spectrum was recorded in the range of 4000cm-1 – 400cm-1 . The FTIR spectrum shows the characteristics peaks at 418.57cm-1, 677.04 cm-1, 1629.90 cm-1, 2924.18 cm-1, 3431.48 cm-1. The band at 418.57 cm-1 reveals the presence of NiO. Despite drying this sample contained traces of water (peaks at 1629.90 cm-1, 3431.48 cm-1). There is no peak indicating the presence of ammonia and chloride as the sample was washed with high purity water. This shows that the sample contains no impurity. The same chemical composition is confirmed by the XRD pattern.
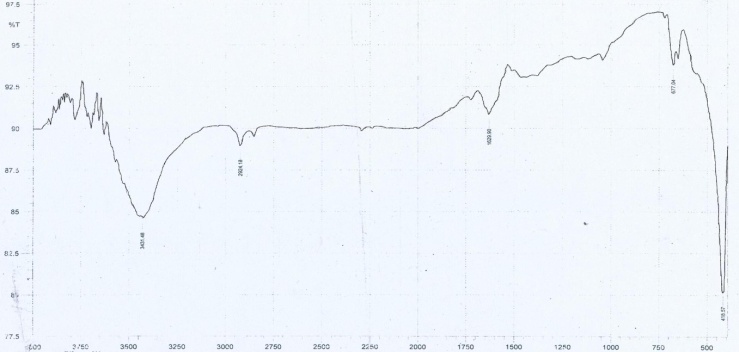 | Figure 3. FTIR spectrum of the NiO nanoparticle |
3.6. UV-Vis Studies of Nickel Oxide Nanoparticles
- Once nano nickel oxide is confirmed then the optical characterization is important. The optical absorption spectrum of nickel oxide is shown in fig 4. It can be seen that the strongest absorption peak of the as-prepared sample appears at around 342 nm, which is fairly blue shifted from the absorption edge of bulk NiO nanoparticle. The bandgap energy calculated from UV-absorption is 3.83ev. This value is higher than bulk NiO i.e. Egb=3.74ev. So it is highly agreed that the synthesized NiO is in nano scale.
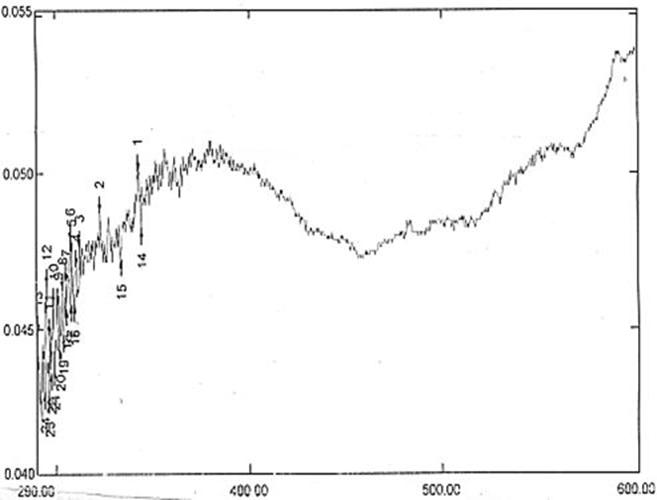 | Figure 4. UV-Vis absorbance spectrum |
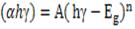 | (6) |
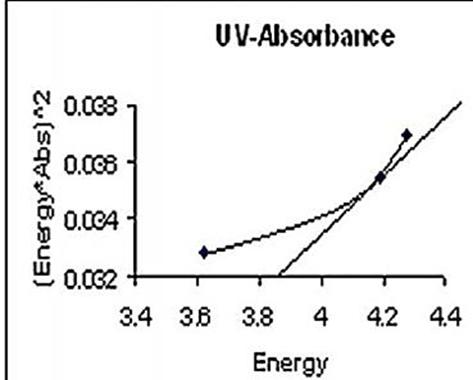 | Figure 5. UV-Vis Band gap Energy |
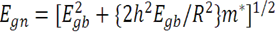 | (7) |
4. Conclusions
- Nanostructured particles of NiO have been successfully synthesized through chemical capping method using nickel chloride, alanine, ethanol and ammonia. Using alanine (aminoacid) in synthesis process is the novelty of this work. It makes the end product as bio-compatible in nature and useful in bio-sensor related applications. It has served as capping molecule and blocked the active sites at growing surfaces. XRD, SEM, FTIR, UV-Vis characterizations studies have also been done for the synthesized nanoparticles. XRD results estimate the average particle size as 12 nm and the specific surface area as 74 m2 g-1. It also confirms the high degree crystallinity nature of the prepared sample. SEM confirms that the particles are in nano size and the appearance of some particles are in spherical shape and some are in rod shape. The FTIR spectrum confirms the presence of NiO nanoparticles. Energy band gap value 3.83ev has been calculated from UV-absorption. This simple, novel and cost effective chemical capping synthesis method will be useful for industries for the preparation of nickel oxide nano-sized particles.
ACKNOWLEDGEMENTS
- The authors express immense thanks to staff & management of PACR Polytechnic College, Rajapalayam, India and Ayya Nadar Janaki Ammal College, Sivakasi, India for their valuable suggestions and assistances.