-
Paper Information
- Next Paper
- Previous Paper
- Paper Submission
-
Journal Information
- About This Journal
- Editorial Board
- Current Issue
- Archive
- Author Guidelines
- Contact Us
Nanoscience and Nanotechnology
p-ISSN: 22163-257X e-ISSN: 2163-2588
2012; 2(4): 116-124
doi: 10.5923/j.nn.20120204.05
Nanostructures Properties Data System. Critical Evaluation Methodology
 Abstract
 Reference
 Full-Text PDF
 Full-Text HTML
Aleksandr Eletskii 1, 2, Adilbek Erkimbaev 2, Georgy Kobzev 2, Michael Trachtengerts 2, Vladimir Zitserman 2
1Russian Research Centre “Kurchatov Institute”, Moscow, Russian Federation
2Joint Institute for High Temperatures, Russian Academy of Sciences, Izhorskaya 13, Bldg. 2, Moscow 125412, Russin Federation
Correspondence to: Vladimir Zitserman , Joint Institute for High Temperatures, Russian Academy of Sciences, Izhorskaya 13, Bldg. 2, Moscow 125412, Russin Federation.
| Email: |  |
Copyright © 2012 Scientific & Academic Publishing. All Rights Reserved.
This paper reviews general problems appearing in collecting, categorization, and certification of numerical properties data for nanoscale objects. It is shown how their peculiar physical properties affect preparation of the data at the preliminary stage before moving to detailed data base design. As an example, the properties data of carbon nanoforms (nanotubes, graphene, etc) are presented. The key features of the nanosized data are revealed, such as: permanent variations of the properties nomenclature, dimensional effect, and high level of the data uncertainty. The procedure is proposed for data certification taking into account quantitative statement of uncertainty as well as quality indicators. The former present the completeness of the description both of an object and a method as well the result reproducibility.
Keywords: Nanostructure, Nanomaterial, Numeric Properties Data, Dimensional Effect, Logical Structure Semistructured Data, Data Certification
Article Outline
1. Introduction
- This paper focuses on building of numerical databases on the properties of nanoscale objects. The main attention is paid to system of nanodata in general (per se) with its essential and specific features such as existing body of data, logical structure, format, representation in a data base (DB) etc. Variety of the synthesized nanoforms and types of objects with unique properties defined by dimensional factor makes impossible use of common manner of handling when applied to numeric nanodata. Here we summarize the general concepts and procedures mainly. Those were already taken as a sample at a DB building on carbon nanoforms ― fullerenes, graphenes, nanocapsules, nanotubes, nanodiamonds, etc[1, 2]. All those were discovered during last decades, but till now there is no internationally adopted nomenclature and the general specification of the data. The state in this area dramatically differs from that with common materials. On the other hand, large body of relevant data makes it promising today to choose nanocarbon as progenitor of suitable approach for evaluation properties data of the multitude of nanoscale objects. There is one more argument in support of drawing on nanocarbon data experience. We already have a lot of analytical works including reviews ofone of the authors[3-7].
2. Key Features of Nanostructures and Nanomaterials
2.1. Main Peculiarities of Numerical Data
- According to general definitions, nanoobjects are the objects that have less than 100 nm in any size (diameter, thickness, and the like). They are atomic and molecular clusters, grains, nanotubes, nanofibers, films, etc. Nanomaterials are bulk substances made from structural nanoscale units (for example, fullerite made from fullerenes). Even a cursory examination of properties of nanoobjects shows three main features which should be taken into consideration in efforts to compile and disseminate fully evaluated materials property data.A large variety of existing object types can not be confined to fixed property nomenclature. Different kinds of objects have their own lists of important features that should be incorporated in a DB. They demand the development of a flexible logic structure capable to support such data.Nanoobjects stay in intermediate position between single molecule and bulk substance. For this reason it is necessary to ascribe the nomenclature of macro properties to nanoscale objects. Examples are found in mechanical properties and thermal conductivity of carbon nanotube (CNT) and graphene, phase transitions in clusters[8], variations in the phase diagram diamond-graphite as one passes from bulk to nanoscale objects[9].The properties show significant dependence on production methods (processing history, fabrication treatments etc). There are some sources of such uncertainty due to method and conditions of synthesis, as well as uncontrollable factors, such as defects in structures, impurity on surface, etc.
2.2. Dimensional Effects
- The fundamental and universal reasons for deviations of numerical nanodata from related bulk properties lie in dependence of properties (structural, thermodynamic, electronic, transport etc.) from the characteristic size of a nanoobject. What is more, a distinction needs to be drawn between irregular dimensional dependence (with specific maxima in some cases) and regular (monotonous) inherent in the bulk objects. The first is irregular dependence of a property from number of particles that shows extremes at so-called "magic numbers", corresponding to the maximum of the cluster stability. Irregularities due to size of nanoobjects are observed also in mass spectra, ionization potentials and some other properties. The effect of size is the most principal reason of the data uncertainties. For example, thermal and electric conductivities of CNT depend significantly on its length. This is caused by a change of the transport mechanism (from ballistic to diffusive) at some CNT length[7]. Characteristic length, at which the change occurs, depends on concentration and type of defects that connected directly with processing history and conditions of specimen preparation.As a result, the only CNT length is not sufficient to obtain complete characteristic. At least, it should be accompanied by data on synthesis method and processing history. The similar case is seen also for graphenes. Its transport properties are essentially dependent on lengthwise and crosswise extents of a specimen and also from edge structure (chirality). If reliable information on sizes, structure, chirality, and defects of an object is deficient or lacking in any manner, the data on properties have rather essential uncertainty. Thus, results of measurements[10] show that thermal and electric conductivities drop off by 2-3-order for individual single-walled CNT with increasing length less than 1%.Properties of multilayered CNT and graphenes depend appreciably on number of layers that also can be considered as manifestation of dimensional effect[11]. Thus, according to measurements[12], thermal conductivity of multilayered graphene decreases in inverse proportion to the number of layers n and reaches crystal graphite value at n > 4. In case of CNT the effect is opposite ― thermal and electro conductivities of a specimen increase with enhancement of the number of layers[13].In addition to dimensional effects, it is necessary to pay attention to uncertainty of the cross-section sizes. For example, measurements of thermal and electrical conductivities, elasticity modules etc., may be fulfilled if cross-section data of an object are available. If the thickness (width) of an object is one or several layers of atoms, choice of this parameter (thickness or width) becomes arbitrary and brings forth additional problem.This problem may be demonstrated with measurements of thermal conductivity of graphene that defines as relation between heat flux through a sample and temperature gradient[14]. Obviously, the exact value of graphene layer thickness is required for calculation of the temperature gradient. It is commonly adopted that the distance between the nearest layers in the crystal graphite, equal 0.34 nanometers, is used. But sometimes, the characteristic size of carbon atom, that is less by a factor of 2 – 3, is also used. As summary, arbitrary choice of the single-layer graphene thickness results in more than 100% uncertainty in the estimation of thermal conductivity.The problem similar to the previous one appears at measurement of the Young modulus of CNT[6]. This property is defined as a relation between the stretching force and increasing sample length. In turn, the specific stretching coefficient is calculated from cross-section of a sample. There seemed no escaping the conclusion that uncertainty of CNT Young modulus can also reach 100%.The significant dependence of nanomaterial properties upon size of structural units means that a new parameter, size of a unit (crystalline particle, colloidal particle, etc), should be put into consideration. In many cases some subtle details, for example, the size distribution, volume ratio
 of space between grains, and so forth[15], may affect appreciably physical properties. Such supplementary data are also necessary for valid specification a nanomaterial, along with description of the material origin and its processing history. For example, full details are ultimately necessary for carbon cloth-like materials made with single-wall CNT, multilayered graphene paper, CNT yarn, etc.It is necessary to bear in mind that both geometrical and physical parameters of nanoscale units can show variations in values. Distribution of these parameters depends on methods and conditions in production and noticeably affects the numeric properties data. An example[16] demonstrates importance of detailed description. Processing of single-walled CNT film by nitric acid changes the type of electrical conductivity from semi-conductor to metallic[17]. Such processing removes attached molecules or absorbed radicals from surface of CNT that changes dramatically the electronic structure of an object.The above example demonstrates once more that there are some other factors which have influence on data uncertainty ― in particular molecules or radicals absorbed on surface. The physical properties of such objects are determined by a relatively large contribution of the surface as compared to bulk. Radicals’ adsorption by the CNT or graphene surface is responsible for the variation of electronic structure that has an immediate impact on electrical properties. Thus, electrical conductivity of pure graphene sheet is 100-1000 times larger than that of partially oxidated graphene with 10 % of oxygen[18]. It is caused by the energy gap that occurs at graphene oxidation. Thermal conductivity of graphene also decreases as the number of the absorbed radicals increases. The absorbed radicals act as the scattering centers for phonons, hindering collisionless movement along the specimen. There are some processes that remove radicals by heat or chemical treatment. To sum up, reliable data on type and amount of adsorbed radicals are necessary in addition to geometry and object structure characteristics for unambiguous characterization of the object as well as for data evaluation. Hence, the measured properties of nanoobjects have unremovable uncertainty that stems from their atomic structure. Nevertheless, needs of engineering design or scientific research demand, that the property data have a certain certification of quality or an integrated estimation of uncertainty. This estimation should be based on accessible data on size and structure of object, method of measurement, method of synthesis, etc. Some more details are considered in section 6.
2.3. Data Complexity
- In addition to high uncertainty of data, description of a nanoobject involves yet another peculiarity. The point is that properties make sense and value for users only when expanded descriptions of measurements method, state of the specimen, environmental and other conditions are available. Sufficient identification should include the whole set of the quantitative and qualitative features concerning structure, sizes, morphology, synthesis method, etc. It is pertinent to note that the same description is inherent not in objects of nanoworld only, but in materials elsewhere as well. Their properties are always defined by wide complex of factors (technology and structural features, environment, etc.). This feature differs distinctly a material from common substances which properties are defined by chemical composition and/or structural formula. In pursuing these aims the special concept of materials metrology[19] was designed to develop DB’s on materials. The principles and practices set forth in this work demand that results of measurements were presented necessarily together with data on the measurement method and object characteristics, and reliability of numerical values is defined by scope of available data. In result of experience during development a DB for superconductors and ceramics, Munro[19] has suggested procedures for comprehensive certification of material quality data of any kind. The importance of these procedures increases at considering objects of nanoworld, as number of additional factors involved by synthesis and/or measurement methods, also increases. Any of these new factors have more effect on numeric data and formulations than it may be expected.
3. The General Approach to Collecting and Processing of Nanoobject Data
- With use of data analysis principles[19-21] that are already applied at material science, and specific experience of data nanostructures evaluation[3-7], the approximate schematic on Figure 1 may be proposed. Design of data collection is going on by two directions: the characterization of objects and the specification of properties.
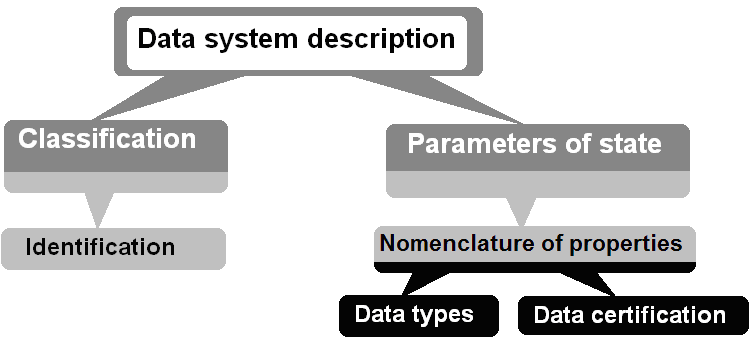 | Figure 1. Schematic description of data system designing |
4. Categorization of Nanoobjects
- As a rule first step involves identification of an object (Figure 1) which sets apart it from the heading of classification according to adopted set of identifying signs. We have here analogy to identification in chemistry when a substance from a group (elements, oxides, hydrides, etc.) is pointed out by chemical formula. No conventional classification of nanoobjects is yet accepted. For example, fullerenes and CNT may be named clusters and large molecules for both as well. So, fullerenes as molecules do not raise any doubt, but CNT, because of appreciable diversity in their size and structures, ambiguity in classification seems to be a cause of unavoidable difficulty. Problems arise also when we consider a family of graphenes. The classical definition of graphene corresponds to a single-layered hexagonal graphite structure. However, many authors consider the structures, consisting from two or even of several closed layers, as graphene as well. So, it is necessary to define and adopt the number of graphene layers when graphene converts to graphite. The question is typical for nanostructures with dimensional effects. A simple scheme was suggested in[15], where authors divided the whole nanoworld on two kinds ― separated individual nanoclusters and nanocluster's systems (materials). Moreover, they introduced 6 cluster types, based on methods of synthesis only: molecular ligands, gas ligandless, colloidal, solid-state, matrix, film. Thus, all kinds of fullerenes and CNTs come under the heading of ligandless gas phase clusters. Pokropivny and Skorokhod[23] distinguish four types of objects by the dimensions as criterion, instead of separation of all nanostructures into two categories (materials and clusters). This number can have four values from 0 to 3. Value K=0 means cluster with length no more than 100 nm in every dimension. On the contrary, value K=3 is applied to common macroscopic substance, or material. The prefix «nano» in this case only shows the size of elements that assemble the material. Intermediate values K=1, 2 are applied to 1-dimensional and 2-dimensional structures, which have macroscopic size along one or two dimensions. For example, such are nanowires and nanofilms. In the case, when criterion mentioned is used to certify structural elements that form the defined object, the dimension, however, can accept only 3 values (L=0, 1, 2). Then the class of objects, that assembled by elements of same type, may be described by «nanoformula» K D L . All the clusters of CN type, that are chemical forms of carbon atoms, are referred to the sole 0D0 class, because dimension signs (K=0, L=0) refer equally to cluster and monomer. On the other hand, nanotube or graphene assembled by those elements are defined by formulas 1D0 and 2D0. If an object is assembled by elements of several types, the formula assumes the form KD{L,M,N …} and K≥max{L,M,N…}. The number of classes defined with this classification is essentially limited. For example, when only three structural elements are used, the number of classes is no more than 36[23].
5. Object Identification
- Identification procedure sets apart unequivocally an object from a class of similar ones (CNT, graphenes, clusters, and etc.), that fall in the heading of the classification. For instance, it is necessary to use some identifying signs of an object, such as chemical composition, size, structure, etc., to set apart it from the class, defined by topological nanoformula. Thus, the topological formula 0D0 for cluster AN should be followed by chemical formula of a monomer A, monomer number N, and by symbol of point group (D3h, Td, Oh, etc). Precisely such tables of atomic and molecular clusters data were used for the Cambridge Cluster Database building (www-wales.ch.cam.ac.uk/CCD.html). Identification by number N appears to be impractical when it became closer to 103÷104. In this case the more convenient characteristic is the linear size expressed in nanometers accompanied by crystal type and features of morphology. The representation of modelling results for several carbon cluster families[24] may be an illustration for said above. The proper identification is achieved there by only pointing on cluster diameter and structure type: bucky-diamonds, icosahedral clusters, fullerenes, and fullerenelike structures (carbon cages and carbon onions). Analysis of nanodiamond detonation synthesis[2, 25] needs also to consider nanocluster types. Particles of nanographite, nanodiamond, and nanodiamond, covered with a graphite layer, appear in reaction zone. Each of them is qualified by diameter, as to the last type, it is characterized also by the layer thickness.The other wide class of nanostructures is nanotubes. These objects are included in a class defined by the topological formula 1D0. Specific objects may be set apart from that class by monomer chemical formula (C, BN, BeO), chirality indexes, diameter and number of walls. Besides, exact identification needs additional data on structural defects, state of surface, and some other factors induced by on material synthesis. These examples show that the identification rules can not be set a priori, i.e. specific peculiarities of every class must be taken into account.
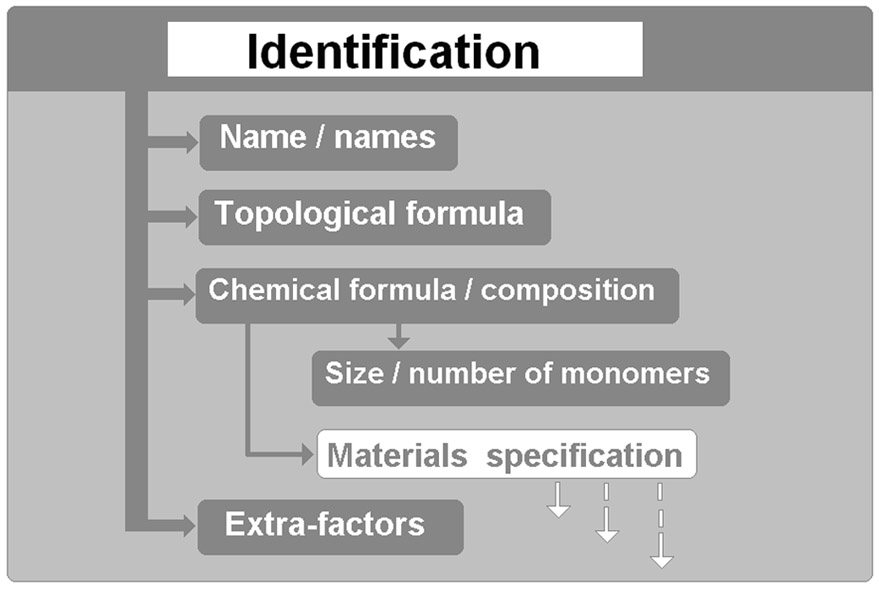 | Figure 2. Schematic of the nanoscale objects characterization |
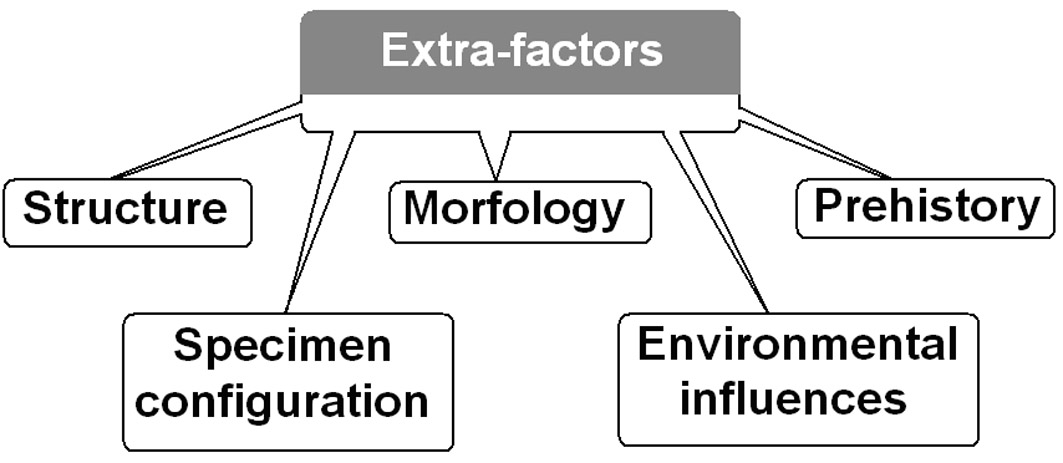 | Figure 3. Data block “extra-factors” |
6. Data Certification
6.1. Procedures of the Data Certification
- Data certification (DC) is a set of procedures that fulfils multi-aspect evaluation of data presented and results in estimation of total uncertainty, i.e. error value and/or some data quality indicator. In some exceptional cases it may be enough to adopt a decision that the data are acceptable in accordance with some criteria. According to the simplified scheme in Figure 4, the first step includes three procedures for evaluation of reliability, completeness, and consistency of the data. The first of them should show, whether identification (specification) of the object is completely presented in the data. This part of certification is important, as materials properties are of no value without detailed characteristics of the material. The identification may be called complete when the values of all identifying signs are known and the blocks, schematically outlined in Figure 2, are filled out. The second DC procedure (Figure 4) should provide answer to the same question, relating now to measurement (or prediction) method, i.e. whether the description is sufficient for evaluation of results. Development of nanotechnologies was a result of widely used high-precision physical methods that allow determination of structural characteristics and chemical composition of a sample: electronic (ionic) microscopy; Raman-spectroscopy; methods of electronic spectroscopy (Auger-spectroscopy, X-ray photoelectronic spectroscopy, Electron Energy Loss Spectroscopy and many others. The foremost goal in describing measurement method is to present sufficient information for comparability and estimation of uncertainties. Sufficient information on applied method allows the estimation of reliability, taking into account, that all techniques have limited ranges of practical use.
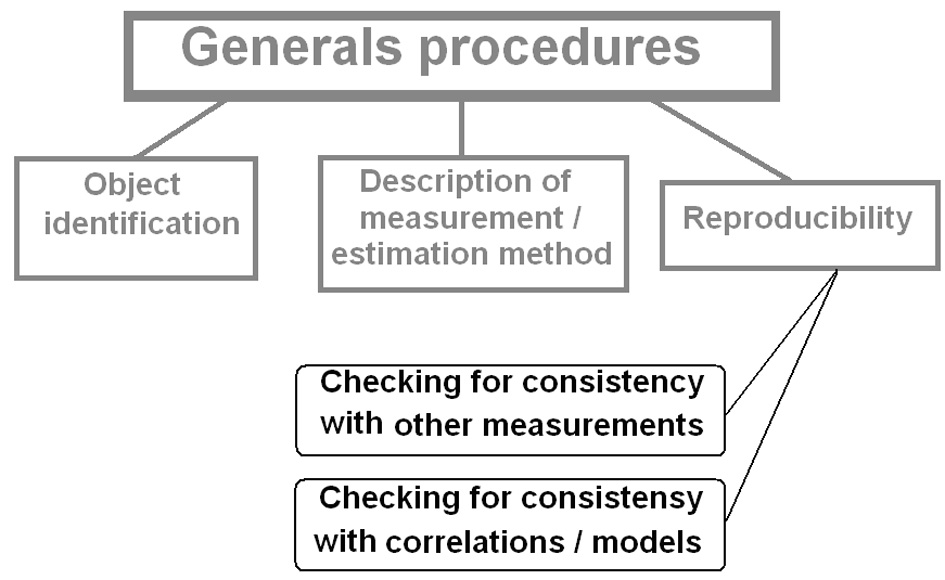 | Figure 4. Schematic of the data certification |
6.2. Components of Nanoobject Data Uncertainty
- In addition to quality assessment, numerical estimation of the data uncertainty must be introduced. Some versions of estimation procedures for uncertainty are necessary according to variety of nanostructure types, forms, measurement methods, and, even when all objects are in nanocarbon family only. The first of them is applicable when data type depends only slightly on features peculiar to nanosize object. Thus, all publications on thermodynamic properties of fullerenes and fullerites represent results in the same form that is common in thermochemistry of traditional substances. Calorimetric methods together with standard estimations of molecular constants allow usage of common estimations of uncertainty based on any statistical method for treating[27]. The metadata must account for representation of uncertainty: standard deviation, level of confidence for the interval, combined uncertainty that includes extension of uncertainties from variables to the property. It is a common practice, when applied to nanostructures, to represent uncertainty as root-mean-square deviation expressed in absolute or relative values.The second variant may be used when "ineradicable" uncertainty stems from the dimensional effect or from specific synthesis method. The expert, responsible for data entry and maintenance of DB, takes into consideration possibilities of the method in combination with reproducibility of obtained results. As a result, the expert can offer an estimation of uncertainty in the form of value interval, but without probability interpretation, i.e. missing distribution law within the interval. The third variant can be applied when theoretical methods of calculation are used. Notice that nanostructures data have a specific feature ― published data, calculated by theoretical methods, become nowadays more numerous, along with improvement of data quality (accuracy and reliability). As appropriate estimation of uncertainty, some indicators may be considered, for example, (1) systematic error, inherent in each of methods, and usually presented in publication; (2) qualitative assessment of the reproducibility (measure of agreement) received from comparison with similar calculations or available experiments. The expert estimation presents the result in form of possible value interval as well as those pointed out in previous variants.
|
6.3. Data Quality Categories
- Quality indicators, combined with numerical estimation of uncertainty, are a foundation for data to be distinguished by the categories, as it already was applied for common materials[19]. Table 2 shows how numeric data may be assigned to any of proposed categories defining their reliability. There are 8 such categories. Experimental as well as theoretical data may be assigned to be among three quality categories (1-3 for experimental, 4-6 for theoretical data). For instance, experimental data may be assign to the category 1, if statistical error is known (that is the common situation in research of macroscopic objects) and each indicator that define reproducibility and completeness of data is qualified with high level. In more difficult case (e.g., occurrence of dimensional effect) the same level of reliability is assigned when uncertainty is shown as interval of values and the same level of quality indicators is present. Decrease in quality and/or absence of numerical estimation of uncertainty transfers the experimental data to category 2 or 3. Theoretical data may be qualified in the same way ― by availability of systematic error that is inherent in the model and quality indicators (categories 4-6).In actual practice, some other categories are forced to be used, commercial and typical. Data of the first kind are provided by manufacturer to inform a customer on principal characteristics of products (for example, fullerene or CNT). Typical data are derived from preliminary reports with no indication of reliability or uncertainty. Nevertheless, these data may be used for order of magnitude estimates or functional dependencies. In the absence of alternatives commercial or typical data may be loaded into DB with indication that any assessment of reliability is not available.
7. Conclusions
- The present work suggests general principles for data collection on properties of nanoobjects. They may be used as the guideline of data base building. The paper includes description of logical data structure, adapted to specific features of nanostructures, and methods of data certification and categorization.When creating a logical structure an expert defines the necessary set of identifiers and nomenclature of properties, as well as specifies types and data formats for each attribute. The foreseen requirements for data structure, stemming from specific properties of nanostructures, can be met by the widely used semistructured data (SSD) model[22, 26]. The model has been introduced to accommodate all forms and kinds of data that come from multiple sources with differences in notation, meaning etc. In SSD model the information that is typically associated with a schema is contained within the data, which is sometimes called "self-describing''. In such DB there is no clear separation between the data and the schema, and the degree to which it is structured depends on the application. The benefit is that these data do not have a rigidly and predefined schema. Some different lines to attack building data base of that type were proposed based, for example, on XML tools[28]. We applied technology that used free distributed object-relation data base system with open code PostgreSQL. It combines traditional relational data model with maintenance of “fuzzy” data structure. The relative stability of the data “frame” described above (sections 4 and 5) serves as additional argument in supporting the technology inheriting the capabilities of conventional tools. The potential of PostgreSQL have appeared to be quite sufficient for DB on nanocarbon properties[1], despite exclusive variety of structures and materials of this class. Along with variety of data structures, there is a marked feature of numeric data for nanoobjects ― their level of uncertainty is incomparably high. Some factors may be responsible for basically unavoidable uncertainty due to nanoscale nature of an object. An uncertainty also rises with involving into consideration both types ― experimental and theoretical data in absence of reliable approach to assessment of confidence.So, it is possible to describe adequately confidence in data only by involving the complete body of available information on uncertainty, numeric assessments, as well as quality indicators. In the section 6 we developed the procedure that may be used for certification of data by introduction of some quality indicators and assigning data to categories of reliability (table 2). In a broad sense, reliability is defined by available numeric value of uncertainty, completeness data on both object and research method, and reproducibility of measurements/estimations. The metadata include quality indicators (object, method, reproducibility) with estimation according to the three-level scale, category on reliability and the indexes defining the uncertainty (random or systematic, absolute or relative, etc.). The described conceptual scheme may be adjusted to arbitrary nanoscale objects by changing (or expanding) of classification scheme, identification standards, properties nomenclature, and, if it is necessary, the certification procedure. From a practical standpoint it is very important that the soft proposed here is fully suited to make such adjustment even an expert may lack sufficient knowledge of computer technology.
ACKNOWLEDGEMENTS
- Authors thank the Russian Foundation for Basic Research for support (Grant No. 10-08-00623).
References
| [1] | A.O. Erkimbaev, V.Yu. Zitserman, G.A. Kobzev, "Systematization of Data on the Physical and Chemical Properties and Application of Carbon Nanostructures", High Temperature, vol.48, no.6, pp.830–836, 2010. |
| [2] | Y. Hu, O.A. Shenderova, D.W. Brenner, "Carbon Nanostructures: Morphologies and Properties", Journal of Computational and Theoretical Nanoscience, vol.4, no.2, pp.199-221, 2007. |
| [3] | A.V. Eletskii, "Carbon nanotubes", Physics Uspehi, vol.40, no.9, 899–924, 1997. |
| [4] | A.V. Eletskii, "Carbon nanotubes and their emission properties", Physics Uspehi, vol.45, no.4, pp.369–402, 2002. |
| [5] | A.V. Eletskii, "Sorption properties of carbon nanostructures", Physics Uspehi, vol.47, no.11, pp.1119–1154, 2004. |
| [6] | A.V. Eletskii, "Mechanical properties of carbon nanostructures and related materials", Physics Uspehi, vol.50, no.3, pp.225–261, 2007. |
| [7] | A.V. Eletskii, "Transport properties of carbon nanotubes". Physics Uspehi, vol.52, no.3, pp.209–224, 2009. |
| [8] | R.S. Berry, B.M. Smirnov, "Phase transitions in various kinds of clusters", Physics Uspehi, vol.52, no.9, pp.137–164, 2009. |
| [9] | C.C. Yang, S. Li, "Size-Dependent Temperature−Pressure Phase Diagram of Carbon", J. Phys. Chem. C, vol.112, no.5, pp.1423-1426, 2008. |
| [10] | E. Brown, L. Hao, J.C. Gallop, J.C. Macfarlane, "Ballistic thermal and electrical conductance measurements on individual multiwall carbon nanotubes", Appl. Phys. Lett., vol.87, Ar# 023107, 2005. |
| [11] | А.V. Eletskii, I.M. Iskandarova, А.А. Knizhnik, D.N. Krasikov, "Graphene: fabrication methods and thermophysical properties", Physics Uspechi, vol.181, no.3, pp.233-268, 2011. |
| [12] | S. Ghosh, W. Bao, D.L. Nika, S. Subrina, E.P. Pokatilov, C.N. Lau, A.A. Balandin, "Dimensional crossover of thermal transport in few-layer grapheme", Nature Materials, vol.9, no.7, pp.555-558, 2010. |
| [13] | H.J. Li, W.G. Lu, J.J. Li, X.D. Bai, C.Z. Gu, "Multichannel Ballistic Transport in Multiwall Carbon Nanotubes", Phys. Rev. Lett., vol.95, Ar#086601, 2005. |
| [14] | D.L. Nika, E.P. Pokatilov, A.S. Askerov, A.A. Balandin, "Phonon thermal conduction in grapheme: Role of Umklapp and edge roughness scattering", Phys. Rev. B, vol.79, Ar#155413, 2009. |
| [15] | I.P. Suzdalev, P.I. Suzdalev, "Nanoclusters and nanocluster systems. Assembling, interactions and properties", Russian Chemical Reviews, vol.70, no.3, pp,177–210, 2001. |
| [16] | Z.J. Han, K. Ostrikov, "Controlled electronic transport in single-walled carbon nanotube networks: Selecting electron hopping and chemical dopping mechanisms", Appl. Phys. Lett., vol.96, Ar#233115, 2010. |
| [17] | A.S. Lobach, L.I. Buravov, N.G. Spizyna, A.V. Eletskii, A.P. Dementyev, K.I. Maslakov, "Temperture-dependent resistance of Single-Walled Carbon Nanotube Films", Khimiya Vys. Energiy, vol.45, no.4, pp.1–7, 2011. |
| [18] | Y. Hernandez, V. Nicolosi, M. Lotya, et al, "High-yield production of grapheme by liquid-phase exfoliation of graphite", Nature Nanotechnology, vol.3, no.9, pp.563-568, 2008. |
| [19] | R.G. Munro, "Data Evaluation, Theory and Practice for Materials Properties", Special Publication 960-11. Washington, DC: Materials Science and Engineering Laboratory, NIST, 2003. |
| [20] | B. Moniz, "Nomenclature and current standards for identificaton of engineering materials". In: Newton, C.H. (Ed.) Manual on the Building of Materials Databases. ASTM Manual Series: MNL 19. Philadelphia: American Society for Testing and Materials, 1993. |
| [21] | C.H. Newton, (Ed.) Manual on the Building of Materials Databases. ASTM Manual Series: MNL 19. Philadelphia: American Society for Testing and Materials, 1993. |
| [22] | A.O. Erkimbaev, V.Yu. Zitserman, G.A. Kobzev, L.R. Fokin, "The logical structure of physicochemical data: Problems of numerical data standartization and exchange", Russian Journal of Physical Chemistry A, vol.82, no.1, pp.15-25, 2008. |
| [23] | V.V. Pokropivny, V.V. Skorokhod, "New dimensionality classifications of nanostructures", Physica E., vol.40, no.7, pp.2521-2525, 2008). |
| [24] | M. Yu, I. Chaudhuri, C. Leahy, S.Y. Wu, C.S. Jayanthi, "Energetics, relative stabilities, and size-dependent properties of nanosized carbon clusters of different families: Fullerenes, bucky-diamond, icosahedral, and bulk-truncated structures", J. Chem. Phys., vol.130, Ar#184708, 2009. |
| [25] | G. Benedek, P. Milani, V.G., Ralchenko (Eds.), "Nanostructured carbon for advanced applications", NATO Science Series. II. Mathematics, Physics and Chemistry – Vol. 24. Berlin, Heidelberg, Dordrecht, New York: Springer, 2001. |
| [26] | S. Abiteboul, P. Buneman, S. Suciu, "Data on the Web: From Relations to Semistructured Data and XML", Burlington, Massachusetts: Morgan Kaufman Publishers, 2000. |
| [27] | V.V. Diky, G.J. Kabo, "Thermodynamic properties of C60 and C70 fullerenes", Russian Chemical Reviews, vol.69, no.2, pp.95-104, 2000. |
| [28] | M. Graves, Designing XML Databases., Jersey: Prentice Hall, 2002. |