-
Paper Information
- Next Paper
- Paper Submission
-
Journal Information
- About This Journal
- Editorial Board
- Current Issue
- Archive
- Author Guidelines
- Contact Us
Nanoscience and Nanotechnology
p-ISSN: 22163-257X e-ISSN: 2163-2588
2012; 2(4): 90-98
doi: 10.5923/j.nn.20120204.01
Synthesis, Characterization and Studies of PANI-MMT Nanocompoisites
 Abstract
 Reference
 Full-Text PDF
 Full-Text HTML
Sridhar Pande 1, Swaruparani H 1, Mahesh D. Bedre 1, Ravishankar Bhat 1, Raghunadan Deshpande 2, A. Venkataraman 1
1Department of Materials Science, Gulbarga University, Gulbarga-585106, Karnataka, India
2H.K.E.’s Matoshree Taradevi Rampure Institute of Pharmaceutical Sciences, Sedam Road, Gulbarga-585105, Karnataka, India
Correspondence to: A. Venkataraman , Department of Materials Science, Gulbarga University, Gulbarga-585106, Karnataka, India.
| Email: |  |
Copyright © 2012 Scientific & Academic Publishing. All Rights Reserved.
In this work synthesis & characterization of composite materials based on montmorillonite (MMT) clay and intrinsically conducting polyaniline (PANI) is studied. The MMT type of clay used is locally available in the region which was used after chemical activation. The main thrust of this work was to know the possibility of usage of locally available clay to synthesise novel nanocomposites. Synthesises of PANI and processing and treatment of this clay was carried out in the lab by the authors. PANI was successfully incorporated into MMT to form PANI-MMT nanocomposites. The resulting organic-inorganic hybrid material, PANI- MMT has been characterized by various physicochemical techniques. Formation of PANI inside the clay tactoid has been confirmed by X-ray diffraction studies. Infrared spectroscopy studies reveal the presence of physicochemical interaction, probably hydrogen bonding, between clay and polyaniline. One of the main technological applications of conducting polymers, particularly PANI, is in the area of corrosion protection of active metals. PANI-MMT nanocomposites synthesized using the present method is generally used to protect steel surface against corrosion.
Keywords: Nanocomposites, PANI, Infrared Spectroscopy, Conducting Polymer, Corrosion
Article Outline
1. Introduction
- Among the large amount of layered solids such as graphite, layered double hydroxides, transition metal dichalcogenides, metal phosphates and metal phosphonates, clay minerals especially the members of smectite group are the most suitable candidates for synthesis of polymer nanocomposites, because these possess a unique structure and reactivity together with high strength, stiffness and high aspect ratio of each platelet. In particular, montmorillonite [M(OH)2.nH2x(AlMgx-2x)Si4O10(OH)2.nH2O] and hectorite [Mx(Mg3-x Lix)Si4O10H2O], are most widely used in this field. Montmorillonite is a hydrophilic mineral and belongs to the general family of 2:1 (so -called smectite) phyllosilicates composed of stacked layers of aluminum octahedron and silicon tetrahedrons. Substitution of aluminum with magnesium will create an overall negative charge which is compensated by exchangeable metal cations such as Na+, K+, Ca2+, Mg2+[1]. Characteristics of clay minerals which make them important are their particle size and shape, cation exchangeability, adsorption properties and large surface area. The unique structure, low negative charge per unit cell and weak van der Waals forces between adjacent layers can allow the interlayer space of clay minerals to expand upon the intercalation of organic cations, organic solvent or polymer. Clay minerals speically montmorillonite have widely been employed to synthesize polymer-clay nanocomposites due to their swelling behaviour, ubiquity and low cost. With recent advancement in nanotechnology and its potential applications, organic -inorganic nanocomposites have received considerable attention due to the special nature of both components. Conducting polymers including PANI themselves could find their niche in electronics, pharmaceutical, biomedical industries etc. However, there are intrinsic problems with these materials that prevent them from wide commercial applications such as poor processability due to rigid chemical structure and porosity of their coating. Some of these limitations can be overcome by reinforcing the conducting polymers with nanosized filler such as clay particles[2]. The incorporation of clay in conducting polymers may provide characteristics which cannot be attained from pristine conducting polymer such as processability[3]. Among organic-inorganic nanocomposites, PANI-MMT nanocomposites are the most prevalent and interesting due to the special properties as well as wide uses of polyaniline[4], the nature, abundance, low cost of MMT and attractive features such as a large surface area and ion –exchange properties[5].During the last decade, with the developments in frontiers of nanoscience and nanotechnology, considerable attention has been paid to the synthesis and application of functionalized clay/polymer composites[6-8]. The chemistry of functionalized polymers, copolymers and nanoclay composites has attracted greater attention of material scientists and organic chemists in recent times. Clay minerals have been adopted to the field of nanocomposites because of their ultrafine particle size, large surface area and intercalation property in applications such as reinforcement materials with polymers, oil and natural gas separation and extraction, electronic noses and other application devices, particularly, composites of polyaniline and Montomorillonite (MMT)/Bentonite (BT) are potential fillers for the modification of the mechanical and conducting properties of polymer matrices[8-21].
2. Materials and Methods
- Synthesis of PANI and its MMT nanocompositesThe Polyaniline is synthesized via chemical oxidative method. In this method, 0.1 M aniline is dissolved in 0.3 M of sulphuric acid solution. This mixture is kept in ice cold water and 0.1 M ammonium persulphate solution is added, act as oxidizing agent. The polymerization was carried out in cold temperature under magnetic stirring. The resulting PANI was filtered, washed with excess deionized water, dried in vacuum for 2 days. The final polymer ground using a mortar and pestle, is used for characterization. In similar method, pani-MMT composites synthesized chemically from aniline free anilinium -MMT (different weights of MMT viz., Pani.0.5, Pani.0.75, Pani. 1.0, and Pani. 1.25 dispersion in 0.3 M sulfuric acid solution. The 0.1 M ammonium persulfate solution was used as oxidizing agent. The polymerization was carried out at room temperature under magnetic stirring. The resulting PANI -MMT was filtered, washed with excess deionized water, dried in vacuum for 4 days. The final PANI -MMT nanocomposites were ground using a mortar and pestle for X -ray diffraction.CharacterizationThe chemical analyses were obtained by using X-ray diffraction studies (Philips goniometer, PW 1730/10, using the K
 radiation of copper). The infrared spectra obtained by using KBr pellets were recorded with a Perkin Elmer 783 dispersive from 4000 to 400 cm-1. Thermo gravimetric (TG) and differential scanning colorimetry (DSC) experiments were performed using NETZSCHSTA 409 PC. TG and DSC data were obtained at a heating rate of 10℃/min up to 900℃ under Argon atmosphere. Thermal studies of PANI-composites and pure PANI is analyzed using Linseis STA PT 1600 thermal analyzer at 100C/min heating rate under static air atmosphere. The target temperature for the entire sample is maintained up to 900℃.
3. Results and Discussions
- FTIR analysis:
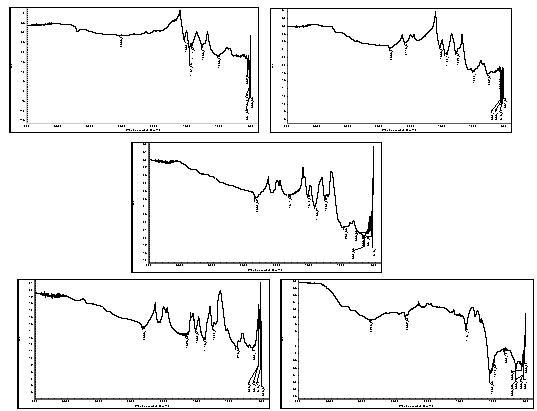 | Figure 1. FTIR spectra of PANI_MMT nanocomposites with different concentrations of clay |
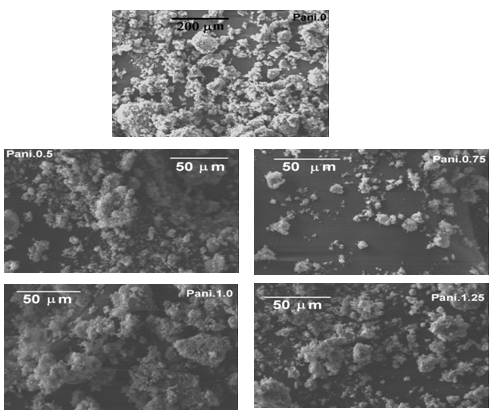 | Figure 2. SEM images of Pani-clay at low and high magnifications |
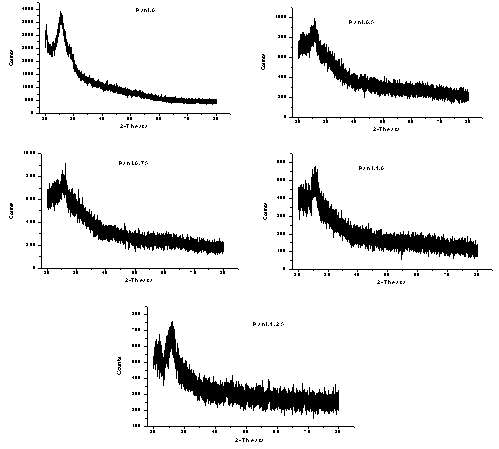 | Figure 3. XRD spectra of PANI_MMT nanocomposites with different concentrations of clay |
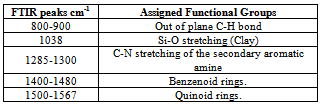 FTIR analysis: The spectrum showed peaks at 1290 cm-1, 1441 cm-1, which are the characteristic peaks of polyaniline. The relative intensity of the 1557 and 1481 cm-1 indicates the oxidation state of the material. For Pani, the peak area ratio was 1.0 the polymer is in the emeraldine salt. The peaks observed at 500-600 cm-1, 1067 cm-1 are due to the presence of clay in the composite. The peak assignments are listed in the table[22- 25]. The spectrum showed characteristic peaks of polyaniline and clay at 1067 and 1430 cm-1, the IR spectrum for the different composites is shown in the figure 1. It was difficult to detect the presence of polyaniline and clay in this system using IR spectrum. This could be due to the masking effect of polyaniline on the powder. As this was a filtered system, very fine particles were present in the system. It is believed that the polyanilne matrix surrounded these particles, making it difficult to characterize them. Figure 2 shows SEM micrographs images of Pani-clay composites with different amount of clay in the composites. Scanning electron micrograph (SEM) revealed some interesting morphological differences between the pure bentonite clay and Pani-clay composites. The surface of pure clay was flaky texture reflecting its layered structure[26] as shown in figure. Pani has a rod like network texture and Pani Clay composite has flower petals like appearance. It can be clearly seen in micrographs of all clay composites that the textures of both pani-clay are retained in the composites which are of different grain sizes. The micrographs of pani-clay 1.25% composites exhibit more ordered and dense structure (smaller sizes with high density of granules per unit area) comparing to pani-clay composite comparing to pani-clay 1.0% clay (bigger sizes with less density per unit area). It shows that the increase in clay percentage in the preparation solution will increase the compactness.
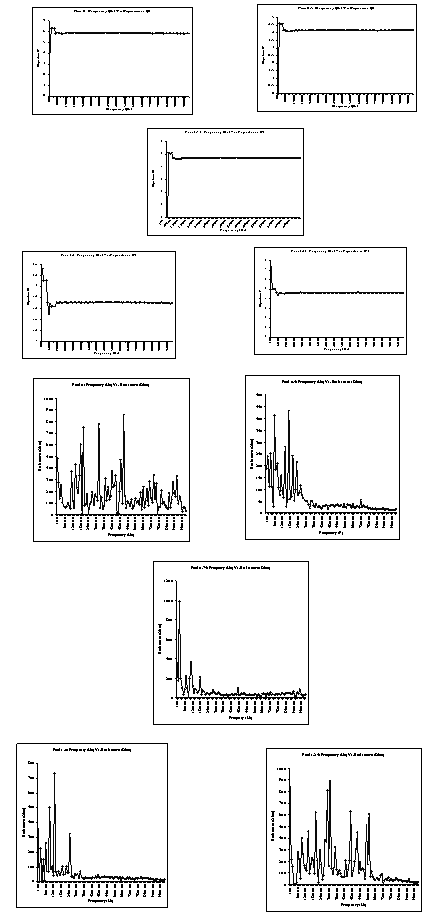 | Figure 4. Electrical parameters versus frequency |
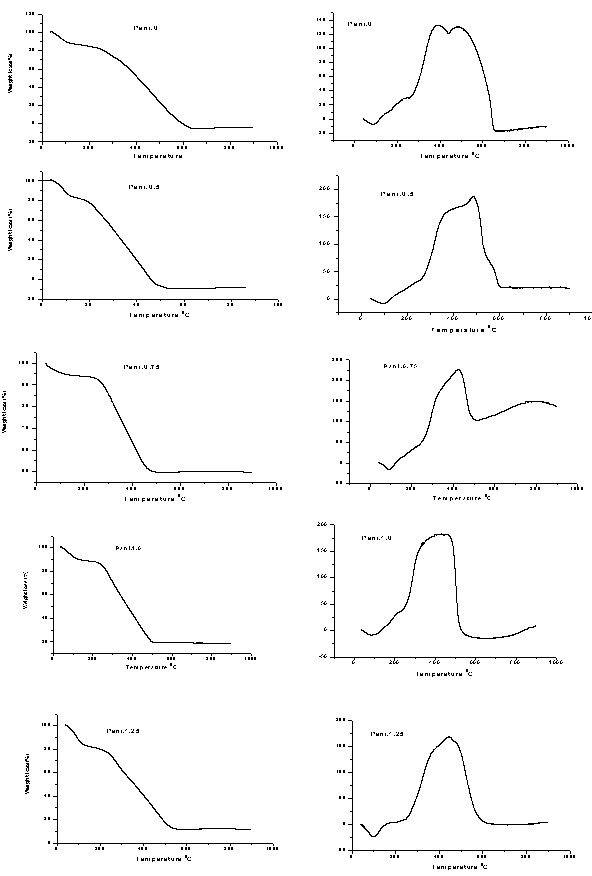 | Figure 5. TGA/DSCtraces of pani-clay composites |
4. Conclusions
- Polymer-clay based composites of pani were successfully obtained by polymerizing polyaniline in the presence of ammonium persulphate-impregnated clay by chemical oxidative method. From these XRD patterns and the SEM photographs it is observed. That there is possible intercalation of PANI in clay. This justified the objective that this clay can be used for synthesizing PANI clay composite. The intercalation of Pani- Bentonite. The shift in IR peaks of the Pani-clay samples suggest interaction between the Pani-clay composites. The morphological study from the SEM analysis shows the compact morphology with the increase in clay. From the TGA/DSC results, we observe the thermal stability of the nanocomposites of Pani-clay is relatively enhanced through the intercaltion. Frequency versus various electrical parameters graph show, enhanced shifts in values of electrical parameters, reflecting possible changes in property values with relative percentage of clay.
ACKNOWLEDGEMENTS
- Financial support from the DAE–BRNS (No.2009/34/14/ BRNS), UGC Innovative programme (No. F.14-54/2007 Innov/assist) and VGST, Bangalore (Proposal ref. no D38/7) are acknowledged.