-
Paper Information
- Next Paper
- Previous Paper
- Paper Submission
-
Journal Information
- About This Journal
- Editorial Board
- Current Issue
- Archive
- Author Guidelines
- Contact Us
Nanoscience and Nanotechnology
p-ISSN: 2163-257X e-ISSN: 2163-2588
2012; 2(3): 82-85
doi: 10.5923/j.nn.20120203.07
Synthesis and Characterization of CeO-ZnO Nanocomposites
 Abstract
 Reference
 Full-Text PDF
 Full-Text HTML
Ashwani Sharma, Pallavi Sanjay Kumar
Dept. of Physics,M.D.University, Rohtak, .Haryana, 124001, India
Correspondence to: Ashwani Sharma, Dept. of Physics,M.D.University, Rohtak, .Haryana, 124001, India.
| Email: |  |
Copyright © 2012 Scientific & Academic Publishing. All Rights Reserved.
A novel CeO-ZnO nanocomposite has been synthesized by a sol-gel method based on polymeric network of polyvinyl alcohol(PVA). In this work mixed solvent of 50:50 ethanol water was used to dissolve cerium nitrate,nickel nitrate and PVA. The mixture was heated to 80OC to form a homogeneous gel solution. The obtained gel was slowly heated to evaporate the solvent to form a hard homogeneous gel. The hard gel was calcinated at temperature 600OC for 4 hours and 8 hours and converted into nanocomposite. The prepared nanocomposites have been characterized using X-Ray Diffraction(XRD), FTIR, UV-VIS. In the observed spectral features, the peak position, intensity and bandwidth were related to some structural properties of investigated samples. The size of nano particles of CeO-ZnO nano composites heated at 600O C for 4 hours and 8 hours using Scherrer Formula comes out to be 5.4 nm and 6.8 nm. CeO-ZnO nanocomposites shows increase in absorption when it goes from UV region to visible region.
Keywords: Nanocomposite, Synthesis, XRD, FTIR, UV-VIS, SEM
Article Outline
1. Introduction
- ZnO nano particles are of great importance because of their unique electrical, optical, gas sensing and of large bonding energy. Due to its low cost and other properties like good electrical, optical, nontoxic behaviour, it has many applications in different fields like solar cells, gas sensors, spintronics, ultraviolet lasers etc.[1-2]Cerium Oxide is used as catalysis field and in chemical and mechanical polishing. Cerium Oxide is also well known for its optical properties and it can filter ultraviolet (UV) rays. It shows a UV cut off at around 370 nm. Cerium Oxide is a Semi-conductor with a band gap of around 3.0-3.2 eV [3].The study of composite material i.e. mixture consisting of at least two phases of different chemical composition has been of great interest from both fundamental and practical point of view. The physical properties of such materials can be combined to produce material of desired response. Composites have good potential for various industrial fields because of their excellent properties such as high hardness, high melting point, low density, low coefficient of thermal expansion, high thermal conductivity, good chemical stability and improved mechanical properties such as higher specific strength, better wear resistance and specific modulus. Composites are used in making solar cells, optoelectronic device elements, laser diodes and light emitting diodes (LED), industrial applications in aircraft, military and car industry. Ce0-ZnO nanocomposite can be used for removal of organic pollutants from industrial waste water.[4-6] CeO2–ZnO nanocomposite in a solution phase synthetic system provides an efficient route to enhance the field emission performance of ZnO nanostructures, which could be extended to other potential applications, such as chemical sensors, optoelectronic devices and photocatalysts.Besides this, the composites getting from the transition metal oxides are started to use as humidity and gas sensors. The use of these specialized materials can provide solution to difficult engineering problems. A chemical synthesis of organic-inorganic composites can be provided by the sol-gel process. The sol-gel process is broadly defined as one in which a useful product is prepared from a solution or suspension of precursor materials via hydrolysis and poly condensation.[7] ZnO is a II-VI compound semiconductor with wurtzite structure. Cerium oxide is an important metal oxide used for industrial products.
2. Experimental
- In this work mixed ethanol-water solvent (50:50) was used to dissolve 2 gm zinc nitrate, 2 gm nickel nitrate and 8 gm PVA, the mixture was heated to 80℃ to form a homogeneous sol solution. The obtained sol was slowly heated to evaporate the solvent and it form a hard homogeneous gel. The Pyrrolysis of the final gel was performed at a temperature of 600℃ for 4 hours and 8 hours. During the Pyrrolysis process the PVA polymeric network through the outer surface, zinc and cadmium nitrate salts simultaneously calcinated and converted into CeO-ZnO nano composite. The obtained samples were crushed to prepare a fine powder.
3. Results and Discussion
3.1. XRD
- The XRD pattern of CeO-ZnO nanocomposite which were calcinated at 600℃ for 4 hours and 8 hours are shown in fig 1 and fig 2. Both the calcinated samples are polycrystalline in nature. The particle size of as prepared samples was found using Scherrer formula
 Where d= average partice size, β is full width at half maxima, θ is the Bragg angle, λ is the wavelength in angstrom. We use the most intense peak to calculate average crystalline size. It can be seen that average size of CeO-ZnO nanocomposites heated for 4 hours comes out to be 5.4 nm and of sample heated for 8 hours comes out to be of 6.8 nm [8]. Thus it can be seen that the particle size increases with increase in time of calcinations.
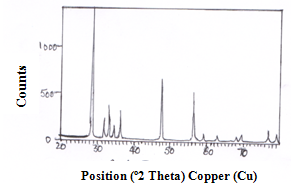 | Figure 1. XRD spectra of CeO—ZnO Nanocomposite Calcinated at 600℃ for 4h |
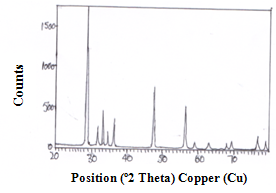 | Figure 2. XRD spectra of CeO—ZnO Nanocomposite Calcinated at 600℃ for 8h |
3.2. SEM
- SEM images demonstrate the morphology of nanoparticles which were synthesized through Sol-Gel method. The images indicate that the particles of the nanocomposite are uniform, regular, spherical sponge like in shape in both the samples annealed for 4h and 8 h. The images indicates nearly spherical structures. They reveal the formation of Nano crystalline materials and show the randomly oriented aggregates of and size ranges from 5.4nm to 6.8 nm. Particles sizes were calculated from SEM images by measuring the particle diameter manually.[9 ]The particle size increases when we increase the time of calcination from 4h to 8 h at 600℃ as shown in fig 3 and fig 4.
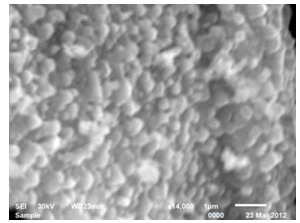 | Figure 3. SEM spectra of CeO-ZnO nanocomposites when annealed at 600℃ for 4h |
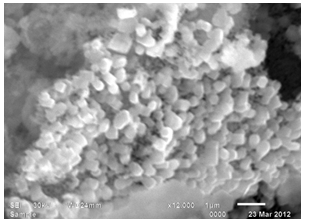 | Figure 4. SEM spectra of CeO-ZnO nanocomposites when annealed at 600℃ for 8h |
3.3. UV-VIS
- UV-VIS spectra of CeO-ZnO nanocomposites are shown in fig 5 and fig 6. Absorption in CeO-ZnO nanocomposites when heated at 600℃ for 4 h is more than when heated at 600℃ for 8 h. At 4 h spectra, absorption first decreases up o 240 nm in ultraviolet region then it increases to a small extent and remains constant in the visible region. In 8 h spectra there is a fast decrease in absorption up to 220 nm in ultraviolet region, then there in small increase in absorption. There is a small peak near 370 nm and absorption remain almost constant in visible region. [10-13] UV-VIS spectra show that the absorption edges of the binary oxides shift remarkably to the visible range relative to those of pure ZnO and CeO[ ]
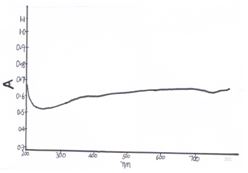 | Figure 5. UV-VIS spectra of CeO—ZnO Nanocomposite Calcinated at 600℃ for 4h |
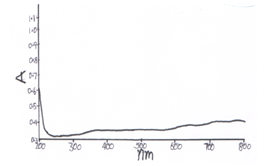 | Figure 6. UV-VIS spectra of CeO—ZnO Nanocomposite Calcinated at 600℃ for 8h |
3.4. FTIR
- FTIR spectra of CeO-ZnO nanocomposites are shown in fig 7 and Fig 8. Infrared spectroscopy is used to determine the presence of certain functional groups. FTIR Spectra when annealed at 600℃ for 8h shows three new peaks at 3747.47cm-1, 1624.03cm-1 and 1164.07 cm-1 than the spectra annealed at 600℃ for 4h. A broad band around 3400-3700 cm-1 corresponds to stretching mode of OH group which is contributed by water contents. The peak around 2900 cm-1 is due to C-H band Band around 1600 cm-1 may be due to deformation vibration of H2o molecule. Band around 1450 cm-1 corresponds due to asymmetric stretching C=O Bonds. Band around 1100 cm-1 may be due to C-O single bond stretching mode. Bands around 800 cm-1 may be due to Ce-O stretching vibration. Bands around 500 cm-1 may be due to Zn-O Viberational mode. [14-18]
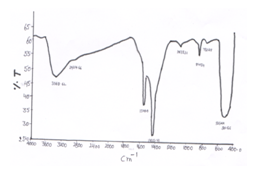 | Figure 7. FTIR spectra of CeO—ZnO Nanocomposite Calcinated at 600℃ for 4h |
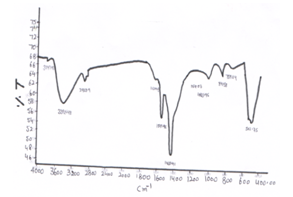 | Figure 8. FTIR spectra of CeO—ZnO Nanocomposite Calcinated at 600℃ for 8h |
4. Conclusions
- The CeO-ZnO nanocomposites material have been prepared successfully by sol-gel method. The size of the nanocomposite so formed using XRD Scherrer formulae comes out to be 5.4 nm and 6.8 nm. The UV-VIS shows a increasing absorption in the visible region. The nano composites results were determined with XRD, UV-VIS, FTIR which confirm the formation of CeO- ZnO nanocomposites. Optical properties changes with the change in particle size. These results are in concurrence with earlier reports depicting a size effect on the optical properties of nanostructures.
ACKNOWLEDGEMENTS
- Author is grateful to UGC for providing the financial support for carrying out research work. Author is grateful to SAIF P.U. Chandigarh for characterization like XRD, UV-VIS, FTIR of samples. The author is thankful to chemistry Dept, M.D.U. Rohtak for providing the facilities of SEM and PL. The author is thankful to Physics Dept, M.D. University, Rohtak for providing lab facilities.