-
Paper Information
- Next Paper
- Previous Paper
- Paper Submission
-
Journal Information
- About This Journal
- Editorial Board
- Current Issue
- Archive
- Author Guidelines
- Contact Us
Nanoscience and Nanotechnology
p-ISSN: 2163-257X e-ISSN: 2163-2588
2012; 2(3): 57-65
doi: 10.5923/j.nn.20120203.03
Sensitivity Analysis of Carbon Nanotube Characteristics on Dynamic Behavior of Tapping-Mode Atomic Force Microscopy
 Abstract
 Reference
 Full-Text PDF
 Full-Text HTML
M. H. Korayem, N. Ebrahimi, S. Moloodi
Robotic Research Laboratory, Center of Excellence in Experimental Solid Mechanics and Dynamics, School of Mechanical Engineering, Iran University of Science and Technology, Tehran, Iran
Correspondence to: M. H. Korayem, Robotic Research Laboratory, Center of Excellence in Experimental Solid Mechanics and Dynamics, School of Mechanical Engineering, Iran University of Science and Technology, Tehran, Iran.
| Email: |  |
Copyright © 2012 Scientific & Academic Publishing. All Rights Reserved.
Atomic force microscopy with attached carbon nanotube is an ideal tool in nano scale imaging, for its high precision caused by small tip diameter and high flexibility of carbon nanotube. In this paper sensitivity analysis of a tapping-mode atomic force microscopy (AFM) with large aspect ratio carbon nanotubes (CNT) probe tips is investigated. A finite-element method is used for vibration analysis of a continuous beam model of an AFM cantilever and vibration amplitude is extracted in different excitation frequencies and different tip separations from sample surface and the effect of nanotube characteristics such as its length, bending stiffness & tilt angle on dynamic behavior of AFM is examined. The results show that decreasing the CNT length or increasing the CNT bending stiffness or the number of CNT layouts, increases the resonance frequency, but its effect is small. The results also show that using stiffer nanotubes removes the possibility of buckling in the range of the frequencies close the natural frequency of the cantilever. This can cause more stability due to less buckling. Sensitivity analysis helps better choosing of the carbon nanotube characteristics.
Keywords: Carbon Nanotube, Tapping-mode Atomic Force Microscopy, Sensitivity Analysis
Article Outline
1. Introduction
- Tapping-mode atomic force microscopy is an advanced method for imaging in nano scale. Carbon nanotubes were used as probe tips first by Dai et al[1]. They are potentially ideal atomic force microscopy probes due to their well-defined geometry, robust mechanical properties, and in the case of single-walled nanotubes (SWNTs), diameters approaching the size of small organic molecules[2]. The idea of using carbon nanotubes as atomic force microscopy tips has been recently concerned by the scientists because of their well characteristics and the less damage they cause to the sample. Besides the benefits of using carbon nanotubes as AFM tips there are some difficulties too. One of them is the hardness of attaching a CNT on the tip of an AFM and the other major problem is the little information about the dynamic and static behavior of nanotubes and the effects they cause on the dynamics of AFMs. Some scientists, using simple models, have analysed the dynamic behavior caused by the CNTs, some have done experiments and some other have studied other problems concerning using the CNTs. For example Chen et al elucidated fundamental factors that determine AFM imaging resolution using experiments with SWNT probes and numerical simulations[2]. Raman et al investigated imaging artefacts caused by adherence of CNT to the wall of slopes of the sample surface and its effect on the resolution of the resultant images[3]. E. Lee offered a several degrees of freedom model for controlling of an AFM with parallel carbon nanotubes[4]. Lee et al offered a theoretical model using Euler-elastic beam theory for the CNT connected to the probe tip and investigated the theoretical and experimental results[5]. For studying the dynamic behavior of an AFM with an attached nanotube on the tip, S. I. Lee et al, investigated non-contact CNT tipped AFM by some experiments. In their experiments, the frequency response and the amplitude-separation data for a high aspect ratio multiwalled carbon nanotube (MWCNT) were extracted. Higher harmonics, corresponding to attractive and repulsive regimes, were measured versus frequency ranges when the CNT buckles dynamically. Surface imaging was done using MWCNT tip on SiO2 surface for validation of the imaging instabilities during the time the CNT was buckling[6]. Also S. I. Lee et al investigated nonlinear dynamics of an AFM with MWCNT tip experimentally and theoretically. They gave experimental nonlinear frequency response in tapping-mode[7]. C. V. Nguyen et al, presented some results about stability and lateral resolution of carbon nanotubes[8] and Snow et al, studied the factors which specify imaging stability with single-walled carbon nanotube (SWCNT) tipped AFMs. They used a numerical method for investigation of non-contact imaging and studied the effects of the vertical alignment of CNT with respect to the sample surface and also the CNT length on amplitude-separation diagram[9]. Some scientists have studied the friction of CNT on the surface for example, B. Bhushan et al carried out a comprehensive investigation of adhesion, friction and wear of a MWCNT tip, SWCNT tip and MWCNT arrays[10] while H. Lua et al quantitatively investigated sliding friction and adhesion properties of vertically aligned multi-walled carbon nanotube arrays and fluoro-nanodiamond films on glass substrate using AFM[11]. One major factor which affects the dynamics of nanotubes, is their bending and buckling behavior. H. W. Yap et al prepared some experiments with individual multiwall carbon nanotubes with different ranges of aspect ratios. The nanotubes were subjected to cyclic axial compression in large strains using atomic force microscopy. Distinct elastic buckling and post buckling phenomena were observed reproducibly and were ascribed to Euler, asymmetric shell buckling (i.e., kinking), and symmetric shell buckling[12].For all advantages of carbon nanotubes, an investigation of CNT tipped AFM dynamics is considerable. As pointed researchers investigated CNT tipped AFM theoretically or experimentally for their stability, lateral resolution, imaging artefacts, buckling behavior and bifurcation or tried to offer an appropriate model for dynamic simulation and contact force between CNT & sample surface, but obviously further investigation is still needed for clarifying CNT effect on dynamic behaviour of AFMs. Researchers have done experiments each with a special kind of carbon nanotube which helps investigation of CNT effect on AFM, but an appropriate sensitivity analysis of the effects of carbon nanotube on tapping-mode AFM has not been done. In this paper sensitivity analysis of nanotube characteristics on tipping-mode AFM dynamics is noticed which was not done in the previous researches. It has been done theoretically and regarding to researchers’ experimental analyses. Changing nanotube characteristics affect buckling behavior or critical buckling force, these factors besides AFM characteristics like its stiffness, excitation amplitude and frequency can change the behavior of Dynamic mode AFM. Dynamic mode AFM should be excited in its resonance frequency and attaching a nanotube on the tip of AFM changes the resonance frequency. Buckling resistance of the nanotube can make different changes on the resonance frequency or amplitude. Also the geometry of the CNT affects the imaging resolution, stability, the force transferred to the sample and in the result the damage which is caused on the sample. In this paper studying of these effects is attended. This knowledge will help an appropriate choice for the geometry and characteristics of nanotube.
2. Theoretical Analysis
- An experiment was done for tip deflection versus tip-sample separation by[7] for an AFM with MWCNT tip. Their results showed that the complex nature of the tip–sample interaction at various separations can cause the MWCNT to buckle as well as slip, slide, and adhere to the surface of the sample depending on the tip–sample separation. These effects were demonstrated by measuring the static force–distance curve which records the force on the MWCNT tip as a function of the z travel (vertical) distance. As the tip approaches the surface, the cantilever first snaps into contact with the sample and then deflects linearly as the CNT tip pushes against the surface. After that the cantilever exhibits a nonlinear deflection by increasing Z, indicating a buckling of the MWCNT tip and then near constant cantilever deflection indicates that the deformation is directed into MWCNT buckling rather than producing additional cantilever deflection. After ∼800 nm of indentation, there is a sudden decrease in cantilever deflection, suggesting that the MWCNT has slipped on the Highly Oriented Pyrolytic Graphite (HOPG) surface.For analysing this system, first it is necessary to define the contact force applied on the cantilever. For simplification it is possible to assume that: 1- The CNT mass is infinitesimal compared to that of the probe, so the lateral inertia of the CNT is neglected. 2- The CNT deforms quasi-statically during tip-sample impact. 3- The effect of nanotube vibration is neglected, so it is assumed that in the same excitation frequency and tip separation, the CNT tip impacts the same point in each cycle.
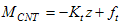
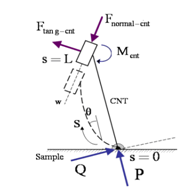
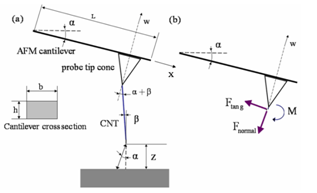 | Figure 1. (a) Schematic diagram of AFM cantilever with CNT tip. The angle between probe and horizontal axis is α and the angle between CNT & normal axis is β. Separation of CNT tip from sample is z. Lateral deflection of the probe is parallel to axis of w. (b) Diagram of the forces normal to the cantilever (Fnormal), tangent to the cantilever (Ftang) and the moment (M). |
 | (1) |
 ). For calculating this buckle force, it is possible to use euler-elastica force equation which expresses the force as a function of deflection. In this paper, buckling force function is determined by working-model software, which gives normal and tangent forces and the moment. Figure 2 shows the schematic model made in working model for calculating forces and moment. If the CNT doesn’t slide on the sample surface, it is possible to assume that the CNT tip is jointed on the sample surface and, in its other side, due to the vibration of the cantilever, it is sliding in a direction parallel to w axis, normal to the AFM cantilever (Fig. 1). We cause the CNT to buckle a little in different values and then save the values of the reaction forces and moment applied on the cantilever by the CNT, calculated by the software. These reaction forces are normal force (
 ), tangential force (
 ) and moment (
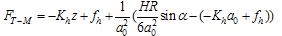
 ). Finally diagram of the forces and moment versus buckling amount is obtained. These diagrams are approximately linear. Equations (2), (3), and (4) are linear approximations of the CNT force & moment versus deflection curves. Figure 3 shows the linear approximated equations for these forces and the moment. It is important to mention that we let the nanotube to buckle just a little, because more buckling causes instability.
  | (2) |
 | (3) |
 | (4) |
 and
and  are the coefficients of the approximated linear equations for
  and
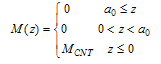
and  3- In the range
 , the interaction normal force (
 ) and tangential force (
 ) are approximated as a quadratic polynomial which interpolates between force functions discussed above[7]. In this range moment is zero.
 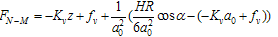 | (5) |
 | (6) |
 ) is
) is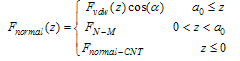 | (7) |
 ) is
) is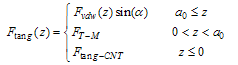 | (8) |
 | (9) |
 | Figure 2. Schematic model made in working model for calculating forces and moment. P & Q are normal and tangential forces applied on CNT tip from sample. 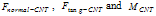 are normal and tangential reaction forces & moment caused by CNT applied on the cantilever. are normal and tangential reaction forces & moment caused by CNT applied on the cantilever. |
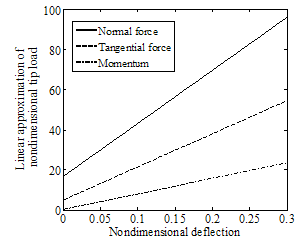 | Figure 3. Approximated linear functions for normal force ( ), tangential force ( ), tangential force ( ) and moment ( ) and moment ( ). ). |
 | (10) |


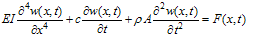
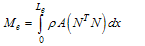
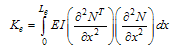
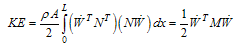
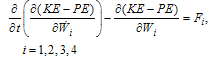
 is the interaction force between the sample and cantilever which was discussed in equations (7), (8) & (9).For solving the governing equation with finite-element method the cantilever is divided by beam elements and the tip is modelled as a rigid cone. At each node of the beam element, there are two degrees of freedom, one is the translation displacement and the other is the rotation angle, and so the element nodal displacement vector is[13-14]
 | (11) |
 | (12) |
 | (13) |
 | (14) |
 are
are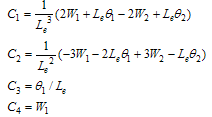 | (15) |
 | (16) |
 | (17) |
 | (18) |
 | (19) |
 | (20) |
 | (21) |
 | (22) |
 | (23) |
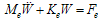
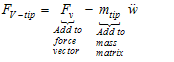
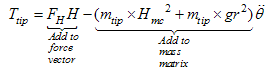
 is transferred to the right side of the equation and is added to the force vector. The same action is done for mass matrix too. So we have a 2n*2n matrix equation as:
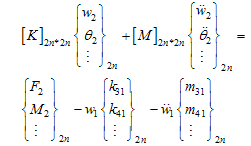 | (24) |
 | (25) |
 | (26) |
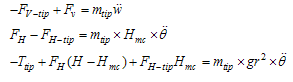
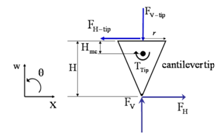 | Figure 4. Free body diagram of the forces interacted on tip probe cone |
 | (27) |
 | (28) |
 is the i'th shape mode vector and
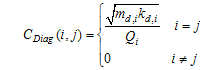
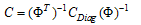
  is the shape mode matrix. For accounting the effect of damping matrix, we have
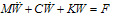 | (29) |
 | (30) |
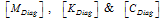 are diagonal mass, stiffness and damping matrixes. Each decoupled equation, is the equation of oscillation of an independent vibrator with natural frequency of ωn,i and damping ratio of ζi which has the relation ζ=1/2Q with quality factor Q.
 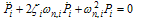 | (31) |
 | (32) |
 | (33) |
3. Simulation and Results
3.1. Simulation
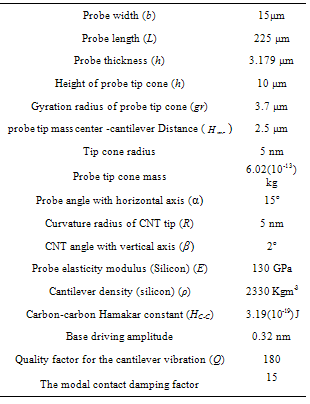
- For simulation and dynamic analysis, the values of the properties listed in table (1) are used[7, 16 & 17]. Figure 6 shows the frequency response of the simulation, which is validated with the results of experiments done in[7] (Fig. 5).
|
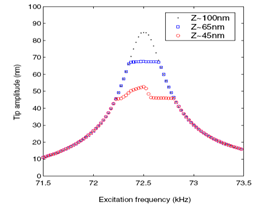 | Figure 5. Experimental results of amplitude-frequency CNT tipped AFM on HOPG surface in different separations[7] |
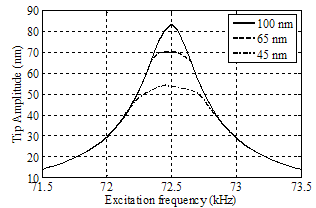 | Figure 6. Simulated of amplitude-frequency in different separations by MATLAB |
3.2. Sensitivity Analysis
- Some Figures are extracted based on Euler-Elastica buckling force prediction by changing the CNT length, diameter or tilt angle or separation from surface. For this the buckle force introduced before (
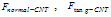 &
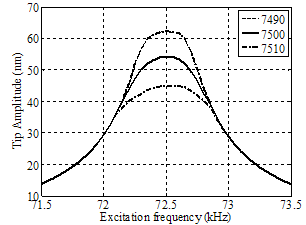
& ) is made with the new parameters of CNT length, diameter or tilt angle and then this force is used for extracting the specified Figures. As theory of Euler-Elastica is proper for large aspect-ratio beams, we have used parameters in a range which have large aspect-ratio carbon nanotubes. Figure 7 shows the amplitude-frequency diagram in constant separation of 45 nm with three different nanotube lengths. As what is shown in Figure 7, decreasing the CNT length causes increasing of resonance frequency just a little. The resonance frequency is 72.5 kHz. For the nanotube with 7500 nm length, the resonance is equal to 72.5 kHz too. This means that the buckling resistance is very little. For shorter nanotubes the buckling resistance is increased and the resonance is increased a little. The nanotube can imagined as a spring which its stiffness enlarges the total stiffness of the AFM.
 | Figure 7. Simulation for amplitude-frequency diagram in constant separation of 45 nm with different nanotube lengths |
 | Figure 8. Simulation for amplitude-frequency diagram in the constant separation of cantilever from the sample (7545 nm) with different nanotube lengths |
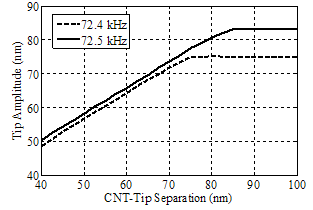 | Figure 9. Simulation for vibration amplitude versus separation from sample, with CNT length of 7500 nm and different excitation frequencies |
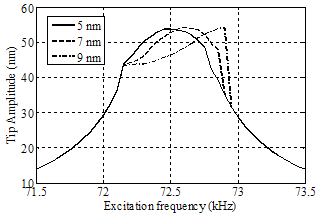 | Figure 10. Simulation for amplitude versus excitation frequency with different nanotube diameters and 7500 nm length |
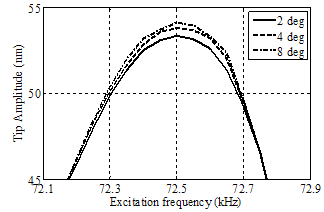 | Figure 11. Simulation for frequency response for different angle between nanotube and vertical axis in separation of 45 nm |
4. Conclusions
- Tapping-mode atomic force microscopy is an advanced method for imaging in nano scale. Carbon nanotubes cause increasing imaging resolution because of their high aspect ratio. For gaining a high resolution, AFM dynamics should be studied precisely and in this paper we tried to study the effects of attaching a CNT on the tip of an AFM. The results show that CNT tip separation from sample has the most effect on vibration behavior of AFM cantilever and the separation of probe has less effect. This is natural because of the range of the effects of intermolecular forces. Intermolecular forces show their effect in low distances, so van der Waals force is modelled by a sphere with diameter equal to the diameter of nanotube.Decreasing the CNT length causes increasing of the buckling critical force and increasing of resonance frequency. Increase of the CNT diameter, causes increase of the resonance frequency. The CNT angle is not so effective in small ranges, but greater tilt angles cause easier buckling and bending and so having greater vibration amplitude. Increasing buckling critical force causes increasing the resonance frequency. In stiffer nanotubes which have larger critical buckling force, tapping is possible with just a little amount of buckle in the nanotube. This interesting characteristic, besides keeping touch between the nanotube and the sample, which is a base specification in tapping-mode AFM gives the amplitude equal to the separation and so causes gaining more stability. Using stiffer nanotubes removes the possibility of buckling in the range of the frequencies around natural frequency of the cantilever. Although greater force is transferred to the sample in comparison to nanotubes with less critical buckling force, but instability due to nanotube buckling is reduced too. Totally in larger set-points and in stiffer nanotubes the amount of buckling is reduced and this can reduce the instabilities due to nanotube buckling.
Appendix
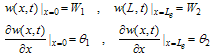
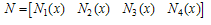
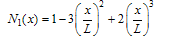
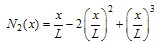
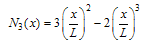
- The shape functions of the beam elements are:
 | (A.1) |
 | (A.2) |
 | (A.3) |
 | (A.4) |
 | (A.5) |
 | (A.6) |
 | (A.7) |
 | (A.8) |
 | (A.9) |
 | (A.10) |
 | (A.11) |
 | (A.12) |
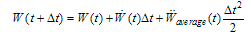
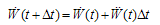
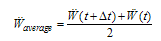
 ) and in each step, it is assumed that the acceleration of each node is constant.
 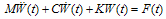 | (A.13) |

 | (A.14) |
 | (A.15) |
 | (A.16) |
 | (A.17) |