-
Paper Information
- Previous Paper
- Paper Submission
-
Journal Information
- About This Journal
- Editorial Board
- Current Issue
- Archive
- Author Guidelines
- Contact Us
Nanoscience and Nanotechnology
p-ISSN: 2163-257X e-ISSN: 2163-2588
2012; 2(1): 22-25
doi: 10.5923/j.nn.20120201.05
Effect of Solvent Content on the Properties of Nanostructure Silica Thin Film by Sol-Gel
 Abstract
 Reference
 Full-Text PDF
 Full-Text HTML
A. Shokuhfar , E. Eghdam , M. Alzamani
Mechanical Department (Advanced Materials and Nanotechnology Research Lab), K.N. Toosi University of Technology, Tehran, 19697 64499, Iran
Correspondence to: E. Eghdam , Mechanical Department (Advanced Materials and Nanotechnology Research Lab), K.N. Toosi University of Technology, Tehran, 19697 64499, Iran.
| Email: |  |
Copyright © 2012 Scientific & Academic Publishing. All Rights Reserved.
It is known that silica sol-gel coatings microstructure depend on the components of the sol. In order to develop different microstructures of the silica coatings and comparing their optical properties, a variety of silica sols were prepared which were consist of TEOS, water, catalyst and changing the solvent content, at room temperature. Prepared glass surfaces were coated with silica sol using a dipping technique, with constant withdrawing rate. Prepared coatings were investigated by field-emission scanning electron microscopy (FE-SEM) and UV–Vis. spectroscopy. Transmittance spectra showed that silica coatings featured a distinct increase of substrate transmittance at all wavelengths (400-1100 nm). The result indicated that by increasing the solvent content, the porosity of coating increased and the coating was more densified therefore the silica coating transmittance increased by 3-4% points. FE-SEM showed that the nanostructure silica coating grain size were estimated ~20-40 nm.
Keywords: Solvent content, Silica, Transmittance, Sol-gel, Dip-coating
Cite this paper: A. Shokuhfar , E. Eghdam , M. Alzamani , "Effect of Solvent Content on the Properties of Nanostructure Silica Thin Film by Sol-Gel", Nanoscience and Nanotechnology, Vol. 2 No. 1, 2012, pp. 22-25. doi: 10.5923/j.nn.20120201.05.
Article Outline
1. Introduction
- SiO2 thin films have been widely used for optical coatings as anti-reflective and protective layers[1-3] and also for different microelectronic structures, as diffusion barriers and/or insulating layers with additional planarization ability[4-7]. Recently, the physico-chemical properties of SiO2 thin films have being applied in various methods to improve photovoltaic devices, as encapsulant coatings and/or to isolate electrical contacts in the cell[8-10].To prevent disturbances of external light and increase the transmittance of incident light, antireflective technologies are widely applied in optical components, solar cells, displays, automotive glass, thermochromic windows, etc[11].The sol-gel process is one of the most important techniques to coat glasses, ceramics and metals with amorphous thin films. There is great technological interest in the preparation of colored and multilayered dielectric films by sol-gel [12]. Researches and applications for the coating from sol have recently been reviewed by Schroeder[13], Dislich and Hussman[14], Dislich[15], Sakka[16] and Orgaz et al.[17].Sol-gel technology can produce vitreous and ceramic coatings with various compositions over different substrates with low cost. Sol-gel SiO2 coatings are obtained by spining,dipping or spraying a solution prepared by dissolving aprecursor alkoxide in alcohol, catalyzed in an acid and hydrolyzed with water. After the deposition process, densification of the layers is obtained by heating at moderate temperatures (300-500
 ) in furnace or inert atmosphere. The resulting sol-gel SiO2 coatings have shown excellent mechanical and chemical stability, with optical and electrical properties that can be controlled by the sol preparation parameters[2,4,6].In order to shift the reflectance value to minimum, a fine control of the coating thickness and refractive index is required[18,19]. Nearly zero-reflectance can be reached if “Eq.(1)” was established
 | (1) |
 | (2) |
2. Experimental
2.1. Sample preparation
- All chemicals were used as received without further purification. The anti-reflective films were deposited on 2 mm thick automotive glass slides (100 × 40 mm2) by dip-coating method. Withdrawal rate was adjusted to 1 cm/min. Anti-reflective sols were prepared by mixing absolute ethanol (EtOH, Merck, min 96 vol. %), distilled water and tetraethyl orthosilicate (TEOS, Acros Organics, 98%) according to the flow chart presented in Figure 1. The ethanol/TEOS molar ratios were 10, 15, 20 and 25 and the water/TEOS molar ratio was 2 in order to fit the thickness of the coatings to the maximum transmittance.To prepare the suspensions, TEOS was mixed with one-half of ethanol using a magnetic stirrer for 15 min. In a separate vessel, the remained ethanol was dissolved into distilled water and then the distilled water-ethanol mixture was added to TEOS-ethanol suspension drop by drop. When the mixture was homogeneous, HCl (Scharlau, 37%) was added drop by drop until the pH of the solution decrease to the value of 2. The anti-reflective sols were aged for 24 h before proceeding to coat. All the coatings were dried in air at room temperature for 24 h and subsequently were heated up to 500
 with the rate of 10
 for 30 min.
2.2. Sample characterization
- UV–Vis transmittance measurements on coating were performed using a Perkin Elmer UV/Vis Spectrophotometer, Lambda 25 tescan model vega-Ii. The size of SiO2 particles in coatings and surface morphology were investigated using a S-4160 Field Emission Scanning Electron Microscopy (FE-SEM) operating at 15 kV.
3. Results and Discussion
- In general, many interdependent factors can play a prominent role in the final physical properties of sol-gel coatings: (i) sol-gel solution (ingredients, sequence of mixing, concentration and ratio of components, temperature, pH); (ii) applying technique (dip, spin, spray, laminar flow); (iii) substrate (glasses, plastics, metals, ceramics) and its surface preparation; (iv) coating (porosity, residual OH, structure, roughness, thickness). Dip-coating is the most popular method in which the colloids are evaporation induced and self-assembled on the substrate as it slowly withdrawn from the colloidal suspension. In this study several different silica sols were prepared to find the optimal deposition conditions on the microscope glass substrates for anti-reflective behavior.The thickness of the porous SiO2 and therefore, the wavelength of the maximum transmittance, were finely tuned by controlling solvent ratio in the sol preparation stage .In Figure 2, substrate transmittance spectra (bare sample) and coated samples with nanostructure SiO2 (as-received) with different ratio of precursor dilution factor (D = [EtOH]/[TEOS]) is illustrated, which all were coated at the rate of 1cm/min. As one can deduce, SiO2 nanostructure coating on the glass substrate, increase the transmittance percentage in the UV-Vis test. Considering figure 2, transmittance spectra at wavelength of 550 nm is maximum and around 2.3 % of increment in the transmittance relative to the bare sample achieves when using D=10 (AR-10 sample) in the solution. By increasing the D ratio from 10 to 15, the maximum value and its transmittance percentage shift to the wavelength of 500 nm and 92.9 % respectively (AR-15 sample). In this case, before and after the maximum point in the specified wavelength, transmittance spectra increase and decreased, respectively.By increasing the D ratio from 15 to 20 (AR-15 to AR-20) the maximum transmittance didn’t amplitude the amount of spectra, whereas the maximum transmittance is preserve approximately at the 500 nm. According to Figure 2, increasing the D ratio more than 20 reduced the maximum value, obviously.Of course, one can observe that the sample which was coated in the sol with D=25 shown lower transmittance compared to the sample which was coated in the sol with lower D ratio.
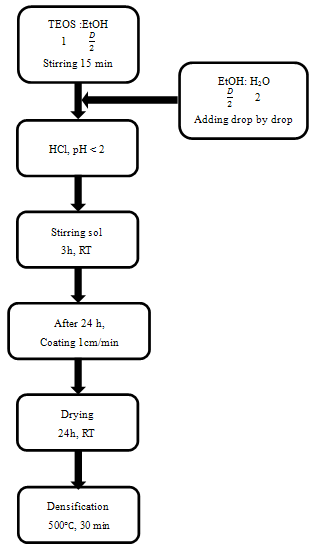 | Figure 1. Flow chart of sol-gel processing for SiO2 films (The D factor indicate EtOH ratio molar) |
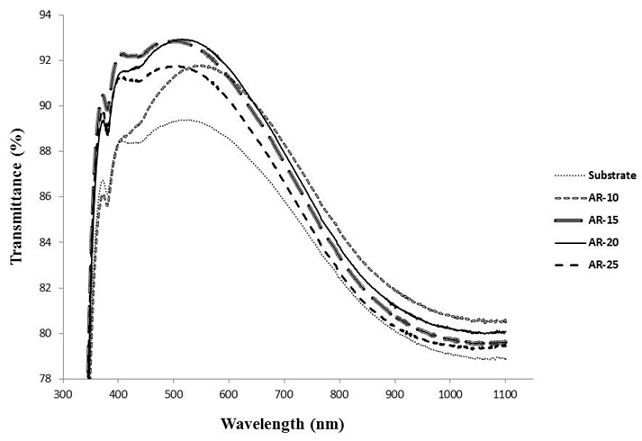 | Figure 2. Optical transmittance spectra of coatings with different D factor |
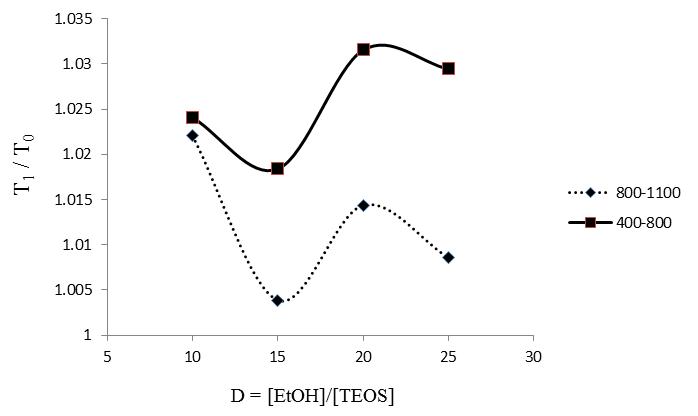 | Figure 3. Transmittance ratio (verage of T1/T0) of the SiO2-coated samples, T1, vs. the glass substrate, T0 , as a function of the precursor dilution, D |
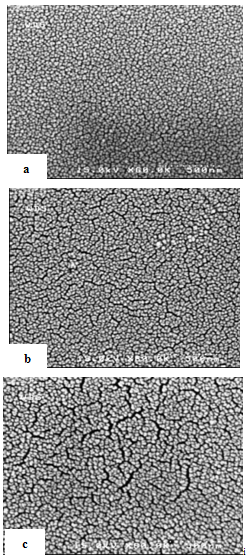 | Figure 4. FE-SEM micrograph of surface SiO2 films, (a) D=10, (b) D=15, (c) D=20 |
4. Conclusions
- Uniform nanostructure SiO2 film was applied on glass substrate in this study with the least defects. The optical effects of microstructure of SiO2 sol-gel coatings on the glass substrate were investigated. This research proved that with increasing D, the porosity and light transmittance increased. With increasing amount of D, the optimum thickness decreases therefore the reflective index decreases and light transmittance increases. The best anti-reflective behavior showed the coatings obtained from D=20 and the highest absolute transmittance (92.94%) was achieved at approximately 500 nm wavelength therefore sol-gel SiO2 coatings on glass substrate can provide about 4 and 1.2% optical transmittance enhancement in the visible infrared range respectively.
ACKNOWLEDGEMENTS
- This work was partially financially supported by supplying automotive parts company (SAPCO).