E. C. Merem 1, Y. A. Twumasi 2, S. Fageir 3, D. Olagbegi 1, J. Wesley 1, R. Coney 1, Y. Babalola 1, T. Thomas 1, A. Hines 4, G. Hirse 4, G. S. Ochai 5, E. Nwagboso 6, M. Crisler 1, S. Leggett 7, J. Offiah 1, S. Emeakpor 8
1Department of Urban and Regional Planning, Jackson State University, 101 Capitol Center, Jackson, MS, USA
2Department of Urban Forestry and Natural Resources, Southern University, Baton Rouge, LA, USA
3Department of Social Sciences, Alcorn State University, 1000 ASU Drive, Lorman, MS, USA
4Department of Public Policy and Administration, Jackson State University, 101 Capitol Center, Jackson, MS, USA
5African Development Bank, AfDB, 101 BP 1387 Avenue Joseph Anoma, Abidjan, AB 1, Ivory Coast
6Department of Political Science, Jackson State University, 1400 John R. Lynch Street, Jackson, MS, USA
7Department of Behavioral and Environmental Health, Jackson State University, 350 Woodrow Wilson, Jackson, MS, USA
8Department of Environmental Science, Jackson State University, 1400 John R. Lynch Street, Jackson, MS, USA
Correspondence to: E. C. Merem , Department of Urban and Regional Planning, Jackson State University, 101 Capitol Center, Jackson, MS, USA.
| Email: |  |
Copyright © 2024 The Author(s). Published by Scientific & Academic Publishing.
This work is licensed under the Creative Commons Attribution International License (CC BY).
http://creativecommons.org/licenses/by/4.0/

Abstract
One major narrative over the last several years, consistent with the US Northeast region in policy discourse rests on its perception as a hub with high concentration of city bright lights and skyscrapers but short on water usage. In the process, no one thinks about how the rising demands from urban residential areas to hydroelectricity and climate change stressors impact the hydrology. Yet, what is forgotten is that the economic engine driving the region comes from the interactions in a complex hydrological network anchored in water distribution dependency. At the same time, a closer look at various states indicates that the “big apple” area along with its neighbors most notably Maryland, New jersey, and Pennsylvania all share a heavy penchant in the use of water resources. With people obsessed with bright lights of the “big apple” and activities rooted in the growing use of water amidst disparate distribution. The use levels in the zone rely on surface and subterranean ground water types. Aside from the dependence on surface water, there exists sectoral imbalances in water distribution, the threats of pollution, and droughts precipitated by climate change parameters. Given hydroelectricity’s ranking as the largest water user in such a heavily urbanized setting, the consumption levels affirm the primacy of New York ahead of the others. While the rising incidence of water mining together with the risks and impacts remain highly evident, it does not occur in a vacuum due to socio-economic and ecological factors located within the regional hydrology. Still, water resources issues therein seemed overlooked in previous studies. This research will bridge that void using a mix-scale approach involving the fusion of GIS and descriptive statistics in the Northeast US. With emphasis on the issues, trends, environmental analysis, impacts, factors, and institutional efforts in place. The results point to rising use of water, impacts, changes in allocation, the dispersion of water use indicators across space and sectorial disparity amidst a host of elements. In all these, the paper proffered remedies ranging from public enlightenment, monitoring, the design of regional water management information systems, conservation plans and the enactment of effective policies.
Keywords:
US Northeast Region, Water Resources, Policy, Issues, Impacts, Factors and Climate Change
Cite this paper: E. C. Merem , Y. A. Twumasi , S. Fageir , D. Olagbegi , J. Wesley , R. Coney , Y. Babalola , T. Thomas , A. Hines , G. Hirse , G. S. Ochai , E. Nwagboso , M. Crisler , S. Leggett , J. Offiah , S. Emeakpor , Analyzing Water Resource Challenges in the US Eastern Zone, Marine Science, Vol. 11 No. 1, 2024, pp. 1-25. doi: 10.5923/j.ms.20241101.01.
1. Introduction
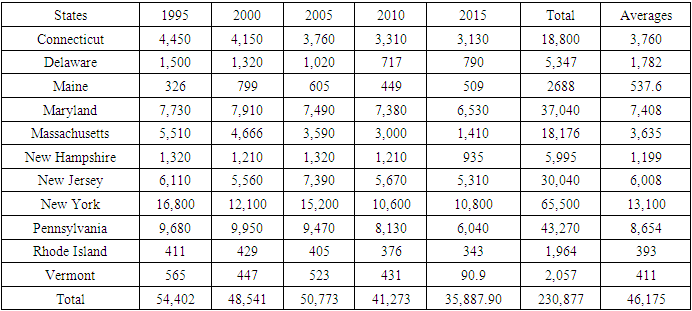
In the US Northeast region [1], there is a shared fable of flashy bright lights in a zone known for water assets based on the rich marine ecosystem, wetlands, and fresh H2O reservoirs [2-3], In the process, one major narrative over the last several years, consistent with major cities in the US Northeast region in policy and scholarly discourse rests on its perception as hub with high concentration of city bright lights and skyscrapers. Accordingly, the zone boasts of vast volumes of natural assets in the form of surface and ground H2O treasures [4-5]. In a nation where water still stands out as a vital asset essential to economic viability and the carrying capacity of the ecology. In the process, no one thinks about how the rising demands from urban residential areas, other sectors of the economy from industry, agriculture to hydroelectricity, are impacting the hydrology daily [6]. Yet, what is forgotten in all this is that the economic engine driving the region comes from water distribution. At the same time, a closer look at the various states in the zone indicates that the big apple area along with its neighbors most notably Maryland, New jersey, and Pennsylvania all share a heavy penchant in the use of water resources as indicated in the distribution forms across the plethora of sectors active therein [7].Additionally, as most people are obsessed with the bright lights of the big apple, its environs face the burdens of erratic precipitations [8], activities rooted in the growing use of water, the disparate distribution patterns of the resource, the acute nature and the associated liabilities and externalities of water management peculiar to a vastly moist ecozone. From what is at stake in the context of the hydro politics of the US Northeast [9-12], this new reality is now beginning to sink into the minds of people therein based on the unfolding matters and accumulated risks encountered. In the process, the supply and use levels in the zone rely heavily on water sources made up of surface and ground water types [13]. Aside from the area’s heavy dependence on surface water, there exists sectoral imbalances in water distribution as well as the threats of pollution, and occasional droughts precipitated by climate change parameters. In some cases, while there have been fatalities and destruction of properties from the landing of deadly hurricane storms which coincides with extreme precipitations across the Northeast region, the intensity of droughts has in some places threatened water access with implications on water usage. Given hydroelectricity’s ranking as the largest water user, the consumption levels amongst the states, the flow in that sub sector and the diversions over time, affirms the primacy of New York. For that, out of the joint totals of 54,402 mlgd in ground and surface water of the study area during the fiscal year 1995. Four states made up of New York, Pennsylvania, Maryland, and New Jersey with total values 16,800-9,680 mlgd to 7,730- 6110 mlgd surpassed the others. On the percentage of both water types as the share in the total based on the data, the region appears heavily reliant on surface sources. From the set of users in 1995, New York led the rest of the states as the major user of water. This comes from the mining of water intended for various sectors involving publics and domestic, irrigation, mining to thermoelectric. The same patterns occurred in 2015; out of the total of 35,887.9, mlgd in extracted water, both ground water and surface water for the region were estimated at 3,294.6 mlgd to 32,584.2 mlgd. Amongst the states, New York’s total volume (10,800 mlgd) being the highest in 5 successive periods covers both ground and surface water estimates of 890 mlgd-9,910 mlgd [14-16]. With water mining on the rise in the region and the attendant risks and impacts, it is evident that it really does not occur in a vacuum, it is really attributed to a host of socio-economic and ecological factors located within the larger hydrology. Virtually all critical aspects of daily activities in society rely heavily on steady water supply to function [3]. Because none of the key sectors of the economy from farms, electric power, and industries in the Northeast cannot thrive without water [17,18,19]. The Northeast’s latest find of 15,000 m2 of water: a colossal aquifer of freshwater on the ocean floor, the largest globally, is a game changer. Stretching offshore from Massachusetts to New Jersey, makes the zone a new frontier of US hydro-politics [4]. This could spark further growth in a highly urbanized region responsible for 23% of U.S GDP and access to H2O for hydropower in a hub with more nuclear reactors in the US for power output. Although acute H2O water issues in the west and Southeast have long gained much more attention than the Northeast corridor [20]. For that, the Northeast region is now a subplot in that narrative with New York a major player. Despite the charm, the recurrent water issues besieging other places in the US, are also familiar features in the Northeast. In the process, drops in supply is a concern in the region amidst sectoral imbalance, climate change impacts of sea level rise, changing demographics, pollution, depletion, and degradation triggered by many factors [17-21]. In context of degradation, look no further than the case of Baltimore, Maryland on September 6, 2022, following the outbreak of E-Coli in which citizens in the city were advised to heat tap water following the discovery in many West Baltimore localities, impacting over 1,500 people. Because of the outbreak, families in West Baltimore queued up to collect containers of bottled water. This happened after unsafe levels of E-Coli bacteria were spotted in the drinking water [22]. While the health department went about undertaking discovery and leak assessments in the hub, locals continued to cart water bottles and containers to their residence, without any ideas of the duration of the water emergency. This begs the question, why would one of the most affluent regions in the world, symbol of American greatness and heart of liberalism and new England work ethics, be making such a negative headline for the wrong reasons [l]. Since a healthy stream is the public’s initial safety barricade in guaranteeing water security and continual access. The ageing of water Infrastructure is taking a toll nationwide and regionally as it has been suggested that the government ought to spend about $3.6 trillion in the infrastructure solely in 2020 [22-28]. Through such a level of upgrade, the US water system can be brought in line to required guidelines as stipulated in the policy requirements with relevance to the North. Accordingly, the surge in water transactions appears highly attributed to a host of socio-economic and ecological factors located within the larger regional hydrology [29-31]. Additionally, very little has been done in the literature to capture the growing issues of water resources usage in the region. Accordingly, this research will bridge that void by assessing the concerns through a mix scale approach [32-36] involving the fusion of Geographic Information Systems (GIS) and descriptive statistics along 11 states in the Northeast Zone of the US [37-41]. With the emphasis on the issues, trends, environmental analysis, impacts, factors, and institutional efforts in place. From the enquiry’s four objectives, the first aim is to analyze the current issues in water resources management while the second assesses the risks of water depletion to the Northeast. The third objective evaluates water use and effects and the fourth objective identify the associated factors and remedies. The fifth objective is to develop a decision support device for managers. Against that background, the study covers 5 sections consisting of introduction, methods, results, discussions, and conclusion.
2. Methods and Materials
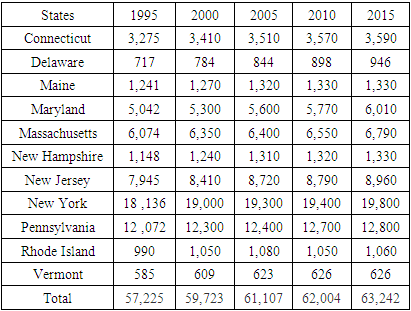
The study area Northeast consist of 11 states made up of Pennsylvania, New Jersey, Delaware, Rhode Island, Massachusetts, Connecticut, New York, Maine, Maryland, Rhode Island, and New Hampshire mostly in the core financial hub of the United State (Fig. 1). With a population of 64 million people concentrated therein (Table 1), the region occupies a land area of 469,630 km2 in the US Northeast [42]. As a unique region stretching over many states on the vast Atlantic seaboard, the enormity of the region runs through Northern Pennsylvania onto New Jersey through Western New York and the others. The high-density metropolitan coastal line corridor from the adjoining suburbs of Washington, D.C., and north to the Boston area ranks high among the best-known urbanized settings in the globe. Aside from holding very substantial, complex, and established network of standing infrastructure. The zone serves not only as seat of one of the globe’s primary monetary centres, and the country’s capital, but it has many unique artistic and historic markers coupled with an essential central rural part as well [43-45].Table 1. The Population of the Study Area 1995-2015
 |
| |
|
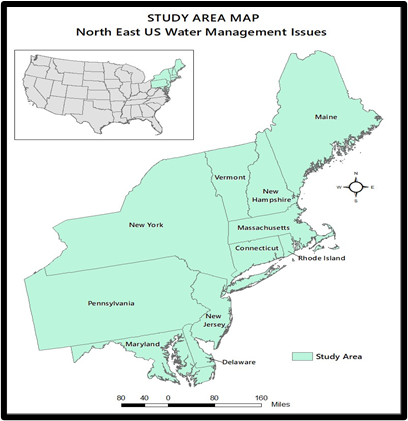 | Figure 1. Study Area US Northeast Region |
Furthermore, the Northeast encompasses sizable spans of lightly settled but ecologically and agriculturally essential land base. As such, much of the Northeast landscape is covered by forest, however the zone also contains grasslands, coastal zones, beach fronts and dunes, and marshlands, and it is famous for its vibrant marine and freshwater fisheries. These natural sanctuaries play indispensable roles in boosting the eco-tourism sectors and provide life support for different life forms, employment opportunities through the trade in timber, maple syrup, and marine food. They also offer important ecosystem services to larger populations beginning with purifying water flow, safeguarding coastline, and sequestering carbon in the grounds and plants [1]. In that way, most of the eleven Northeastern states have over 180,000 farms, worth $17 billion in yearly transactions [2-3]. The region’s ecosystems and agricultural systems are tightly interwoven, and both are vulnerable to a changing climate. Further along these lines, the Northeast ecozone exhibits the attributes of diverse climatic conditions. Added to that in the Northeast, are average temperatures which commonly drops further to the north, and within the vicinity of the coastline, and at upper altitudes. In as much as the mean yearly, rainfall level fluctuates by around 20 inches right through the Northeast with the peak levels evident in shoreline and in quite a few hilly regions. Throughout the winter, recurrent hurricanes trigger vicious cold and freezing rain, specifically to the northmost part, while in the summer periods usually much hotter and wet front, notably further on the south part sets in [2-3]. In all these, being a hub rich in biodiversity where many rely on surface water sources like rivers to meet portable water needs. Let it be known that contrary to popular perception given the regions ecosystem, water access in the area is not really filled with a bird of roses. Like in other places, the zone continues to face water stress, the accompanying environmental degradation, and risks amidst changing climate manifested by heavy flooding and the threats of contamination [43-45]. At the same time, the Northeast is regularly impacted by inclement climate incidents like chilly storms, floods, droughts, heat waves, hurricanes, and heavy storms on the Atlantic Ocean side along the northeast coast, known as “nor’easters”. Conversely, climate anomaly seems huge across space and time [46-51]. A case in point, stems from when portions of lower New England that encountered sizable snow fall during the winter period of 2010-2011 ended up with lesser volume of snow in the cold period of 2011-2012. Surely, whenever a season comes with soft tallies than the previous, it is still capable of precipitating extensive extreme conditions that can be punishing. Remember when a snowfall initially descended on the zone in the 2011, and later upgraded to pre-Halloween storm that struck much of the Northeast. The event left in its wake falling trees which knocked down electricity power facilities and supplies during a week and 3-day span which ended up inconveniencing thousands of households. In terms of pollution, and water scarcity and emergencies in the realm of regional management, the US Northeast ecozone has always had its full share of the discomfort over the years, that it now merits further evaluation under a mix-scale setting using temporal-spatial tools of descriptive statistics connected to Geographic Information system (GIS) in the analysis [52-54].
2.1. Methods Used
The paper uses a mix scale approach involving descriptive statistics and secondary data connected to GIS to analyze the growing incidence of water resources problems, the accessibility and hydrological security components of usage. The focus is on some selected states of the US Northeastern region. They range from the New England sub area of Massachusetts-Maine to the Tri State axis of Connecticut- New York and New Jersey axis along the Eastern massive Metro areas off the Atlantic seaboard. The spatial information for the study was obtained through numerous organizations consisting of the United States Geological Survey (USGS), USGS New England Water Science Center, the United States Department of Agriculture (USDA), the Northeast Regional Climate Center, the United States Department of Interior, United States General Accounting Office (GAO), and the National Hydropower Association. Additional geospatial data came through the National Oceanic Atmospheric Administration (NOAA), Archives of the states in the Northeast and the Eastern Atlantic and the New England. In addition to that, the US Census Bureau, the Northeast Online Interactive maps, and Acc Weather Inc, The World Health Organization, Nature Conservancy, Water rights group, the US Environmental Protection Agency, (EPA), NOAA/CIRES/National Integrated Drought Information System (NIDIS), and Regional Climate Services in the Eastern Region did also offer other information as required in the enquiry. Largely, much of the water use variables made up of domestic, public supplies, agricultural, thermoelectric and industry withdrawals pertinent to the zone collectively and individually among the states emerged from the archives of the Northeastern states, the USGS Water sciences centers, and Earth Justice. On the one hand, the Northeast Dews dashboard, the other entities at the USGS, Encyclopedia Britannica Inc, NASA, The Northeast water Network, The New England water works, and the Adaptation Network, provided additional secondary data on the numbers, hydrological profile, quantities, trends, deficits in water budget and the categories as well as watershed sustainability matters. On the other, the Northeast Departments of Natural Resources (DNR), the Federal Emergency Management Agency (FEMA), NAACP Legal Defense and Educational Fund Inc, and the Government Accountability Office (GAO) offered vital data to complement the time series data and other valuable information on hydrological assets on such indicators such as surface and ground water budgets highlighting the region. For additional data needs, given that regional and state, county and federal geographic identifier codes of the states were used to geo-code the info contained in the data sets. This information was processed and analyzed with basic descriptive statistics, and GIS with attention paid to the temporal-spatial trends at the state and regional levels in the US Northeastern region and the New England hub and St Lawrence eco zone. The relevant procedures consist of the two stages listed below.
2.2. Stage 1: Identification of Variables, Data Gathering and Study Design
The initial step in this research involved the identification of variables required to analyse the extent of water consumption and variations at the state and regional levels from 1995 to 2015. The elements encompass socio-economic and environmental information including groundwater, surface water, total withdrawals, ground water percentage of total, surface water percentage of total, variations in water depletion level, drought index and changes in ground water level decline. The others consist of total ground water depletion, water withdrawals by category, public supply, domestic water, irrigation, livestock, industrial, mining, thermoelectric power, and the percentage of population dependent on ground water variations. Added to that, are the daily use of ground water, population and percentage changes in state population, total water uses by category, and sources, percentage of change, ground water total, ground water average, total withdrawal of water by source and state, water withdrawal by category, self-supplied industrials, water decline volume and water volume increments. There were also water pollution patterns, extra drought, or water shortage index, precipitation index, standardized precipitation index, ranking of drought vulnerability and drought intensity vulnerability. The variables as mentioned earlier came from secondary sources made up of government documents, newsletters, and other documents from NGOs. This process continued with the design of data matrices for socioeconomic and land use (environmental) variables covering the census periods from 1995, 2005 to 2010 to 2015. The design of spatial data for the GIS analysis required the delineation of county boundary lines within the study area as well. Since the authorized boundary lines amongst the eleven states stayed unchanged, a common geographic identifier code was assigned to each of the area units for analytical coherency.
2.3. Stage 2: Step 2: Data Analysis and GIS Mapping
In the second stage, descriptive statistics and spatial analysis were employed to transform the original socioeconomic and ecological data into relative measures (percentages, ratios, and rates). This process generated the parameters for establishing, the extent of water consumption, withdrawals, depletion, the populations served, the categories served, the sources of water extracted, and the depletion of water types distributed but precipitated by overuse and the trends across the Northeastern region for each of the eleven states through measurements and comparisons overtime. While the spatial units of analysis consist of states, regions, shorelines, and counties, the boundary, and locations where the over extraction of ground water thrived. This framework ensures the identification of change. As the graphics underscore the actual frequency and impacts, water depletion and the intensity of consumption and the trends coupled with the environmental and fiscal costs. The remaining steps involve spatial analysis and output (maps-tables-text) covering the study period, using Arc GIS 11 and SPSS 29. With spatial units of analysis covered in the eleven states (Figure 1), the study area map indicates boundary limits of the units and their geographic locations. The outputs for each state were not only mapped and compared across time, but the geographic data for the units which covered boundaries, also includes ecological data of land cover files and paper and digital maps from 1995-2015. This process helped show the spatial evolution of location of various levels of usage, and the trends, the ensuing socio-economic and environmental impacts, ecological degradation as well as changes in other variables and factors driving the depletion of water and impacts in the study area.
3. The Results
This section of the paper focuses on temporal and spatial profile of water resource trends in the study area among various sectors and categories. There is an initial focus on the evaluation of water use between the states based on descriptive statistics, assessment of depletion and the regional changes in water usage. The other parts stress the impacts of usage in the various states and the zone. This is followed by GIS mappings and the factors linked to the water stress.
3.1. Water Resources Use In The 11 States 1995-2015
For a better alignment of the logic driving the order of temporal presentation of water resources use in the past two decades in the study area. This section follows a temporal portrait with some snapshots of potentials, abundance, and changes. Accordingly, the analysis of the hydrology of the zone falls under multiple periods upon which water usage in different sectors and category occurred. Thus, the time series as manifested in the core indices involved 3 major points over time in the region. The era coincides with the distribution volumes and the underlying activities among the states through 1995-2000, 2005, and 2010 to 1995.
3.1.1. Water Use Activities 1995-2000 Cycle
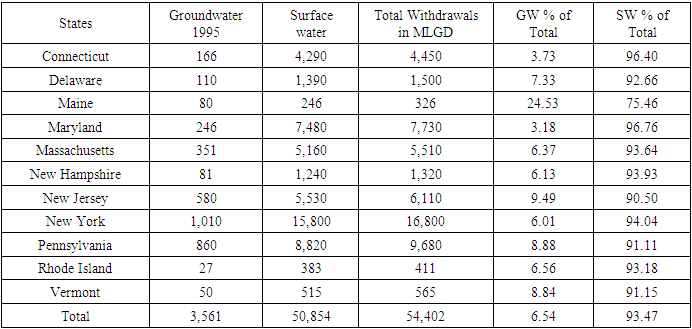
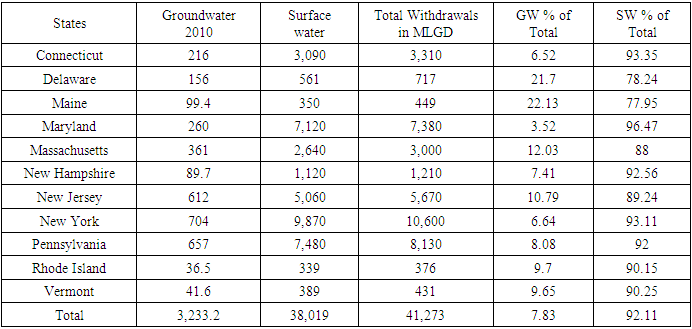
The measurement total of water withdrawal by source indicates a combined overall of 54,402 MLGD in ground and surface water levels with the former (GW) at 3561Mlgd lesser than the latter total (of 50,854 MLGD) at the regional level’s ratios of 6.54% to 93.47% in 1995. In looking at the water index among the states for 1995, the trio of big states headlined by New York, Pennsylvania, and New Jersey took out more ground water to the tune of 1,010, 860, to 580 MLGD at levels far ahead of their neighbors. For that, in comparison to the quartet of the other states in the zone comprising of Maryland, Massachusetts, Connecticut, and Delaware, subterranean water pumpage stood at mostly in the low values of 246- 351 MLGD to 166-110 MLGD. In the low-end areas in New England where both Maine and New Hampshire used up merely 81-80 MLGD in ground water, Rhode Island and Vermont followed with 27-50 MLGD. The surface water type distribution offers a profound distinction with the Empire state of New York clearly on another level of its own at 15,800 MLGD as Pennsylvania and Maryland accumulated appreciable volumes (8,820, -7,480 MLGD). These are at quantities completely higher than those in the nearby areas of active usage in New Jersey, Massachusetts, and Connecticut where water transfer figures during 1995 came to 5,000 MLGD plus to 4,290 MLGD. Under similar proportions, a quintet of states; Delaware, New Hampshire, Rhode Island, Vermont, and Maine removed 1,390, 1,240, 515, 383 -246 MLGD out of surface water reservoirs in the Northeast region. Considering that the total withdrawals among the states held firm, the large margin in ratios between ground and surface H2O as mentioned earlier attests to the attributes of Northeast environmental geology, as an area heavily reliant on exterior water. The group of places in the first category where surface use percentage exceeds 90% consists of ten major Northeast and New England states of Maryland, Massachusetts, New Hampshire, New Jersey, New York, Pennsylvania, Rhode Island except for Maine known for its surface ratio of 75.46% and grand water ratio of 24.53% as 10 other states accounted for ground H2O percentage averages in mostly single digits. (Table 2).Table 2. Total Withdrawals by Source and State 1995 in MLGD
 |
| |
|
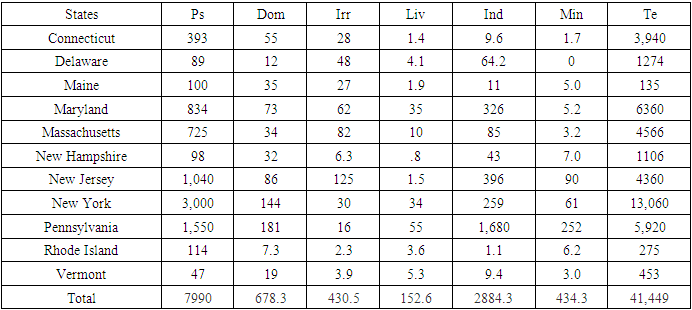
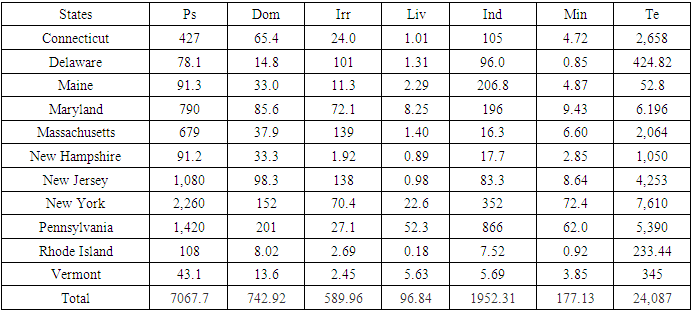
The total water withdrawals in the region exemplified by seven separate classifications in 1995 cover public supply, domestic irrigation, livestock, industrial, mining, and thermoelectric. In the context of our assessment and improved knowledge of the trends in water use activities all through the fiscal year. The 7 water use groupings reflect society, and agriculture signifying the initial quartet (ps, dom, irr, liv) and the final trio (ind, min, te) labeled industrial. Taking a cue from the available information, the water intended for the human settlements and community such as public supply and domestic households reached between 7990-678.3 MLGD while irrigation and livestock operations in the agricultural sector diverted about 430.5-152.612 MLGD. The big industrial sectors characterized by industry, mining and thermoelectric or hydro power with large presence in the Northeast areas, raked in 2884.3,434.3 to41,449 MLGD. In summing up the 1995 tallies of 54,019 MLGD in 1995, the 3 other categories previously delineated as community use and agriculture covered just 16.04% -1.07%, whereas industrial group held around 82.87%. Under that sector, the thermoelectric industry solely at 76.73% only demonstrated its domination as the undisputed water user much larger than the others. In general water usage in the Northeast region stands immensely more concentrated in hydroelectricity power generation and agriculture with both irrigation and public supply as important users as also. At the state level, New York, Pennsylvania, New Jersey, Maryland, and Massachusetts to certain extent looks quite greater and robust in front of the remaining states in terms of community indices of public supply and household use by 3,000,144 MLGD, 1,550-181 MLGD, 834-73 MLGD to 725-34 MLGD. In the farming sector, Water use for irrigation measured at 125, 82, 62 -48 MLGD in 4 states, puts New Jersey, Massachusetts, Maryland, and Delaware in the first pole, whereas New York, Connecticut, Maine, and Pennsylvania in the second level gulped 30 MLGD- 27-28 MLGD and 16 MLGD. In the same period, irrigation usage faded slowly by 2.3 MLGD, 3.9 MLGD to .8 MLGD in Rhode Island, Vermont, and New Hampshire. In the same farm sector, where Pennsylvania, New York, Maryland held on to the prime spot-on water set aside for livestock in 1995 at 55, 34, 35, MLGD, the rest of the adjoining neighbors from Connecticut to New Jersey held steady on the lower end of the distribution chain. When it comes to total water withdrawals in industry and mining sectors of the economy, Pennsylvania as the center place outpaced all other states by the margin of 1,680 MLGD to 252 MLGD in 1995.With the state of New York rated as the leading thermoelectric water user in 1995 at 13,060 MLGD, the pair of additional states, Maryland and Pennsylvania extracted about 6360- 5,920 MLGD as the remaining trio of Massachusetts, New Jersey, Connecticut finished at identical levels of 4566, 4360-3,940 MLGD respectively (Table 2.1).Table 2.1. Total Withdrawals by Water Use Category 1995 in MLGD
 |
| |
|
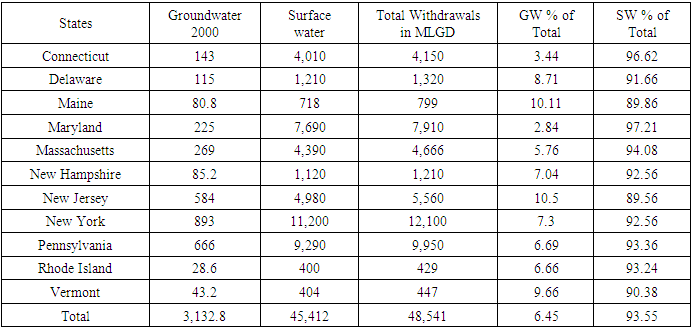
Exactly like in the earlier time, the amount of total water extraction pertaining to the duo of natural sources beginning from ground to surface under which (GW) quantities of 3,132.8 MLGD appeared lower than the surface water volume of 45,412 MLGD for the region in 2000. Within the group of states, where the forms of ground water transfer remained firm. See that New York, Pennsylvania, New Jersey, Massachusetts, and Maryland kept as much as 893MLGD -666 MLGD, 584 MLGD to 269 MLGD as well as 225 MLGD in the fiscal year 2000. Since the second unit of states (Connecticut, Delaware, New Hampshire, Maine), all drew 143, 115, 85.2 - 80.8 MLGD, the remaining trio in the region (Vermont and Rhode Island) that extracted 43.2-28.6 MLGDs did partake in the scramble for subterranean water outtake. In addition to the surface water allocation levels being marginally shifted, New York, Pennsylvania, together with Maryland at 11,200, 9,290 - 7,690 MLGD, still maintained their leading rankings. This occurred notwithstanding the presence of Connecticut, New Jersey, and Massachusetts on the second pole at the average of 4460 MLGD. Additionally, one need not forget similar levels of 1,210- 1,120 MLGD in water distribution for Delaware and New Hampshire. In the last group of states, both Maine, Vermont, and Rhode Island used up lower levels of water in the hundreds of MLGDs (718, 404, 400 mlgd) consistent with the scales of demands and requirements in their separate localities in the region. Consequently, once again, the ground water -surface water comparisons in the region remained at 6.45% to 93.55%, making the region an important surface water zone. Having seen Maine, New Jersey and Vermont reliance on groundwater measured at rates of over 10% to 9.66% in ground water. The group of 2 places where surface water proportion at 89.56 -89.86% extends from New Jersey to Maine while 9 of 11 states from Vermont to Maryland sits on 90.38% to 97.21% of surface water (Table 3).Table 3. Total Withdrawals by Source and State 2000 in MLGD
 |
| |
|
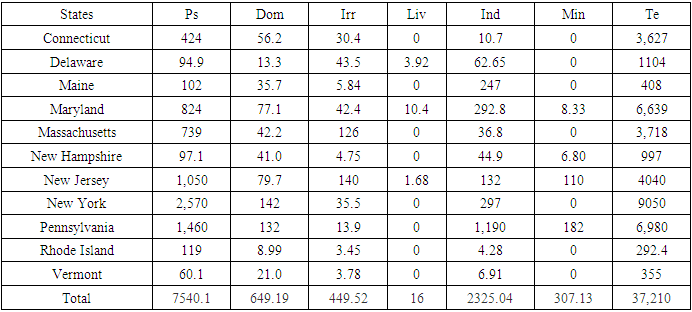
The complete water withdrawals in the zone as demonstrated in 2000 reveal a variety of sources based on needs across sectors made up of public supply, domestic, irrigation, livestock industrial, mining, and thermo electric. In following that scenario, therefore, the real total water withdrawal by groupings exemplifies transfers to social or built-up ecosystem. This occurred through community targets under civic or public supply and domestic localities estimated at 7540.1-649.19 MLGD. Elsewhere, the agricultural sector characterized by irrigation and livestock operations allotted 449.52-16 MLGD as the heavy engineering tech side, water use projected for industrial sectors of the economy via industry or manufacturing, mining and thermoelectric consumed about 2325.04, 307.13-37,210 MLGD of water. Of the region’s total of 48,497.38 MLGD in water usage across the numerous classes, the delivery patterns indicates both public and domestic supply represents solely 15.54-1.33%, whereas irrigation and livestock took the other 0.92-0.03% of the hydrological assets together with industrial collective (industrial, mining, and thermoelectric) percentage total of 4.79, 0.63-76.72. Of these indicators, the hydroelectric sector emerged as the largest user than the others. Just as this seems somewhat below the levels from the preceding 5 years, hydroelectric power stood out as the major user of water in the zone in 2000 with public supply and industry water supply ranked 2nd and 3rd in the classification by group. Between the states, New York, New Jersey, and Pennsylvania maintained an average value of 1356, 565-796 MLGD higher than the adjoining states in public supply and residential water usage as New Jersey, Maryland, and Delaware with 70.84, 26.4, and 23.71 MLGD average separately, dominated the agricultural sectors of irrigation and livestock. Pertaining to industry and mining water removals, in as much as Pennsylvania demonstrated a robust average use levels above nearby states by 686 MLGD in the fiscal year 2000, the states of Maryland and New Jersey did hang on as the topmost spots in mining water use with 588 -132.6 MLGD ahead of the others. Aside from New York’s rank as the number one thermoelectric water user at 9050 MLGD in the region, Pennsylvania, and Maryland took out 6980-6639 MLGD for hydro power. Still, Connecticut and Massachusetts averaged 3673 MLGD of water to serve the needs of thermoelectric operations with the allotment levels in New Jersey and Delaware at 4040-1104 MLGD. In a similar vein, a group of three other states (Vermont, Maine, and New Hampshire) accounted for a collective mean value of 513 MLGD for the same purpose in the thermo electric sector in the areas in the year 2000 (Table 3.1).Table 3.1. Total Withdrawals by Water Use Category 2000 in MLGD
 |
| |
|
3.1.2. Water Use Activities 2005 Cycle
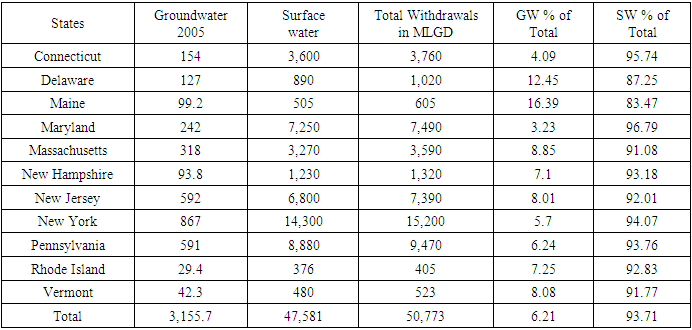
Going through the temporal profile of the individual total water extraction by sources, the region’s water stocks indicate both ground and surface amounts of 3,155.7-47,581 MLGD. This brings it to the sum of 50,773 MLGD in overall withdrawals in 2005. With the composition of the leading states in ground water transactions in the zone still consistent as in the previous 5 years. It is worthy of note as expected that the big three made up of New York, Pennsylvania, and New Jersey, kept their respective positions in the upper echelons of ordinal rankings in ground water withdrawals estimated at around 867, 592 to MLGD. From the regional hydrological index as displayed in 2005, the respective volumes in the last trio of states far exceed the trends in Massachusetts and Maryland where ground transfers stood at 318-242 MLGD in the same period. Looking at the second set of states represented in the medium classifications as headlined by Connecticut and Delaware, subterrain water transfers in both places waned significantly in volumes by 154- 127 MLGD. Further down the rankings in group 3, the quartet of states there in (Maine, New Hampshire, Vermont, and Rhode Island) took out just 99.2, 93.8 MLGD to 42.3-29.4 MLGD, that is indicative of the low water usage below the levels among the big three in 2005. Turning to surface water supply side in the usage, the pair of Eastern Atlantic regular prominent states such as New York, Pennsylvania, Maryland, and New Jersey transferred tens and thousands of MLGD worth 14,300, 8,880 MLGD -7,250-6,800 MLGD together with the second tier of areas particularly Connecticut, Massachusetts, and New Hampshire where surface use reached 3,600, 3,270, to 1,230 MLGD in 2005. The three lower states in the classification comprising Maine, Vermont, and Rhode Island still maintained their part of surface water levels of 505, 480-376 MLGD. In that situation, the study area amassed a ground water and surface water ratio of 6.21% to 93.71% with Delaware and Maine dependence on ground water at the scale of 12.45-16.39%, much higher than the rest of their neighbors. Even at that, note that surface H2O percentage distribution among the leading states remained mostly at plus 96.79%, 95.74-83.47% levels. This bolsters the zone’s richness in surface water sources in lakes and rivers (Table 4). For the full meaning of acronyms used see the Appendix.Table 4. Total Withdrawals by Source and State 2005 in MLGD
 |
| |
|
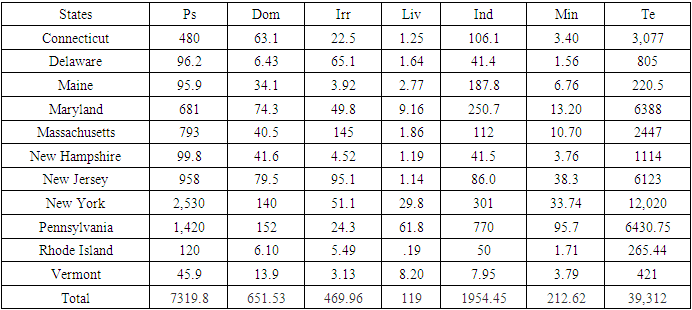
The outline of full water withdrawals throughout the Northeast region in 2005 census period by category shows municipal or public supply and residential customers and the farm operators through irrigation and livestock transferred 7319.8- 651.53 MLGD to 469.96- 119 MLGD. From there, comes strong diversion of enormous volumes of water about 1954.45, 212.62 to 39,312 MLGD geared to serve the rising requirements in the chiefly mechanical sector of high tech and energy portions of the economy represented under the umbrella of industry, mining, and thermoelectric power. From the cumulative water stock of 50,039.05 MLGD for every sector, soft areas as represented by public, domestic and agricultural industry users of irrigation and livestock water took out simply 14.62%, -1.3% to 0.93%-0.23% correspondingly. This signifies just about 17.08 % when matched with the heavy industry’s 82.88% total use rate in water mining. Of these, thermoelectric stake at 78.56% overshadowed the values for both industry and mining based on their small totals of 3.9-0.42%. Bearing in mind the trends within the state level as always, New York, Pennsylvania, New Jersey, Massachusetts, and Maryland, diverted joint totals of 5279.5-1558.5 MLGD at averages of 879-379.2 MLGD in municipal and residential water use categories. As such, some of the prominent states such as Delaware, Massachusetts, New Jersey, New York, and Pennsylvania involved in active agricultural operations still showed their sectorial prominence based on the highest transferred totals and averages of 476.84-4.76.8 MLGD water volumes directed at irrigation and livestock. Furthermore, despite Pennsylvania’s large industrial water allocations at 770 MLGD, a quartet of states represented by New York, Maine, Maryland, and Massachusetts still held their own in terms of activities in the sector given their collective water distribution levels of 851.5 MLGD and an average of 212.8 MLGD. Even though the water distribution forms in mining seemed completely skewed in favor of Pennsylvania, New York and New Jersey, New York remained the largest thermoelectric water user estimated at 12,020 MLGD followed by Pennsylvania, Maryland, and New Jersey again where hydro power water apportionment stood at 6430.75, 6388-6123 MLGD. Of the remaining trio of areas in the classification, Connecticut, Massachusetts, and New Hampshire allocated about 6638 MLGD at an average of 2213 MLGD compared with the totals and average values of 1711.94 MLGD-427.9 MLGD for the states of Delaware, Maine, Rhode Island, and Vermont in 2005 (Table 4.1).Table 4.1. Total Withdrawals by Water Use Category 2005 in MLGD
 |
| |
|
3.1.3. Water Use Activities 2010-2015 Cycle
Based on the summary of water usage through twin sources, the Northeast region’s hydrological assessment reveals ground and surface water ratio of 7.83-92.11% and 3,233.2-38,019 MLGD in 2010 whereas at the various states, the pace of ground water use among the major areas of the zone in New York, Pennsylvania, New Jersey at 704, 657 -612 MLGD exceeded their competitors. Even at those levels, the transactions at Massachusetts, Maryland and Connecticut valued at 361, 260- 216 MLGD are quite worthy as well but below the standard of the leading users in the region. With subterrain water extraction levels in the medium group (of Delaware, Maine, New Hampshire) in the lower hundreds and below of 156, 99.4, -89.7 MLGDs by 2010, the adjoining states of Vermont and Rhode Island extracted 36.5-41.6 MLGD at the same period. The surface side of the water portfolio as captured in the transfer flows of the resource point the recurrency of activities among the largely quartet of big-time consumers consisting of New York, Pennsylvania, Maryland, New Jersey who left no one in doubts of their dominance with vast quantities of water estimated at 9,870, 7,480- 7,120, 5,060 MLGD. In the second tier of states, Connecticut, Massachusetts, and New Hampshire held on to their spots in the profiles through water allotment in the order of 3,090, 2,640, to 1,120 MLGD. By the same fiscal year of 2010, the 3rd class of states Delaware, Maine, Rhode Island, and Vermont again remained at their respective levels 389, 561 to 350- 339 MLGD reflective of the sectorial requirements germane to the respective places under analysis. Consistent with the emergent trends so far, the Northeast region still boasts of substantial hydrological treasures in which ground water and surface ratio involves disparate share with huge abundance of surface water spread across the zone. In the process, subterrain water dependency for Delaware and Maine as the highest regionwide, stands at 21.7- 22.13% followed by Massachusetts and New Jersey at 12.03-10.79% respectively. Furthermore, the surface water percentage levels within the states indicates over 90% in surface water abundance in 8 states and the remaining 3 states with ratios of 77.95, 88%, 89.24% as well in the 2010 census period. (Table 5).Table 5. Total Withdrawals by Source and State 2010 in MLGD
 |
| |
|
The rundown of total water transfer across the study area by 2010 indicates remarkable activities including 7067.7-742.92 .9 MLGD directed at the built-up areas towards municipal or public supply and domestic households. This is in conjunction with 589.96-96.84 MLGD allotted to agricultural sector for irrigation and livestock coupled with the bigger segments (1952.31,177.13-24,087 MLGD) set aside for other groupings in the tech sector characterized by industries, mining, and thermoelectric power. Out of the region’s 34,714.1 MLGD in total sectoral hydrological water distribution, extraction rates in both public supply and agricultural operations via irrigation and livestock activities hovered in between 20.35%-2.14%, to 1.69%-0.27% during 2010, and 10.06 - 1.20% to -15.10-1.38% in 2010 at overall rate of 24.49% -1.96 %. This appears essentially lower than the collective percentage points of 75.51% in the heavy-duty tech and energy sphere. However, if disaggregated under the specific sub sectorial areas, the water provision ratios for industries, mining, and hydro power stayed at 5.62%- 0.51%-69.38%. Consistent with the foregoing profile is the preeminence of New York, Pennsylvania, New Jersey, Maryland, and Massachusetts with around 2,260,1,420, 1,080-790-679 MLGD in public use together with a strong delivery of 152-201, 98.3 MLGD to 85.6- 37.9 MLGD in households/domestic water supply by regional standards. Along the same lines, and under the agricultural sector despite the initial pile ups of farm water use in Delaware, Massachusetts, and New Jersey worth 101-1.31 MLGD, 139-1.40 MLGD to 138- 0.98 MLGD. The trio of the states Maryland, New York, and Pennsylvania notably active in the farm sector as well, still took out enough water tallied at 72.1-8.25MLGD-70.4-22.6 MLGD to 27.1- 52.3 MLGD to sustain the irrigation and livestock sub sectors. The fact that New York and Pennsylvania dominated the industry and mining sectors with 352 -72.4 MLGD to 866- 62.0 MLGDs in water use, Maine’s water apportionment levels of 206.8 MLGD -4.87 MLGD in the tech areas of industry and mining remain significant considering its size in comparison to the states in the zone. The stable form of water withdrawal levels (of 7,610, - 6.196 MLGD to 5,390-4,253 MLGD, 2,064 MLGD) for thermoelectric power activities in 2010 finds New York, Pennsylvania, Maryland, New Jersey in familiar spots of dominance over Connecticut, Massachusetts, and New Hampshire where usage ranged from 2,658-2,064 MLGD to 1,050 MLGDs. Within the other places, thermoelectric power water allocation saw ample use in Delaware, Vermont, and Rhode Island at 424.82, 233.44- 345 MLGD in 2010 (Table 5.1). Table 5.1. Total Withdrawals by Water Use Category 2010 in MLGD
 |
| |
|
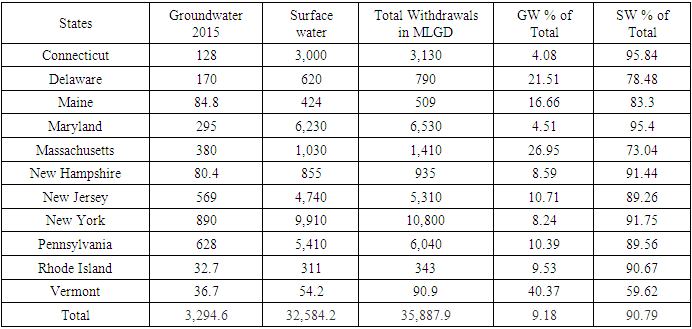
Seeing the intensity of full water transfer by source in 2015 in the study area, the gap in the region’s distribution patterns still stands at 3,294.6 to 32,584.2 MLGD with ground water always surpassed by surface water by a huge surplus. Yet, the accumulated build up from the prior periods as shown between the 5 major users of ground water, New York, Pennsylvania, and New Jersey continued with the supply levels of 569, 890, 628 MLGD. This represents 2087 MLGD in overall tallies and 63.34% of the regional source in 2015 at a rate far more above the nearby states listed on the matrix. Even though, they ranked below the leading states, as no bystanders in water transactions in the hub, during the same period, the states of Massachusetts and Maryland still allotted significant volumes (380-295 MLGD) of ground water among group one tier of states. Among those in the medium or group 2 water consumers in the zone, Delaware, Connecticut, Maine, and New Hampshire took out 170-128 MLGD to 84.8-80.4 MLGD as Rhode Island and Vermont rounded out the list of consuming states barely at lower levels of 36.7-32.7 MLGD in the study area. Concerning, surface water removals, New York, Maryland, Pennsylvania, and New Jersey with 9,910-6,230 MLGD to 5,410-4,740 MLGD appeared as the only principal consumers while neighboring New England states of Connecticut, Massachusetts and New Hampshire in the middle group took out around 3,000, 1,030-855MLGD in surface water resources. The 4-remaining group of 4 states (Delaware, Maine, Rhode Island, Vermont) rated in lower scale of surface water use still diverted a combined volume of 1409.2 MLGD in 2015 at an average of 352.3 MLGD. Fundamentally, the massive percentage difference existing between ground water and surface water stands out by a margin of 9.18-90.79% under which Massachusetts, Delaware and Vermont outpaced their neighbors by multiple ratios (of 21.51-78.48 to 26.95-73.04 and 40.37-59.62% in ground water transfer as 8 (5 to 3) states averaged around over 90% -80% in surface access. Accordingly, the ongoing analysis once again obviously attests to the status of the Northeast zone as a major surface water frontier in the nation, thus the comparative abundance there over the years from 1995-2015 (Table 6).Table 6. Total Withdrawals by Source and State 2015 in MLGD
 |
| |
|
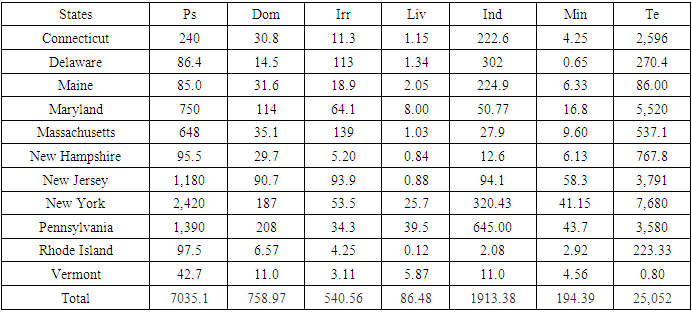
10) The total water distributions in the Northeast under the 7 categories in 2015 indicates the allotment of 7035.1-758.97 MLGD to public supply and households’ areas together with portions of the supplies valued at 540.56-86.48 MLGD for irrigation and animal husbandry (livestock farming). This seems slightly different when compared to water levels of 1913.38-194.39 MLGD-25,052 MLGD as were distributed for usage in the industries, mining, and hydro power sectors. Of the region’s 35,5581.31 total water transactions by category in which public/domestic use, irrigation and livestock activities were between 19.77- 2.13, to 1.51%-0.24% out of combined values of 21.9% to -1.75%. The rising requirements by the tech industry and energy to sustain mining and hydropower at 76.317% in total comes to 5.37-0.54-70.40% along separate sectorial lines in 2015. At the state level, expectedly, the states of New York, Pennsylvania, and New Jersey held on to the higher rankings in public and domestic water mining by noteworthy levels of 2,420, 1,390, 1,180 MLGD to 187- 208- 90.7 MLGD. In the same period, the duo of states (Maryland and Massachusetts) listed under the same categories of public and household consumption accounted for 750-648 MLGD to 114-35.1 MLGD. In as much as Delaware and Massachusetts transferred about slightly similar levels (of 113-1.34 MLGD, 139-1.03 MLGD) mostly tied to irrigation in the agriculture use of water in 2015. The perennial big time water users like New York and Pennsylvania used up only 53.5-25.7 MLGD to 34.3-39.5 MLGD. This seems in the same form as in the states of New Jersey and Maryland, where farm water transfers reached 93.9-0.88 MLGD to 64.1-8.00 MLGD. Regarding the activities of major users, see the significant water transfers (of 645.00-43.7 MLGD to320.43-41.15 MLGD) for industry and mining in both Pennsylvania and New York at levels ahead of other neighbors in the Northeast region in 2015. In terms of the thermoelectric sector, New York, and Maryland remained the prominent consumers of water by 7,680-5,520 MLGD followed by neighboring New Jersey and Pennsylvania on identical levels of water allocation of 3,791-3,580 MLGD. In the next or 2nd group of large water users, Connecticut, Massachusetts, and New Hampshire also transferred vast amounts estimated at 2,596 ,537.1-767.8 MLGD as Delaware, Rhode Island and Vermont finished with 270.4- 223.33- 0.80 MLGD during 2015 in hydroelectricity water transfer (Table 6.1).Table 6.1. Total Withdrawals by Water Use Category 2015 in MLGD
 |
| |
|
3.2. The Total Water Withdrawal From 1995-2015
The level of total water withdrawals in the study area indicates the whole zone took out 230,877 MLGD at an average of 46,175 from 1995-2015. In the first three periods of 1995, 2000, 2015, water removals stood at generally 46,277 in mean values (54,402, 48,541, 35,887.90 Mlgd), but only to dip further from 50,773-41,273 MLGD. Within the respective states, of the major 4 users, New York and Pennsylvania gulped sizable volumes of water estimated at 65,500, to 43,270 MLGD together with Maryland, and New Jersey who transferred 37,040-30,040 MLGD throughout the years. Elsewhere, the extent of water withdrawals in the second and lower tier states made up of Connecticut and Massachusetts, Delaware and New Hampshire reached identical water values of over 18,000 to 5000 plus MLGD. Also, water extraction for the various sectors at 2688, 2,057-1,964 MLGD were put into notable usage in a trio of lower end states of Maine, Vermont, Rhode Island between 1995-2015. The average water estimates of 13,100, 8,654 MLGD to 7,408-, 6,008 MLGD, in the states of New York, Pennsylvania, Maryland to New Jersey deemed the big four, from 1995-2015 compared to the remaining states in the zone, demonstrated the essence of the regional hydrology in driving various sectors germane to the economy. The opening outlines of the water transfer indicates that as New York usage values in 1995, 2000 fell repeatedly from 16,800 MLGD to 12,100 MLGD, the drifts continued during 2005-2015 by15,200-10,800,-521 MLGD. Further close to the South axis, Pennsylvania’s original water supply of 9,680 MLGD rose to 9,950 MLGD but declined by 8,130 MLGD -6,040 MLGD in 2010 and 2015. Maryland’s opening surge of 7,730-7,910 MLGD in 1995-2000, appeared dampened by soft dips from 7,380- 6,530 MLGD in 2005-2010. The garden city state of New Jersey, which saw declines of 6,110 MLGD -5,560 MLGD in its opening water stock during the period 1995-2000, continued with further drops at 5,670-5,310 MLGD. Accordingly, from the ongoing patterns, it did not emerge as a disbelief as to how Massachusetts experienced outright declines in the takeout of water under the actual tallies of 5,510-4,666 MLGD and 3,000-1,410 MLGD in 1995-2000 to 2010-2015(Table 7).Table 7. Total Water Withdrawals By State 1995-2015 in MLGD
 |
| |
|
3.3. Percentage Changes Among the States 1995-2015
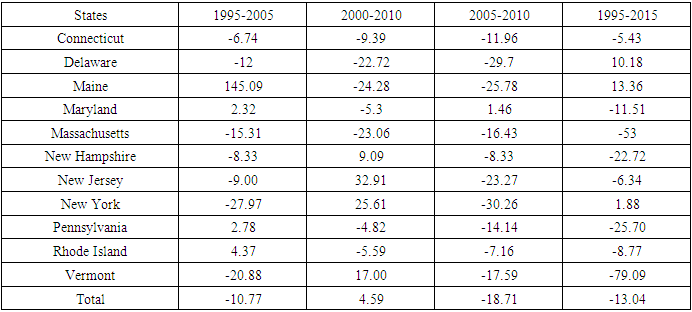
At the regional level, the total water extraction percentage changes in the study area points to notable declines aside from the 4.59% gains in 2000-2010 (Table 7.1). During the other intercensal periods, the variations started at -10.77% in 1995-2005 to -18.71% in 2005-2010 coupled with -13.04% change rate between 1995 to 2015. In looking at the patterns of changes in water use among the individual states. Since two of the New England states like Connecticut and Massachusetts experienced across the board declines throughout out the years. Surprisingly 7 of 11 states saw increments in water extraction in 3 of 4 periods as New York and Maryland held on to even levels of changes under a mix of 2 periods of gains and declines. Complete analysis of the variations indicates that in both Connecticut and Massachusetts, water transfer amounts dropped clearly (-6.74 -9.39 to -11.96 -to -5.43 and -15.31 to-23.06 to -16.43-53) all through 1995-2015 (Table 7.1).Table 7.1. Total % Changes in Water Withdrawals By State, 1995-2015 in MLGD
 |
| |
|
3.4. The Impacts of Water Resources Use Northeast Zone
From the surge in water use and distribution across sectors as outlined for the various activities in the 11 states of the study area. There are a mix of impacts as manifested with many downsides at diverse levels pertaining to the allocation, and risks coming from the trends and how it affects society and environment in the Northeast. This consists of exposures rooted in physical and socio-economic limitations in the zone.
3.4.1. Scarcity and Degradation Risks in the Northeast
Just as in other places, the water supply scarcity that besieged the Northeast started in the autumn of 1961 and persisted despite minor relief through the mid-year of 1966. This cannot be overlooked amidst the pace of recurrent droughts these days. In the case of the situations in the mid-1960s, know that right through the entire Northeast, water supplies stayed less than normal level. Considering that today, there are many individuals in the Northeast who obtain their water out of individual boreholes. Also, iron and manganese pollution appear to be a frequent issue. Aside from common water hardness, the appearance of colours on sinks and toilets as well as potable water with an unpleasant taste are quite telling as revealing indicators. One specifically exceptional concern peculiar to households in the US East Coast, touches on saltwater seepage that raises the chlorides level in the water, thereby creating elevated total dissolved solids (TDS). Furthermore, the intrusion of saltwater as common occurrence within the region’s coastline emanates in the moment water flows out of the ocean and percolates into ground water sources while tainting adjoining freshwater aquifers. The fact that manganese appears to trigger extra problems, in the case of New York, where there are many active salt mines. The wells therein tend to be saturated with elevated TDS from chlorides coupled with burdens of toxic flows unleashed by shifting climate induced rainfalls. This is evident given how Hurricane Irene precipitated hydrological extremes among the states in the region. Such dangerous precipitations as part of a much larger trend in moist climates during the storm, surpassed 25 inches throughout the greater part of the Northeast. Against that background, in Vermont the impacted populace endured widespread allergen exposure from the spread of mold in inundated houses while the physical structures were saturated with possibly toxic chemicals and pathogens in the domestic water supply. Knowing fully well, the cleaning up expenses, the state saw as many as 17 damaged septic systems with risks to ground water and surface river flows in the process.
3.4.2. Socio-Economic Elements
There is always a socio-economic impact in the management of water resources in a water filled region like Northeast regardless of the abundance. This comes under the aegis of human-nature interface that occur in the distribution and extraction of water considering the socio-economic policy and biological effects on communities. In the case of consumer comfort, no one ever wants to experience the troubles of boil water emergencies from water carriers after paying, through monthly invoices. Yet, contrary to the perceptions that boil water alert is peculiar to only some areas of the country, affluent states in new England have had their full share of the dilemma of impacts of water use over the years, in which the consumer suffers in the end. Additionally, the level of sectorial imbalance and inequity in water distribution keeps 70% of available water supply concentrated in hydroelectricity compared to the minuscule portions allotted to households. On top of that, the most troubling thing for the customers is the recurrent pace at which boil water alert occurs. In fact, as recently as the 2022 August, the people in Baltimore passed through the same ordeal. This so happened that most citizens had no idea when the water emergency was going to be lifted. Elsewhere. In the case of the state of Rhode Island, the Department of Health urged residents as late as June 26 of 2023 in the Greenville Water District Water System to heat their water prior to usage to eradicate microorganisms and other viruses, that may be tainting the water source. The same can be said of the Town of North Attenborough in Massachusetts in September of 2022 where a boil water came into effect following the detection of E-coli in the raw form in a water system and treatment facility. At the same time, as of July 23, 2023, customers in a couple of towns in Chester County, Pennsylvania also experienced the same ordeal as part of a compulsory boil water alert.
3.4.3. The Risks of Depletion, Abundance and Declines
In a region where a mix of increases and minor declines in aquifer levels span over periods of 2 to 3 decades. There is growing optimism on the latest discovery of a massive aquifer containing fresh water stuck in permeable deposits underneath the salinized ocean floor. For that, the study area not only has large presence of some of the most productive marine ecosystems sustained by heavy rains and abundant snow falls. But it contains enormous freshwater systems serving potable water to 62 million citizens. Just as the marine and ecological assets represent the concentration of vibrant fisheries and farm operations numbering over 100,000 with $17 billion market value. The estuaries sustain rich ecosystems with habitats for flora and fauna therein. However, human activities and extreme climate events usually manifested via heavy downpours and storms, leaves in their wake flooding and coastal erosion, that are destroying infrastructure and human settlements while negatively impeding water quality and market activity. Seeing that the zone has seen a surge in extreme rainfall than other places in the US. From 1958 and 2010, the region experienced over 70% rise in the volume of downpours estimated at extreme levels. Given the exposure of 450,000-2.3 million citizens to 3 ft in sea level rise in current projections therein. Unprecedented urban development patterns and fiscal investment in coastlines adjacent to major rivers has intensified the vulnerability to liabilities in the region though sea level rise and shoreline storms amidst water abundance. In all these, there also exists widespread H2O declines in 1995-2015 in the zone at the rate of over -13.05%. Of the states, across the board drops in water extraction were evident, except for the high double-digit gains of 32.91%-25.61% to 17.00% for New Jersey, New York, and Vermont. Also, a big sectorial imbalance is occurring, following the vast concentration of over 70% of H2O in agriculture and energy industries, with the latter classified as the biggest user.
3.5. GIS Mappings and Spatial Analysis
The GIS analysis consists of the visual display of spatial patterns underscoring the state of water resources management issues in the region. This covers the various parameters made up of total water withdrawals by source, the percentage of groundwater withdrawals as well as the spots in space, the evolving patterns of variables and critical conditions visibly present over time. While the said indices consist also of drought monitor, drought severity index and drought mean index forms across quite a few states in the study area and the hydrological potentials and drought intensity levels in place. From the portrayals of the indices, some of the core indicators like state ranking of drought vulnerability, standardized precipitation evaporation index, the evolution of water shortage and water stress in the Northeastern region did take center stage. The info conveyed via geo-analytics on several scales and shades denotes the possible risks in the sector. The ability to pinpoint spatial-temporal dimensions of the capacity across the states using GIS as the analytical tool, is quite essential in indicating the state of water resources management and the ecological impacts in the US Northeast region amidst the continual use of the resource across space. Looking at the spatial distribution of ground water withdrawal percentage within the study area. See the multi color display of various activities regarding the resource distinguished in red, orange, yellow and green manifested among the states in question in the US Northeast region. From the info as contained in the legend box, Maine in the upper Northeast corner of the map in deep red emerges as the only state with the highest ground water withdrawal levels estimated at the rates of 9.49%-24.53%. This is followed by ground water distribution levels of 7.33%- 9.49% in a trio of the states in orange, most notably in the neighboring areas of Pennsylvania, and New Jersey in the Southeast side of the map. This is followed by the state of Vermont in the Northwest, while Delaware in yellow finished solely at 6.56%-7.33%. On the lower side of the ground water removal levels among the states identified in light and deep green colors. The areas accounted for 3.73%-6.56% spread across the region in a quartet of states in light green along the central part of study area in Rhode Island, Massachusetts, New Hampshire, and New York. Elsewhere, Maryland and Connecticut identified in deep green used up sub terrain water at the rate of 3.18%-3.73% in 1995 (Figure 2). In the 2000 period, a completely new geographic pattern in the percentage distribution of ground water emerges in the region. Just as the trio of states in red color made up of Maine, Vermont and New Jersey held on to 8.71%-10.50% in subterranean water, Delaware’s water use percentage in orange color shifts to the second category ratios of 7.30%-8.71% under the map. Elsewhere, in the yellow spots of the study area clustered across Pennsylvania, New York in the Southwest and to Rhode Island and New Hampshire. Ground water withdrawals stood at 5.76%-7.30%, while those other states covered under the green colors from Massachusetts in the light green and Connecticut and Maryland, saw water use rates of 3.44%-5.76% to 2.84%-3.44% during the fiscal year 2000 (Figure 2.1). 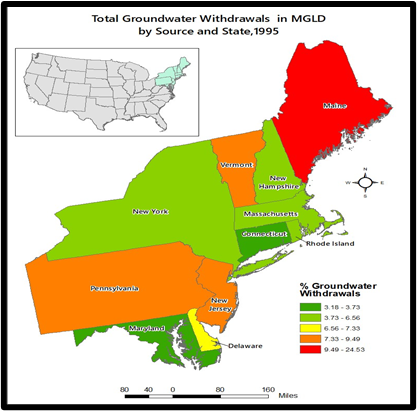 | Figure 2. Total Groundwater Withdrawals by Source 1995 |
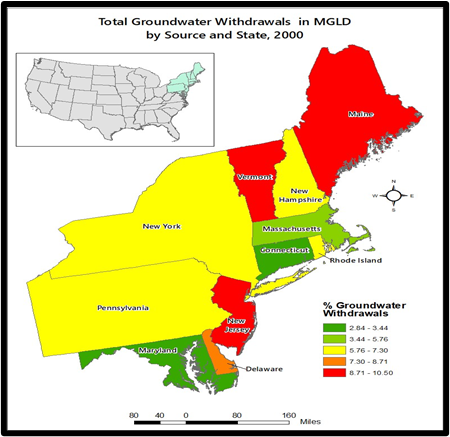 | Figure 2.1. Total Groundwater Withdrawals by Source 2000 |
Out of the slight similarities in the percentages of ground water withdrawals between the color patterns of 2005 and 2010 seasons, the states of Maine and Delaware in the deep red colors each had 8.85-16.39% in ground water extractions in 2005, whereas New Jersey, Massachusetts, and Vermont on the spots in orange colors saw water withdrawals percentage values of 7.25%-8.85%. This seems slightly different with both Rhode Island and New Hampshire at subterrain ratios in water use measured at 6.24%-7.25%. Further along those lines, the states of New York and Pennsylvania in light green areas gulped up 4.09%-6.24% in ground water removal. At similar levels in the green color, both Connecticut and Maryland accumulated just under 3.23% -4.09% in water withdrawal rates in 2005 (Figure 2.2). 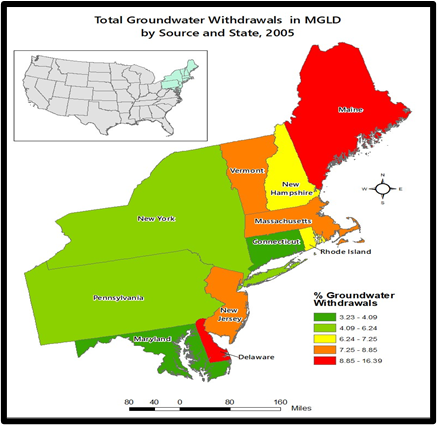 | Figure 2.2. Total Groundwater Withdrawals by Source 2005 |
Just as in the previous past five years or half decade, by 2010 the ground water removal percentage levels of 12.03%-22.13 for Delaware and Maine classified under the category one in red colors in the legend box outpaces the group of 3 states (New Jersey, Massachusetts, and Vermont) where water removal levels in orange colors stood at 8.08%-12.03%. The states of Pennsylvania and New Hampshire in yellow experienced ground water removals ratios of 6.64%-8.08% while New York, Connecticut saw about 3.52%-6.64% in ground water take out under light green shades in the map as Maryland’s water take out in light green reached 3.52% in 2010, (Figure 2.3) Notwithstanding a few pockets of areas in 2015 denoting red, orange, and yellow spots in the map. See the evidence of ground water distribution as manifested in Vermont, Massachusetts and Delaware in red and orange where ground water removal rates in the first levels under classification at 26.95% -40.37% to 16.66-26.95%.Maine in the upper northeast part of the study area in yellow not only was responsible for 10.71%-16.66% in ground water removals in 2015, but notice a huge rally in space at 4.51-10.71% among states from Pennsylvania, New York, New Jersey Rhode Island to New Hampshire identified in light green. On the other hand, Connecticut, and Maryland in dark green finished at 4.08%-4.81% at levels below the other states (Figure 2.4). 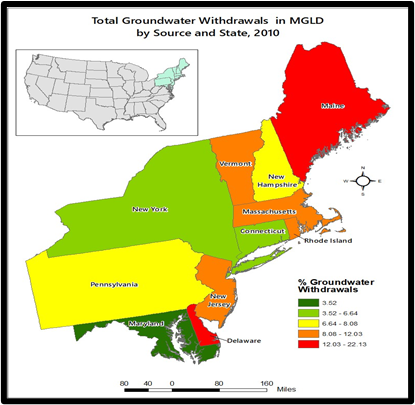 | Figure 2.3. Total Groundwater Withdrawals by Source 2010 |
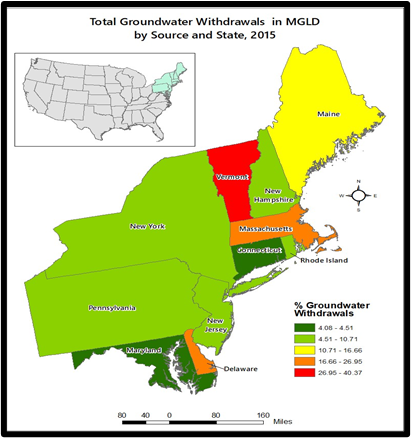 | Figure 2.4. Total Groundwater Withdrawals by Source 2015 |
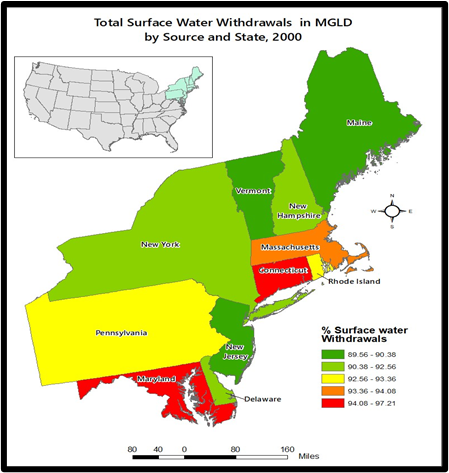
Regarding the percentage of surface water withdrawals in the study area US Northeastern region, see the disparity in surface water removal rates in the region between those areas in green spots and the ones in red and orange. In the period 1995, the places in red colors and orange seem to outpace the others listed on the map. As such, the state of Maryland in the Southeast and Connecticut in Northeast central both in red colors extracted surface water at the rates of 94.01%- 98.78. This is slightly like the percentage ratios of 90.18%-94.04% in water removals in New York, Massachusetts, and New Hampshire as the duo of other states (Delaware and Rhode Island) covered in yellow, posted surface water takeout levels of 81.15-93.18%. In the third and last group of the states involved in water withdrawal activities, the states of Vermont in the Northwest and the duo of New Jersey and Pennsylvania in the South and Maine up in the Northwest maintained water extraction rates of 76.46%-91.10% to 75.46%. (Figure 2.5) With much of the values contained in the map legend somewhat even and under various colors in 2000, like in the previous 5 years, both Connecticut and Maryland in red and Massachusetts in orange held on to larger surface water withdrawal rates of 94.08-97.31% to 93.36%-94.08%. In a similar fashion, the percentage of surface water withdrawals stood firm in the areas in yellow spots in Rhode Island, and Pennsylvania at 92.56%-93.36%. From there came a huge spark in area coverage among the states denoted in green and light green. This is evident through surface water removal levels of 90.38-92.56% in the light green spots concentrated in Delaware, New York, and New Hampshire. This pattern held firm until a late surge in surface water rations on the dark green points gradually dispersed into New Jersey, Vermont, and Maine at the rates of 89.56%-90.38% (Figure 2.6).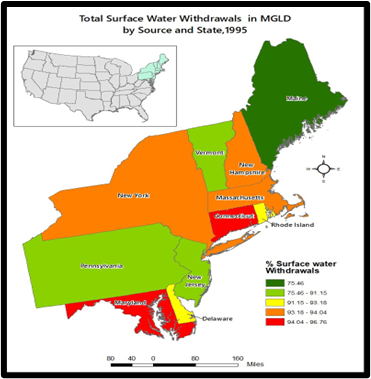 | Figure 2.5. Total Surface Water Withdrawals by Source 1995 |
 | Figure 2.6. Total Surface Water Withdrawals by Source 2000 |
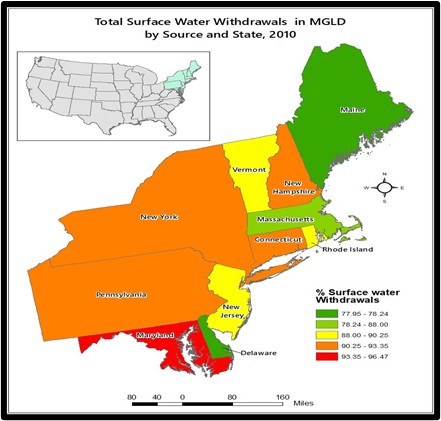
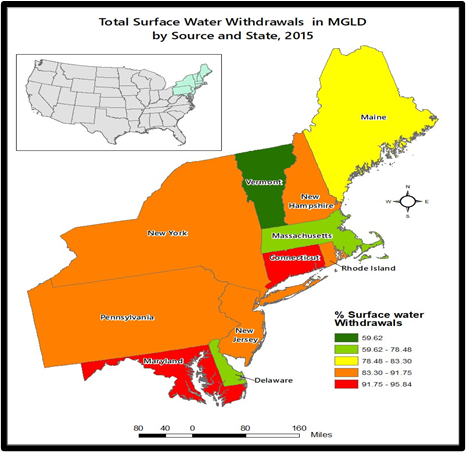
Again in 2005, both Maryland and Connecticut saw surface water withdrawal rates of 94.07-96.79%, as nearby New York and Pennsylvania accumulated 93.16-94.07%. From the details on the legend box based on info displayed in the percentage index, the states of Rhode Island and New Hampshire surface water usage under the yellow spots stood at 92.01-93.16%. Among the other places clustered in light green spots, the trio of Vermont and Massachusetts and New Jersey in light green remained in the mix in terms of water removal levels at the rates of 87.25-92.01%. Elsewhere, Delaware and Maine on the opposite sides of the map at the lower side accounted for 83.47%-87.25% in water removals in the fiscal years of 2005 (Figure 2.7). Seeing the mix of convergence and divergence embedded in the spatial distributions of surface water removals in the study area for 2010 and 2015 seasons in US Northeast region, the state of Maryland in red and host of the other states in orange colors held firm in the percentage value spots. To that effect, starting in the period 2010, Maryland in the red color along the lower part of the map left no one in doubts regarding its viability and potential. This comes amidst the state’s percentage water withdrawals at 93.30-96.47%, far more ahead of the others in the region. In the aftermath of that, follows a quartet of states with water withdrawals rates of 90.25% -93.36% in orange. The dispersal in space extends deep from the south in Pennsylvania, to New York up west and to the Northwest in New Hampshire and Connecticut. Along those spots, emerges another trio of states made up of New Jersey, Rhode Island, and Vermont with water percentage rates of 88.0-90.25%. Added to that is the light green and dark green spots in the map from Delaware, Massachusetts at 78.24%-88.0% to Maine where surface water extraction percentages hovered in the order of 77.08% -78.24% in 2010 (Figure 2.8). By the last period 2015, where the duo of Connecticut and Maryland like in 2005 made repeated gains ahead of their neighbors together under red colors at 91.75-95.84% in the rates of surface water withdrawals. This is followed by the quintet of other states in orange including the tri state area neighbors of New Jersey, Pennsylvania, and New York together with Rhode Island and New Hampshire where floating water ratios of 83.30-91.75% surfaced. In deep contrast from the geographic patterns over the other years, see that under the third values in the hierarchy of hydrological index on the map in yellow color. Maine in the Northeast portion of the study area accumulated surface water levels measured at 78.48%-83.30% as a trio of states (Delaware, Massachusetts, and Vermont) concentrated in the green spots in the map, posted water withdrawals percentages in the order 59.62%-78.48% (Figure 2.9).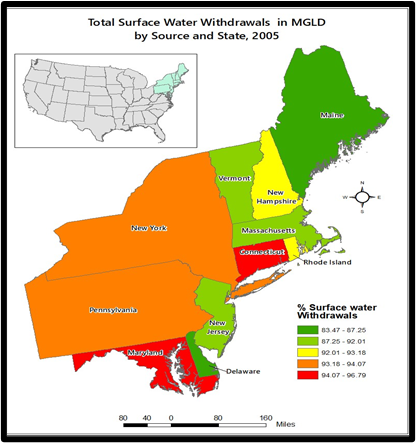 | Figure 2.7. Total Surface Water Withdrawals by Source 2005 |
 | Figure 2.8. Total Surface Water Withdrawals by Source 2010 |
 | Figure 2.9. Total Surface Water Withdrawals by Source 2015 |
The distribution patterns of drought monitor for January to March 2023 comes under varying scales and colors based on the maps and the actual legend box, highlighting the categories of drought peculiar to the states in the Northeast region of the United States in the period under analysis. With drought intensity events in the zone denoted in colors of orange red and white representing moderate and abnormally drought types and none in the Northeast between January 17 to March 2023. Seeing the region’s predominantly cold winters, the map shows patches of red spots in the DO category deemed abnormally dry. They seem fully concentrated in portions of areas in 8 of 11 states from Maryland which saw moderate drought in the lower part of the state to New Hampshire as Pennsylvania, Vermont and Maine stayed on the none-drought category coupled with extension of no drought in many parts of New York (Figure 2.10). 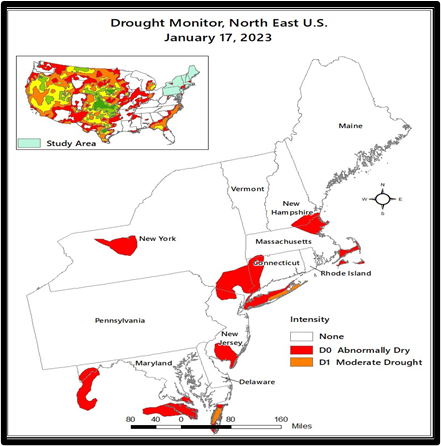 | Figure 2.10. Drought Monitor 2023 January 17th |
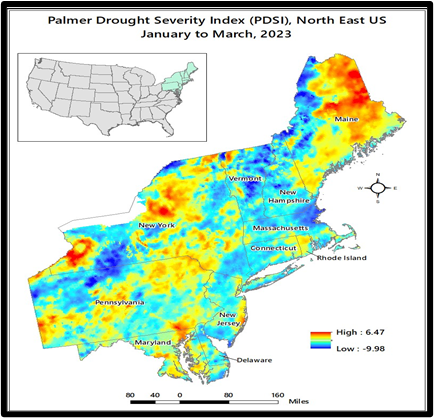
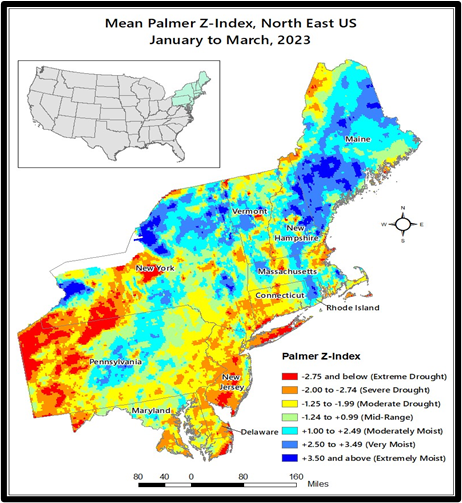
By the month of March 14 of 2023, a new pattern emerges with only abnormally dry drought intensity scattered in patches of few spots in lower New York, Southern parts of Pennsylvania, New Jersey, and Maryland. For that reason, several states from the central area of the study area like Maine, Vermont, New Hampshire, Massachusetts, Connecticut, and Rhode Island in the zone in the non-drought category emerged. As denoted in the map index, these places, did not seem to have been exposed to drought intensity like the others in the zone (Figure 2.11). From the geographic distribution of drought severity index of the study area during January -March of 2023, note that the two levels of high and low in red, yellow and, blue stretched across the states in the zone with Maine having a mix of the bigger and low exposure to the high index values of 647-998 together. In other places in the map, portions of New York, Pennsylvania, Maryland, and New Jersey stayed in the mix, with low category in blue areas dispersed across a couple of states in New England during the 3-month period from January to March (Figure 2.12). Being a proof of another threat of climate change dangers. Further looks on the palmer drought z- index for January to March of 2023 indicates the presence of extreme and severe drought areas in red and orange. The measure consists of values of 2.75 and below as well as 2.00- 274 dubbed severe drought but firmly concentrated in couple of places including Southwest parts of New York and Pennsylvania. Of great importance is the shift towards Maryland, Delaware and more dispersion into New Jersey followed by a gradual spread of yellow and green, light blue points in the map. With these spots representing places hit with moderate, mild, and moderate drought, they are evident from the upper part of study area to scores of places in the South central, and beyond. Additionally, the very moist and extreme portions held firm in the Northeast of the study area and North of New York (Figure 2.13). By the first quarter of 2023, appears a shift in the daily mean palmer Z index with Maine and Northwest New York becoming the areas with spots on the high drought intensity or vulnerability level while Southwest New York, lower New York and Southwest Pennsylvania contained spots under low points of drought intensity or vulnerability in blue (Figure 2.14). 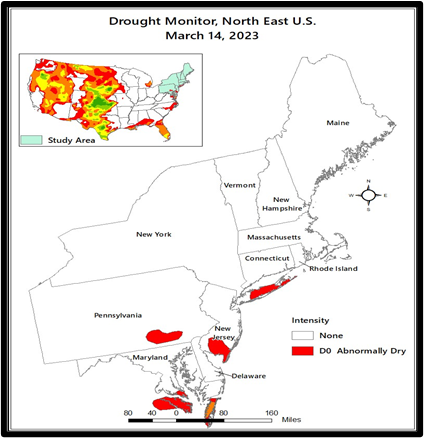 | Figure 2.11. Drought Monitor 2023 March 14th |
 | Figure 2.12. Palmer Drought severity Index Jan-March 2023 |
 | Figure 2.13. Mean Palmer Z-Index Jan-March 2023 N. East |
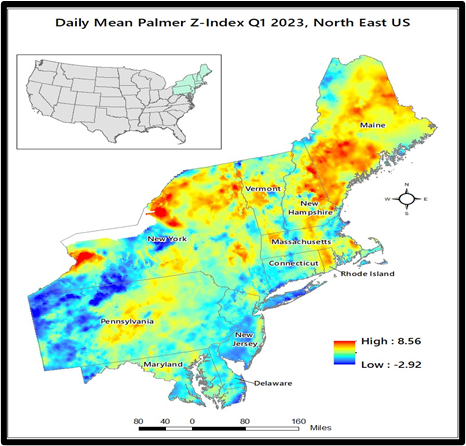 | Figure 2.14. Day Mean Palmer Z- Index Q 1, 2023 N. East |
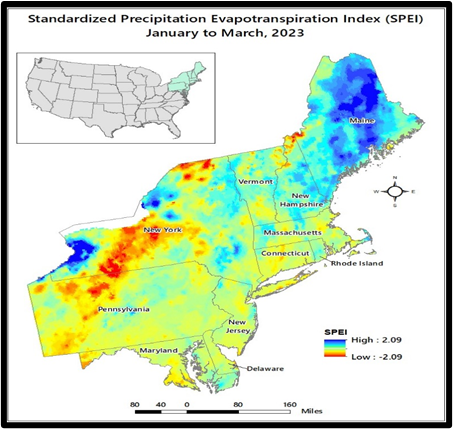
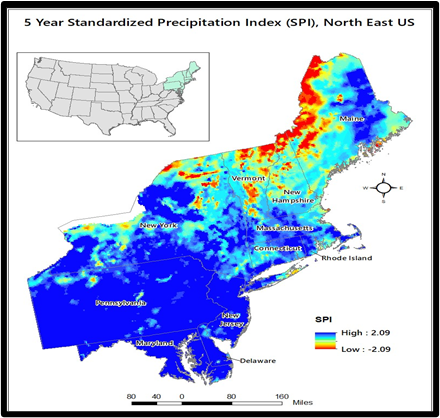
In terms of the generic state ranking of drought vulnerability, with New Jersey covered in orange color as sole area classified under the high category, New York, Vermont, and Maine finished in the medium category in pink as the rest of the remaining states in mostly yellow and beige spots identified as low and very low (Figure 2.15). The standardized precipitation indices for January to March 2023 SPEI and 5-year index SPI offer some interesting perspective regarding water or hydrology in the zone. While this comes across the states under the high-low indices represented in blue and red, and yellow and green. The patterns in Maine located in the Northeast upper side on the map, are covered mostly in high values of 2.09 in blue spots, along with parts of the Northwest and patches of scattered areas in New Hampshire during the initial 3 months duration. In the same period, also note the visible presence of the lower end of the standardized precipitation values of 2.09 firm in both upper, central, and lower New York. Aside from that, the light green and yellow (medium) areas on the map seemed quite sizable in space compared to the blue and red spots listed in the legend box across the states all through January to March of 2023 (Figure 2.16). The geographic patterns under the 5-year standardized precipitation index offer a contrasting scenario in which the high precipitation index as highlighted in blue begins with a big presence in Northeast Maine. While this trend continued with dispersions of the high rainfall index into Massachusetts, Connecticut, New Hampshire, and further towards New York, and Rhode Island. In contrast, the entire Southern tip of the study area from the states of Pennsylvania, Maryland, New Jersey to Delaware saw heavy and overwhelming spell of high precipitation index throughout (Figure 2.17). At same time, like in other parts of the country, the states in the study area are not immune from the discomforts attached to limited water access, granted such concerns, the states must be ready for likely shortages and water stress in the years ahead (Figures 2.18-2.19).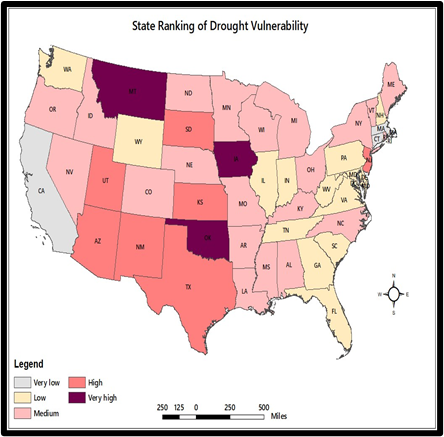 | Figure 2.15. State Ranking of Drought Propensity |
 | Figure 2.16. Standard Precipitation Evapotranspiration index |
 | Figure 2.17. 5 Year Standardized Precipitation Index NE |
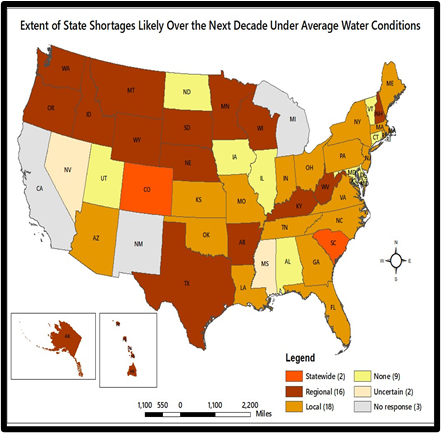 | Figure 2.18. Projection of Water Shortages In the Next Decades |
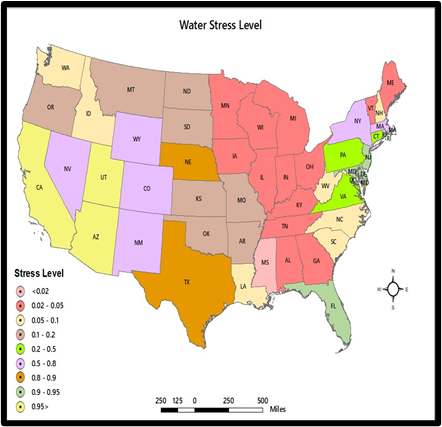 | Figure 2.19. Distribution of Water Stress Levels |
3.6. Factors Shaping Water Use In The North East
The threats of water stress and depletion or variations does not operate in a vacuum in the study area. It is predicated on a set of policy, socio-economic, demographic, and physical factors and climatic parameters listed below one after the other.
3.6.1. Socio-Economic Policy
In a nation where it has been estimated that aging pipes and the system's insufficient capacity leads to the release of around 900 billion gallons of raw wastewater into the streams yearly. Between 1982-2002, communities have expended $1 trillion towards the handling of drinking water and sewer water removal. Accordingly, the American Society of Civil Engineers opined that the authorities would have to fund about $3.6 trillion in the infrastructure upgrade solely by 2020. With the study area not an exception, and minus access to substantial cash, cities battling to stay buoyant would not possess sufficient cash to undertake the maintenance of basic water amenities for the populace. While the lack of funds to upgrade obsolete water infrastructure, contributes to the presence of different toxic substances and microbes from manganese to E-coli in water flow in cities in the zone. The incapacity of existing policy framework in nipping the issue in the bud right from the onset before getting out of hand remains unfathomable. For that, the ad-hoc nature of policy making and planning in which actions emerge solely in the moment of acute emergency, curbs the implementation of long-standing alleviation action plans. Considering the pace of push back of programs whenever new leadership takes over the reign of power in affected areas under regime change. It is unsurprising to see obvious challenges faced in mitigating actions plans manifest in some places when paid lobbyist work openly to stall policies efforts designed to ensure access and water security. Such hypocrisy in sabotaging efforts to safe drinking water cannot be overlooked in the context of the trends that transpired in study area beginning with the frequency in the incidents leading to cases of boil water emergencies. That is why it does not come as a surprise to see water standards of federal regulator the EPA to be at odds with those of independent NGO Environmental Working Group (EWG) whose commitment to equity and social justice is impeccable, hence the role of policy.
3.6.2. Population and Demography
The last two decades in the Northeast brought with it increased population that depended on the emergence of new settlements. This is in line with urban development plans spurring the issuance of building permits driving unprecedented water use in the face of city growth in one of the most urbanized corridors in the US. All through 1995-2015, the breakdown of the region’s population numbers shows it opened at 57,225-59,72, 61,107 to 62,004 and 63,242 million. Against that background, the Northeast has seen its total population grow from 57,225 to 63,342 million at a rate of 10.51% coupled with increases within other sub periods. The state of New York and Pennsylvania being the largest populated areas based on current growth levels, saw their numbers grow notably from 18,136-19,800 million, to 12,072-12,800 million between 1995-2015. In the same order, New Jersey’ population went from 7,945-8,410 to 8,720-8,790 and 8,960 million in 1995-2000, 2005-2010 and 2015. Being a measure of the factor during the periods in which population levels surged markedly, so where the increments in the use of hydrological parameters. In the process, domestic water uses, and public water systems meant to serve the communities stayed stable in some periods followed by increments in some places. In the case of public water supply, on the one hand, note that its percentage share of regional total water budget grew by 14.79-20.35% between 1995-2015. On the other hand, hydroelectric water supply powering the economic engine driving industrial and daily activities in New England held firm much of time at an estimated value of 70% in percentage share of water pumpage in the region from 1995 to 2015, thereby putting more strain on hydrological security. The unprecedented expansions from population and urban growth across major metro areas and cities in the zone, are amounting to large demand for water assets and the attendant stressors contributing to deficits.
3.6.3. Physical Environment and Land Use
The vast role of changing climatic parameters is obvious in explaining the forces shaping water use in the study area. Undoubtedly, the visible damages wrought by such forces as drought, storms, flooding and heavy precipitation and resultant surpluses over time have been felt across much of the areas in the zone, when it comes to the limitations impeding usage. The same can be said of the extent of declines, depletion patterns and the way hurricane induced pollution of lakes and surface water constitute common worries. At the same time, knowing the predominance in the zone as major water source from 1995-2015 surface water shapes access. This influences quality access to water and hydrological insecurity in the zone in the aftermath of hurricane landings. Added to that, are the degree to which land use authorizations sanctioned by state or city laws affect access to water and exposures to danger in places already deemed heavily flood prone along low lying coastal lines. The authorization of urban expansion in the name of shoreline development in affluent areas in the east coast from new Jersey to other areas judged to be in flood zone makes these areas sitting docks in the event of storm surge during the hurricane seasons off the Atlantic Ocean. Since competing land uses known to affect water extraction and transfers cannot operate in the absence of zoning ordinances placing them in certain spots. Activities linked with intensive farming operations within the Northeast farming hubs, can impede water quality, during the fragmentation of natural areas in small watersheds and estuaries, where regular flow are essential to access.
3.6.4. Changing Climate
The links between climate change threats and fluctuating water access in the Northeast over the years remains obvious. This comes with the frequency at which pressures from rapidly dangerous weather conditions threaten marine environments stretched beyond their capacity. All through the Northeast zone, where populations are fully concentrated in localities near to rivers and their flood plains. In the hill sides regions, encompassing greater part of Pennsylvania, New York, Vermont, and New Hampshire. The occurrence of future dangerous downpour events will amount to extensive flood risks, particularly in the valleys, known for human habitation, infrastructure, and where agriculture tends to be concentrated. Because among the Northeast’s population figures of 64 million, nearly 1.6 million of them dwell inside areas classified under the Federal Emergency Management Agency’s (FEMA) 100-year coastal flood zone. The bulk of 63% of those in danger reside in New York and New Jersey. With sea levels rising, people in the present areas with 1% probabilities -in-100-year coastal flood zone will see extra recurrent flooding, and populations that are outside the 1-in-100-year flood zone will find themselves in that at risk area. In the process, those residing in coastal flood zones are susceptible in those circumstances to obvious death and harm linked with tropical storms and nor’easters. Flood destruction to personal property, businesses, and public infrastructure can also amount to liabilities in such settings. For that, some of the states located on the Eastern mid Atlantic seaboard, from Maryland to New York, have all suffered complete strikes during hurricanes and particularly enormous ones in the last 10 years. Among the most extremely significant ones in these events is the advent of Hurricane Sandy which struck in October of 2012. From its landing, the storm demolished large coastline communities around and plus those in New England. With the ferocity of these Hurricanes in knocking off sewer lines, they have been linked with accelerating the flow of non-point sources and point source pollutants to surface water to the detriment of public access to clean water.
4. Discussions
The enquiry emphasized the scale and frequency of water usage within the realm of depletion, deficits, and sectoral dependence and imbalances. In addition to that are the genuine worries over water quality, accessibility, volume, and unequal allotment. The other exposé delves on the connections between water security, and socio-economic and physical factors, land use changes, rising usage, and pollution hazards. Based on the findings, the status of water uses in the Northeast, echo’s abundance, and depletion scenarios in the face of the exposures to shifting climatic volatility. Recognized for the vast web of marine resources, moistness, and precipitations, enormous vegetations, thriving agricultural landscapes. The zone’s standing among the largest urbanized centres of the globe, containing the symbol of the nation’s commercial power in the Eastern Atlantic Seaboard, and now site of the largest freshwater deposit findings globally makes it unique. The urban and coastal developments, vibrant commercial activities coupled with productive agriculture and outstanding soil conditions, the hydrological access and security in the hub remains vital. This comes from the big reliance on water by sectors from agriculture to energy and the others. Still in all this, the Northeast zone is not unaffected by the most water issues peculiar in other areas. Seeing the problems over water security, based on the management practices in the Great Lakes zone. The region experiences recurring threats regarding to boil water emergences linked to poor water quality and pollution incidents arising from the deteriorating infrastructure, and sectoral activities and climate disaster. There is also the vast sectoral imbalance in the allotment of water under regional budgets among all through the periods 1995-2015 with much of the resource heavily concentrated in the hydroelectric power sector than the other segments of the economy. While this is true of the disparate allocations to households, public supply, agriculture and others, the bulk usage of water in the hydroelectricity power sector seems to emanate from its central role in an economy heavily dependent on water transactions. To track the scope of water allocation trends in the face of sectoral disparity, the risks of contamination, deficits, access limitation, urban development and population pressures, policy lapses, and other elements. The study applied mix-scale tools of descriptive statistics and GIS with data involving socio-economic, ecological, and hydrological indices. This includes ground and surface water sources, daily use among the sectors and consumption. From the analysis, 9 out of 11 states in the zone, got their water mostly via surface sources, while only 2 others relied on subterrain water. This makes the region, surface water dependent area. Pertaining the state of water use, the region experienced significant changes through gains and declines in some periods. However, between 1995-2015, water usage rose by more than 4.59% followed by double digit declines in 3 periods. Expect for, 7 of 11 of states, water declines were outright or recurrent in 4 periods among 2 states Connecticut and Massachusetts at a mix of single and high double-digit levels by 1995-2015 as New York and Maryland finished evenly. Therefore, converse to common assumptions, many states in a wet zone area sitting on one of the world’s largest ’under water freshwater reservoir, still encounter water challenges. Looking at the extraction patterns amongst the different states between 1995-2015 and the ordinal ranking throughout the sectors regionwide. The state of New York emerged as the largest water consumer in total volumes of ground and surface water extracted. Being the top consumer of water, between 1995-2015, New York emerged as the largest user of thermoelectric power water, surpassing massively the rest of the states. The water allocation trends within the much smaller areas in the region, particularly in the lower and upper New England axis, showed the domination of trio of users (Delaware, Maine, and Massachusetts) as the states with the largest ground water sources and sectorial allotment for irrigation between 1995-2015. The GIS analysis of the patterns presented the diffusion of hydrological stress and the exposures of water sources to pollution risks, the outbreak of extreme droughts, the relative levels of depletion and the composition of ground water use. Other aspects of the analysis showed the extent of water deficits and surpluses under the withdrawal groups. Considering that the changing tendencies in water use, triggered numerous effects that ravaged the ecosystem. The enquiry indicates that it does not occur in a vacuum because of a host of socio-economic and physical elements located in the larger hydrology and ecosystem of the zone. This encompasses the rapid surge in population and urban development, climate change and ineffective policies and land use. To mitigate the problems, the paper proffered solutions ranging from education, monitoring, sustainable use of water, the design of a regional water info system and the promulgation of effective policy.
5. Conclusions
The study assessed the state of water resources use and the common challenges with findings highlighted under the ensuing headings: a) mix-scale technique efficient; b) changes caused by many factors; c) consumption on the rise; d) impacts of the crisis apparent. In emphasizing the issues in water use within the states in the Northeast region from 1995-2015, the mix-scale model demonstrated different forms not utilized previously by planners. The uses of descriptive statistics in that mode, provided novel capacity of the technique to spot the degree of use based on a mix of gains and declines coupled with the threats of water stress. Considering the precision at which GIS mappings spotted the real compositions, the web of hydrological indicators crucial to the attainment of hydro-political security, patches of ground water dependence, dispersion of ground water depletion and the changes in water withdrawal volumes. The capacity of the tools in highlighting climate hazards and clusters of arid events at various levels in some parts of the zone brings enormous positives for turnarounds. The thing that stands out mostly from the emergent patterns in water use stems from the capacity of mixscale tools in improving the readiness of managers to implement the right action plans whenever abrupt hotspots erupt with instant intervention. The major factors influencing water apportionment in the Northeast zone as shown in the study emanates from a selection of socio-economic and ecological forces based upon ad hoc policy, demographic elements, rapid urbanization and changing climate. In terms of these elements, the reactive posture of decision making in which intervention only happens during big inclement weather events undermines the implementation of mitigation measures considering the resort to the ploy of overturning previously promulgated policy. In the same order, are the part played by the obsession with unprecedented land use development practices comprising of the buildup of new neighbourhoods in low-lying coastline communities deemed susceptible to rising sea levels off the Atlantic Ocean. Such an approach exposes coastal population, properties, and infrastructure to the ferocity of hurricanes and the heavy precipitation known for their risks to community safety, and water quality through chemical runoffs from sewer effluents and other toxins. While the over emphasis on beach front property development and the fiscal benefits that accrues for cities in areas deemed at risk, appears contradictory. The high propensity of the region to climate change risks via drought and debris from heavy rains undermines water access. In highlighting these factors, the study injected new ways for risks monitoring in water use within the wet ecozones. Essentially, in a zone where rapid urbanization drives growth amidst high water demands. The allotment of water to sustain various sectors is fuelling the rising consumption. Considering the pace of its occurrence. The largest consumers comprising of power and utility, public supply, and domestic use, consumed substantial volumes of water from 1995-2015 estimated at millions of gallons daily. From what happened in the 2 decades, the study shows that the Northeast region not only used up around 230,877mlgd of water from 1995-2015. However, water allocation remains significant in the region. This happened as the portions for the power sector reached 72 % in annual sectorial water use by 1995-2015. The design of a comprehensive water index in the analysis as an assessment tool, boosts the focus of planners in tracking sectoral usage over time by raising understanding of the growing changes in patterns. This will ensure accelerated measures among planners whenever water usage, and the deficits exceeds the permissible limits. In line with the results, there are many impacts of water use in the Northeast. This is showed in the forms of declines, socio-economic-policy issues and uncertainty that occurred in the natural and built-up settings. Given the vast presence of water resources in the region, the extraction in the individual states continued unabated as sectors such as public use in New York, the other states, coupled with the utility and power sector involvement in the heavy take out of water. While over pumping of ground water among farmers carry risks, the gravity of water pollution cases, the dispersion of nitrates and pb contamination stresses it. The issue of water quality inhibitors from microbes to others in communities in cities in several states remain alarmingly serious. In that case, there were instances of water degradation in the New England areas and declines in deposits. Aswell, the frequency of boil water alerts in the region subjected local populations in affected areas to exposures to contaminants in water supply. Seeing the consumption volumes in water sources over in the past periods and the unease prompted by the deficits in this study. Planners and researchers will be called to seek responses to many questions vital to water security. The inquiries are as follows: How would future consumption levels shape water security? What are the regional implications for the private sector in water allotment given the sectoral imbalance? How will climate change shape hydrological security? How will ongoing expansions in cities and the concentration of sectoral allocations in the thermoelectric industry influence access? How will the states in the region address the growing threats of water deficits in the zone? From the questions, big opportunities exist for research and practice to consolidate the efforts on sustainable regional water use.
References
| [1] | Day, S. (2009). The Northeast United States. Chicago, IL: Encyclopedia Britannica, Inc. |
| [2] | USGCRP. (2014). Northeast Climate Change Impacts in the United States. New York, NY: United States Government Climate Research Program (USGCRP). |
| [3] | USGCRP. (2014). Climate Change Impacts In the US. The Third National Climate Assessment. New York, NY: United States Government Climate Research Program (USGCRP). |
| [4] | Environmental Protection Agency (EPA). (2020). Climate Change Impacts In the Northeast. Washington, DC: US EPA. |
| [5] | National Wildlife Federation. (2008). More Variable and Uncertain Water Supply. Washington, DC: NWLF. |
| [6] | Barber, N. (2014). Summary of Estimated Water Use In The United States in 2010. Reston, Virginia: USGS. |
| [7] | Soley, W. (1998). USGS Estimated Use of Water In The United States In 1995. US Geological Survey Circular 1200. Denver, Colorado: US Department of the Interior, USGS Information Services. pp 1-74 |
| [8] | Hutson, S. (2004). Estimated Use of Water in The US in 2000. USGS Circular 1268. Denver, Colorado: USGS. |
| [9] | McIntyre, D.A. (2020). These 6 American States Have Plenty of Water. Wall Street.Com Infrastructure |
| [10] | Merem, E. C. (2020). Issues In Transboundary Water Use In The River Nile Basin Area of Africa. World Environment. 10:2: 27-44. |
| [11] | Merem, E. C. (2019, March). Analyzing Current Transboundary Water Issues and Hydro Politics of the Horn of Africa Region. Paper Presented At 93rd Annual Meeting of the Louisiana Academy of Sciences, Baton Rouge: LA. |
| [12] | Merem, E. C. and Twumasi, Y. A. (2006). Hydropolitics: Case of the Niger River Basin. GIS Development: Africa, 24-28. |
| [13] | Merem, E. C. (2006). GIS and Remote Sensing Applications In The Hydropolitics of Sub-Saharan Africa: The Case of Multinational Management of the River Niger Water Basin. Paper Presented at the National Water Monitoring Conference, San Jose: CA. |
| [14] | Dudley, R. (2013), Historical Groundwater Trends In Northern New England and Relations With Streamflow and Climatic Variables. Journal of the American Water Resources Association. 49:5. |
| [15] | Maupin, M. (2014). Estimated Use of Water In The United States in 2010. Circular 1405. Reston, Virginia: The USGS, US Department of the Interior. pp 1-52. |
| [16] | Dieter, C.A. (2018). Estimated Use of Water In The United States In 2015: U.S. Geological Survey Circular 1441. Reston, Virginia: The USGS, US Department of the Interior, p65. |
| [17] | Merem, E. C. (2023 April a). Analyzing Issues in Water Resource Management Within the US Northeast Zone. Paper Presented at The National Water Quality Monitoring Council Conference. Virginia Beach: Virginia, April 24 – 28. |
| [18] | National Wildlife Federation. (2008). More Variable and Uncertain Water Supply. Washington, DC: NWLF |
| [19] | Krajic, K. (2019). Scientists Find Huge Under sea Freshwater Aquifer. New York, NY: Columbia University, Earth Institute. |
| [20] | Merem, E.C. (2019). Assessing Water Resource Issues in the US Pacific Northwest Region. International Journal of Mining Engineering and Mineral Processing. 8:1-19. |
| [21] | Gavrilles, B. (2011). South-East US With Exception of Florida, Likely To Have Serious Water Scarcity Issues. Science. Trends In Applied Science Research. 6: 8: 947-948. |
| [22] | Mizuno, J. (2007). Potential Losses of Freshwater Re-sources in Coastal Aquifers Caused by Climate Change. Geographical Society of America Abstracts with Programs. 39: 431. |
| [23] | Alfonseca, K. (2022 September). Where Ongoing Water Crises Are Happening In the US Right Now. Retrieved 2023 March 28th From https://abcnews.go.com/US/map-ongoing-water-crises-happening-us-now/story?id=89454219 |
| [24] | Smithfield, R.I. (2023 June). The Rhode Island Department of Health is Recommending That Customers of the Greenville Water District Boil Their Water Before Using It. Greenville, RI: WPRI. |
| [25] | Town of North Attenborough (September of 2022). Boil Water Alert. North Attenborough: MA. |
| [26] | Chester County. (2023 July). Boil Water Alert For Customers In a Couple of Towns in Chester County. Chester: Pennsylvania, Chester County. |
| [27] | McIntyre, DA. (2020 b). These 6 American States Have Plenty of Water. Wall Street.Com Infrastructure. |
| [28] | Merem, E.C. (2021April). Appraising Issues In Water Resources Use Among Nations In the West African Region. Proceedings of the 12th National Monitoring Virtual Conference. Providence: Rhode Island. April 19, 2021. |
| [29] | The Berkey Blog (2020). Aging Water Infrastructure Issues In The United States; A Healthy River is a Community’s First Line of Defense, Ensuring Water Security. Retrieved 2023 March 28th From https://theberkey.com/blogs/water-filter/aging-water-infrastructure-issues-in-the-united-states. |
| [30] | Merem, E. C. (2021 February). Assessing Water Resource Management Issues In The US Midwest Region. Proceedings of The Virtual Conference of Minority Public Administrators (COMPA). Dallas: TX. February 25-28, 2021. |
| [31] | Merem, E.C. (2022 October). Assessing Water Resource Issues Along the US Northeast Region. Paper Presented at The JSU Fall Faculty Research Engagement Week Conference. Jackson: MS. October 25-27, 2022. |
| [32] | Merem, E.C. (2021, February). Assessing Water Resource Management Issues In The US Midwest Region. Paper Presented At Virtual Conference of Minority Public Administrators (COMPA). Dallas: TX. February 25-28, 2021. |
| [33] | Merem, E. C. (2023 March). Assessing Yam Land Use Trends In Nigeria’s Lower South Region. Paper Presented at the 31st Joint Conference of National Association of African American Studies (NAAAS). Arlington: TX. February 16-18, 2023. |
| [34] | Merem, E. C. (2023 March). Assessing The Potentials of Cotton Land Use In Sudan. Paper Presented at the Conference of Minority Public Administrators (COMPA). Baltimore: Maryland. March 2- 5, 2023. |
| [35] | Merem, E. C. (2023 March). The Environmental Impacts of Farm Subsidy in California’s South-Central Region. Paper Presented at the 32nd Annual International (West Coast) Conference on Soil, Water, Energy, and Air (AEHS). San Diego: CA. March 20-23, 2023. |
| [36] | Merem, E. C. (2016). The Geography of Wind Energy Use In the Mid-west Region of the U. S. Journal of Energy and Power. 6:1: 1-15. |
| [37] | Merem, E. C. (2023 March). Assessing Climate Change Impacts In The US Pacific North West Region. Presented at the 97th Annual Louisiana Academy of Science Conference. LSU Alexandria: LA. March 4th, 2023. |
| [38] | Merem, E.C. (2020 March). Assessing The Risks From Changing Climate In South Texas Region. Proceedings of The 94th Annual Meeting of The Louisiana Academy of Science (LASC). Louisiana State University. Alexandria: LA. March 14, 2020. |
| [39] | Merem, E. C. (2021). The Regional Assessment of Groundnut Farmland Use in Northern Nigeria. International Journal of Food Science and Nutrition Engineering, 11:1:1-19. |
| [40] | Merem, E.C. (2020 March). Assessing The Risks From Changing Climate In South Texas Region. Proceedings of The 94th Annual Meeting of The Louisiana Academy of Science (LASC). Louisiana State University. Alexandria: LA. March 14, 2020. |
| [41] | Merem, E. C. (2020 February). Analyzing the Use of Genetic Modified Organisms GMOs in US Agriculture In the Midwest Region. Proceedings of The 2020 Mississippi Political Science Conference (MPCC), Jackson: MS. February 2020. |
| [42] | Merem, E.C. (2020). Analyzing Organic Food Farming Trends in The US Western Region. Public Health Research. 10:2: 41-57. |
| [43] | United States Census Bureau (2020). US Census Quick Facts. Washington, DC: The United States Census Bureau |
| [44] | Merem, E. C. (2023 April b). Analyzing Issues in Water Resource Management Within the US Northeast Zone. Paper Presented at The National Water Quality Monitoring Council Conference. Virginia Beach: Virginia, April 24 – 28. |
| [45] | Merem, E. C. (2023 April c). Analyzing Issues in Water Resource Management Within the US Northeast Zone. Paper Presented at The National Water Quality Monitoring Council Conference abstract. Virginia Beach, Virginia: April 24 – 28. |
| [46] | Merem, E. C. (2023 July d). Analyzing Issues in Water Resource Management Within the US Northeast Zone. Unpublished Manuscript. Jackson, MS: Department of Urban and Regional Planning, Jackson State University. |
| [47] | United States Government. (1981 March). Water Resources Problems Affecting The Northeast: Drought and Present and Future Water Supply Problems. first session. Washington DC: House of Representatives, Ninety-seventh Congress. |
| [48] | USDA Forest Service. (2010). Climate Change and Water Issues for the Eastern US. Ashville, NC: Eastern Forest Center. |
| [49] | Barksdale, H. C. (1968). The Northeast Water Supply Crisis of the 1960's. Washington DC: NOAA, USDA Climate Hubs, USGS. |
| [50] | Water Rights Group. (2017 November). Common Regional Water Problems: Northeastern U.S. Washington DC: Water Rights Group. |
| [51] | USDA Northeast Climate Hub. (2020 November). Growing Season Ends But Drought Hangs On Across Much of the Northeast. USDA Northeast Climate Hub. |
| [52] | American Rivers. (2023). The Northeast. Washington, DC: American Rivers. |
| [53] | Merem, E.C. (2017). Analyzing Water Management Issues Using GIS: The Case of Nigeria. Geosciences. 7:1: 20. |
| [54] | Merem, E.C. (2021April). Appraising Issues In Water Resources Use Among Nations In the West African Region. Proceedings of The 12th National Monitoring Virtual Conference. Providence: RI. April 19, 2021. |
| [55] | Merem, E. C. (2018 February). Assessing Water Resource Issues In The US Pacific North West Region. Proceedings of The 2018 Mississippi Political Science Conference (MPCC), Jackson: MS. February 2018. |

 Abstract
 Reference
 Full-Text PDF
 Full-text HTML