E. C. Merem1, Y. A. Twumasi2, J. Wesley1, D. Olagbegi1, M. Crisler1, C. Romorno1, M. Alsarari1, P. Isokpehi1, A. Hines3, G. S. Ochai4, E. Nwagboso5, S. Fageir6, S. Leggett7
1Department of Urban and Regional Planning, Jackson State University, 101 Capitol Center, Jackson, MS, USA
2Department of Urban Forestry and Natural Resources, Southern University, Baton Rouge, LA, USA
3Department of Public Policy and Administration, Jackson State University, 101 Capitol Center, Jackson, MS, USA
4African Development Bank, AfDB, 101 BP 1387 Avenue Joseph Anoma, Abidjan, AB 1, Ivory Coast
5Department of Political Science, Jackson State University, 1400 John R. Lynch Street, Jackson, MS, USA
6Department of Criminal Justice and Sociology, Jackson State University, 1400 John R. Lynch Street, Jackson, MS, USA
7Department of Behavioral and Environmental Health, Jackson State University, 350 Woodrow Wilson, Jackson, MS, USA
Correspondence to: E. C. Merem, Department of Urban and Regional Planning, Jackson State University, 101 Capitol Center, Jackson, MS, USA.
| Email: |  |
Copyright © 2020 The Author(s). Published by Scientific & Academic Publishing.
This work is licensed under the Creative Commons Attribution International License (CC BY).
http://creativecommons.org/licenses/by/4.0/

Abstract
The US Southeast region is endowed with vast deposits of water resource assets located in numerous states. Considering the growing water use to serve rapidly expanding land uses from agriculture, residential areas, thermoelectric to industrial facilities. Over the years, the demand for water to meet the needs of various sectors in the zone has precipitated increased withdrawals, declining levels in aquifers and sectorial imbalance in the distribution. Accordingly, sectorial imbalance and stress attributed to socio-economic, physical and ecological parameters is now being felt in the areas many considered fully endowed with hydrological assets and less vulnerable to depletion. Beset by the management implications of the trends, various agencies in the zone have stepped up mitigation measures. Notwithstanding the gravity of the challenges and the fact that most studies are still festooned with projected depletion patterns in the US arid West, very little work exists in the literature on the changing patterns in water resource use in the Southeast region using a mix scale model. For that, this research will fill that void by assessing the variabilities in water resource use among some states in the Southeast. With emphasis on the issues, trends, factors, and impacts, the study uses secondary info from major data agencies analyzed by mix scale techniques of descriptive statistics and Geographic Information Systems (GIS) to assess the tendencies. The results point to changes in usage among the sectors in the form of gains and declines, the emergence of hydroelectricity and irrigation as the largest users, the dominance of Florida, regional dependence on surface water sources, evidence of depletion and spatial dispersion of these trends across the states. With these changes attributed to various elements, the paper offered suggestions ranging from water conservation measures, the adoption of efficient polices to the design of a regional hydrological information system.
Keywords:
South East, Water resources, GIS, Factors, Changes, Depletion, Sectors, Withdrawals
Cite this paper: E. C. Merem, Y. A. Twumasi, J. Wesley, D. Olagbegi, M. Crisler, C. Romorno, M. Alsarari, P. Isokpehi, A. Hines, G. S. Ochai, E. Nwagboso, S. Fageir, S. Leggett, Assessing Water Resource Issues Among States in the US South East Region, Marine Science, Vol. 8 No. 1, 2020, pp. 1-23. doi: 10.5923/j.ms.20200801.01.
1. Introduction
In the United States Southeast region, where there is a common myth of endless deposits of water assets considering its vast lakes, rivers and marshes and the primary aquifer spread across multiplicity of states and cities [1]. The area is endowed with vast deposits of water resource assets in the form of surface and ground water treasures [2]. Thus, in a nation in which water still stands out as vital asset essential to the sustenance of economic activities and carrying capacity of the environment. Virtually all critical aspects of daily activities in society rely heavily on steady water supply to function [3]. Because none of the key sectors of the economy beginning with agriculture, electric power, and industries in the Southeast can thrive without water [4,5]. Florida’s 6000 square miles of water as catalysts to the fiscal development of the state, sustains a robust fishery sector with over 400 processing facilities and 5000 jobs yearly [6]. Although water issues in the US Western region has long been the center of attention, however [7,8], apart from Florida in the water rich Southeast [9,10], several states in the zone lack the capability to meet their demands [11]. For that, many believe that as US water assets fluctuate, many communities risk recurrent exposures to deficits in the study area [12]. In the process, scarcities in water supply have gradually emerged as a regular concern in the Southeast region [13,14,15]. Accordingly, from the literature, water security in the Southeast face long standing uncertainty during the next couple of years. In the past, the zone benefited from unprecedented era of decent water accessibility situations that span through a period of four decades, but that has been overshadowed by the spectre of heavy droughts that struck in the previous years [16,12,17]. Realizing that hydrological stress was occasional and water stock bountiful. The threats from global warming dangers are projected to accentuate further dangers that will possibly trigger more extreme spells of aridity coupled with intense rain and storms [18,19]. In fact, the economic damages to the Southeast region’s farm sector from the 2007 dry season stood at over $1.3 billion for a variety of crops from wheat, soybeans, cotton, and hay. At the same time, wildfire incidents destroyed 600,000 acres in Georgia and Florida during that period [1,16]. In as much as the race over limited freshwater access intensified transboundary clashes among neighboring states, the flourishing biodiversity of the Southeast remains endangered [1,16]. Additionally, the resultant sea-level rise, and accelerated groundwater mining will magnify the menace of saline seepage into vital groundwater aquifers. While along these lines, fast population growth, irrigation, and power production amplified water use in the region among cities beginning in 1960 [1,16]. The zone boosts of 2 dozen counties in Georgia ranked among the top 100 in growth in the US that depend heavily on plentiful freshwater access. Increments in water consumption therein, have remained so visible that it overtook population surge over time [1,16]. Considering that, the probable addition of over 23 million people by 2030 will induce further strain on available water in the Southeast [20,21].From the extent of water usage amidst the pressures from climatic parameters and others. The water extraction activities from the 1995 to 2015, created notable imbalance among different sectors and the states that are worthy of research with Florida the biggest water user, and thermoelectric sector the dominant destination of extracted water state-wide followed by public and domestic users alongside irrigation [5,2,22]. Nevertheless, despite its standing as a moist region, the Southeast saw varying periods of dry and wet seasons dominated by exposures to flooding, severe aridity and declines in the amount of water supply. To that effect, in some places, nearby communities have endured common threats to potable water access [23], as result of saltwater intrusion into local water systems [1,17,14,24]. With time, some of the states in the region have also engaged in long term transboundary water conflicts over access with these parties accusing each other of misallocation towards domestic use and agriculture [25]. The case in point is the Tri State water conflicts between Alabama, Florida and Georgia with protracted intervention of the Supreme Courts for adjudication. However, the lengthy nature of these conflicts indicates the extent to which hydrological stress and water insecurity saddles wet areas usually thought to be heavily endowed with abundant water assets at every level [26,1,27,28,29,30]. Surely, each region and ecozones known for vast water availability have their challenges and the US South East zone is no exception [15,31]. With over 30 million residents in Florida, Alabama and Georgia at the crossroads of the Tri State water wars in the zone predicated on declining access [21]. The greater the quest for more water allocation to serve Atlanta and its surrounding metro areas, the smaller the supplies for other areas in the lower south who rely on the same river source. For that, potable water shortages not only pose serious dangers to state economies and growth projections, it dictates growth management. Under such settings, water destined to various sectors are bound to drop in the southeast region further beyond the shoreline areas. Considering that the area has always had water assets able to sustain variety of its sectors [31], notable places therein have been exposed to aridity, flooding, amidst projected growth and varying land uses expected to impose more constraints to water access [32]. Aside from the gravity of the challenges and the fact that most studies are still festooned with projected depletions in the US arid west [33,34,35], little work exists on the Southeast region using a mix scale model. This research will fill that void by assessing the changing water resource use in the zone with emphasis on the issues, trends, impacts, and factors using mix scale techniques of descriptive statistics and GIS to assess the tendencies [36,37,28,39,40,41]. For the purposes of analysis, the enquiry has five objectives. The first aim is to analyze the current issues in water resources management while the second assesses the risks of water depletion to the South Eastern region. The third objective evaluates water use and effects and the fourth objective identify associated factors and future lines of action. Whereas the fifth objective is to develop a decision support device for managers. The paper is divided into five portions made up of the first and second segments based on the introduction and an outline of the methodology. The third section contains the results, impacts and factors while section four focuses on the discussion of the findings and section five provides the closure of the research.
2. Methods and Materials
The Southeast region in Figure 1, with a population of 64 million people in 2018, and over 61 million in 2015 (Table 1) occupies a land area of 1,555,560 km2 [42]. The zone extends through wide ranging land types beginning in the Appalachian Mountains on to the rapidly growing coastal grasslands. Many of the states in the zone not only lay along the Gulf of Mexico ecozone and the Atlantic seaboard under tens of thousands of kilometers of shoreline [43]. The region’s flourishing high-volume marshes on the Gulf Coast and imposing longleaf pine woodland in the coastal plains alongside the rhododendron bush landscapes on the lower tip of the Appalachians remain visible [17]. Being a wet region with vast array of biodiversity as part of the natural systems, the Southeast boasts of varied tapestry of some of the rarest ecosystems in the globe. Aside the fact that just only limited places on earth contain such assets, biodiversity habitats therein are still endangered from inadequate stream flows prompted by water usage and diversions. The most amazing thing in the study area involves the pristine nature of its freshwater surroundings and the abundance of hidden life forms they host, such as diverse stream fishes, river mussels, crayfish and salamanders that are the largest in the world. Even though encroachments via modifications to the Southeast waterfronts through the building of dams, channelization, contamination and water extraction threaten these marine organisms. The region contains over 70% of the US endangered fish species rarely available elsewhere in the globe but mostly around the Tennessee-Cumberland River, and Mobile River basins [17]. 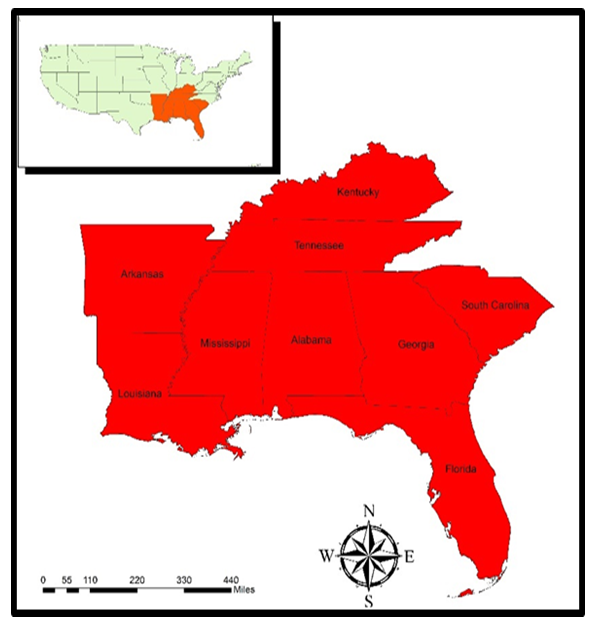 | Figure 1. The Study Area, US South East Region |
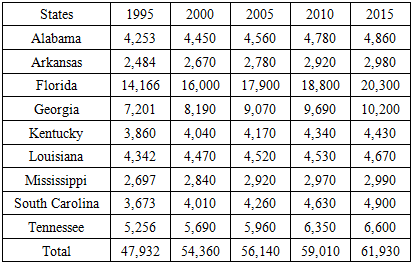
Table 1. The Population of the Study Area 1995-2015
 |
| |
|
In a zone where almost every one of the settlements are adjacent to a water course, millions of people rely heavily on surface water sources like rivers to meet potable water needs [44]. Based on geology of the area, amongst the bigger marshes in the Southeast region, one must consider the Everglades in Southern Florida as well as the Okefenokee Swamp in Georgia also. For that, the streams and river systems stand as the main life support sustaining the bigger cities of the region made up of Atlanta, Charleston, Knoxville and Chattanooga [45]. Being a largely populated area with many living in cities ranging from Jacksonville, Atlanta, Miami, to New Orleans, the zone consumed a total of over 300,000 mlgd of water from 1995 to 2015. In lieu of water essence and the pace of ongoing population increments in cities, it has become far more essential than before to conserve and evaluate the region’s water assets [17].Seeing that the entire Southeast states ground water accounts for half of the country’s potable water, the Floridan aquifer system remains an essential network of hydrological structure and a major aquifer of the US and among the most productive globally (Figure 1.1). Covering close to an estimated area of 258,998 km2 in the Southeast region along the entire state of Florida, parts of Alabama, Mississippi, and South Carolina. The Floridan aquifer network which is classified as the number three in the country amongst groundwater sources for municipal stock distribution, based on the 1,300 mlgd extracted each day in 2000 fiscal year, also serves as a key provider of irrigation water. Given that subterranean water removals through the aquifer grew regularly by 630 mlgd from 1950 to 3,3430 mlgd by 1990. Since the permitting process and tougher regulations instituted in the 1990s shortened the rising extractions, the taking away of water rose to 4020 mlgd because of the dangerous levels of aridity in the entire Southeast region in 1999 and 2001 [46,47]. In that light, much of the hydrological stress at that time, emerged as result of mounting demands from the region’s farm sector. With rainfall events as the major source of water for the Floridian Aquifer system (FAS) and in the Southeast, precipitation levels in the later stands at around 53 inches annually, and about 48 to 64 inches throughout the FAS. See Figure 1.1 for more on the major aquifers in the study area. As the changing climatic parameters is triggering rising temperature at scales that undermine water availability and access in the study area. The coastline counties of the Southeast region face global warming and threats of sea level rise and saltwater overflow. Considering that since 1970, the mean yearly temperatures in the study area rose by around 2oF, the incidence of sea level rise now has the potential to fuel rising storm levels and surge that fuel seawater seepage into creeks and coastal marshes [48,49]. Thus, increasing temperatures and widespread needs for water among the states pose serious stress on access to water resources in a manner likely to impede hydrological security [50,51,52,53,54]. All in all, while the South east region has over the years enough water assets able to sustain the communities, many areas in the zone have seen droughts and projected population increases and land use changes that will compound water access considerably now and in future.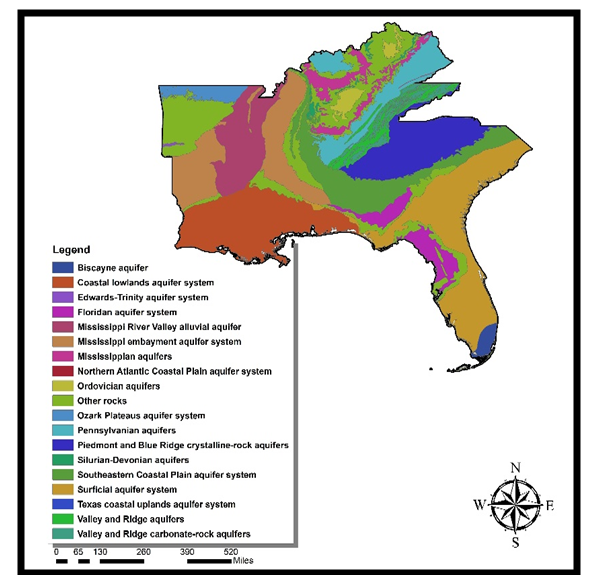 | Figure 1.1. Aquifers of the South East Region |
2.1. Method Used
The paper adopts a mix scale method consisting descriptive statistics and secondary data connected to GIS to evaluate the water resources issues in the South east region of the United States. The spatial information for the enquiry was obtained from numerous entities consisting of the United States Geological Survey (USGS), The United States Department of Agriculture (USDA), the United States Department of Interior, United States General Accounting Office (GAO), and the National Hydropower Association. Additional geospatial data came through the National Oceanic Atmospheric Administration (NOAA), the South Florida Water Management District, the US Army Corps of Engineers, American Institute of hydrology, National Aeronautical and Space Administration (NASA), Mississippi Automated Resources Information System (MARIS), The state of Florida and American Rivers. In addition to that, the US Census Bureau, Louisiana (SONORIS) Strategic Online Natural Resources Information System Interactive GIS Maps system and Acc Weather Inc, Stanford Water, The Tennessee Valley Authority, The World Health Organization, Nature Conservancy, University of Florida Hydrology Laboratory, the archives of regional and state Water Quality Boards and US Water partnership, did also offer other information as required in the enquiry. Largely, much of the water use variables made up of domestic, public supplies, agricultural, thermoelectric and industry withdrawals pertinent to the zone collectively and the individual states emerged from the repositories of Southeast authorities, the USGS Water sciences centers, Georgia Department of Natural Resources and Earth Justice. On the one hand, the Georgia Environmental Protection Division, Southern Environmental Law Center, Louisiana Departments of Transport and Development, Environment, and Natural Resources, Georgia water alliance and Georgia Environmental Finance authority provided the additional secondary data on the numbers, hydrological profile, quantities, trends, deficits in water budget and the categories. On the other, the City of Fulton, the state of Florida, American Rivers, Louisiana water Resources Research institute, Lower Mississippi Gulf Water Science Center, The National Hydropower Association, Northwest Florida Water Management, District, South Carolina Rural Water Association, Beaufort and Japsper Water and Sewer Authority, US Fish and Wildlife and NOAA offered vital info to complement the time series data and other valuable information on hydrological assets on the major surface and ground water budgets highlighting the region. For additional data needs, the United States Environmental Protection Agency (EPA), Natural Resources Conservation Services (NRCS), The Kentucky Water Resources Research Institute, and Northern Kentucky water district, were respectively critical in the procurement of information on the number of usages, and physical data highlighting withdrawal, changes and the consumption. In a similar vein, the Florida Department of Water Resources Management, Environmental Protection, Greenville Water Commission, TN, the USDA National Agricultural Library, Water and Agricultural Information Center, Mississippi Department of Environmental Quality, Pearl River and Yazoo River Watershed Management Authorities remained instrumental in the provision of other relevant regional hydrological information. Give that regional and state, county and federal geographic identifier codes of the states were used to geo-code the info contained in the data sets. This information was processed and analyzed with basic descriptive statistics, and GIS with attention paid to the temporal-spatial trends at the state and regional levels in the US South East zone.
2.2. Stage 1: Identification of Variables, Data Gathering and Study Design
The initial step in this research involved the identification of variables required to analyze the extent of consumption or extraction and variations at the state and regional levels from 1995 to 2015. The elements encompass socio-economic and environmental information including groundwater, surface water, total withdrawals, ground water percentage of total, surface water percentage of total, variations in water depletion level, drought index and changes in ground water level. The others consist of total ground water depletion, water withdrawals by category, public supply, domestic water, irrigation, livestock, industrial, mining, thermoelectric power and percentage of population dependent on ground water variations. Added to that are the daily use of ground water, population and percentage changes in state population, total water uses by category, and sources, percentage of change, ground water total, ground water average, total withdrawal of water by source and state, water withdrawal by category, self-supplied industrials, volume of water declines and water volume increment. There were also water pollution patterns, lead (pb) in water, corrosive ground water, ground water depth, corrosivity index, drought or water shortage index. These variables as mentioned earlier were derived from secondary sources made up of government documents, newsletters and other documents from NGOs. This process was followed by the design of data matrices for socio-economic and land use (environmental) variables covering the census periods from 1995, 2005 to 2010 to 2015. The design of spatial data for the GIS analysis required the delineation of county and state boundary lines within the study area as well. Since the authorized boundary lines amongst the nine states stayed unchanged, a common geographic identifier code was assigned to each of the area units for analytical coherency.
2.3. Stage 2: Data Analysis and GIS Mapping
In the second stage, descriptive statistics and spatial analysis were employed to transform the original socio-economic and ecological data into relative measures (percentages, ratios and rates). This process generated the parameters for establishing, the extent of water consumption, withdrawals, depletion, the populations served, the categories served, the sources of water extracted and the depletion of water types precipitated by over use of water and the trends across the South eastern region for each of the nine states through measurement and comparisons overtime. While the spatial units of analysis consist of states, regions, shorelines, and counties and the boundary and locations where the over extraction of surface and ground water thrived, this framework ensures the identification of change. While the tables underscore the actual frequency and impacts, water depletion and the intensity of consumption and the trends coupled with the environmental and fiscal costs. The remaining steps involve spatial analysis and output (maps-tables-text) covering the study period, using Arc GIS 10.4 and SPSS 20.0. With spatial units of analysis covered in the nine states (Figure 1), the study area map indicates boundary limits of the units and their geographic locations. The outputs for each state were not only mapped and compared across time, but the geographic data for the units which covered boundaries, also includes ecological data of land cover files and paper and digital maps from 1995-2019. This process helped show the spatial evolution of location of various levels of usage, and the trends, the ensuing socio-economic and environmental impacts, ecological degradation as well as changes in other variables and factors driving the depletion of water and the impacts in the study area.
3. The Results
This section of the paper focuses on temporal and spatial profile of water resource trends in the study area among various sectors and categories. There is an initial focus on the evaluation of water use between the states based on descriptive statistics, assessment of depletion and the regional changes in water usage. The other parts stress the impacts of usage in the various states and the zone. This is followed by GIS mappings and the factors linked to the water stress.
3.1. Water Resources Use in the Nine States 1995-2015
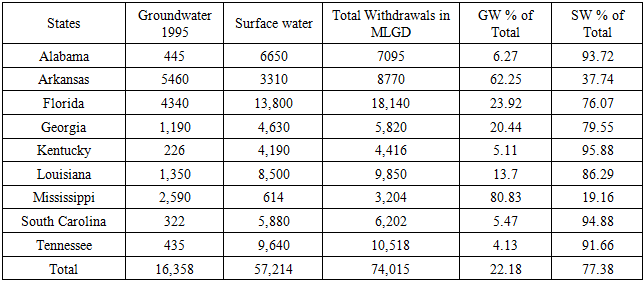
Of the combined totals of the 74,015 mlgd in ground and surface water of the study area during the fiscal year 1995. Three states Florida, Louisiana and Tennessee with total values 18,140 mlgd, 9850 mlgd to 10,518 mlgd surpassed the rest of the states in the region individually as they were engaged in more water pumpage activities than the others. Among the individual group of states, the distribution of both water categories in 1995 shows the values for Alabama began at 445 to 6650 mlgd, while Arkansas held on to 5460 to 3310 mlgd. Florida on the other hand started with 4340 mlgd in ground water during the 1995 period only to see its surface water climb to 13,800 mlgd. In the case of a trio of other states most notably Georgia, Kentucky and Louisiana, these sates extracted sizable volumes of water (1190- 4630 mlgd) while Kentucky on its part settled for only 226 mlgd in ground water as a non-coastal area, but only to gulp more quantities (4190 mlgd) in surface water. That is unlike Louisiana where both ground and surface water use were valued at 1350 mlgd to 8500 mlgd. Interestingly, the trends in Mississippi showed the state took out about 2,590 mlgd in ground water compared to 614 mlgd in surface water and during the same period, the reverse emerges in South Carolina where the distribution of both water types stood at 322 mlgd to 5880 mlgd respectively. In a similar vein, Tennessee withdrew 435 to 9640 mlgd of the same resources. The total water usage indicates a slightly identical volumes of 7095-8700 mlgd between Arkansas and Alabama. The same goes for Georgia and Kentucky where total water withdrawals among these other two states stood at 5820 mlgd to 4416 mlgd. This seems different from the gaps in the Mississippi and South Carolina areas where the overall amount of extracted water ranged from 3204 mlgd to 6202 mlgd. On the percentage of both water types as the proportion in the total going by the available data. The study area is heavily dependent on surface water. Except for Arkansas and Mississippi where much of the extracted water comes from underground sources, the remaining areas from Alabama to Tennessee had surface water extraction rates of 93.72 to 91.10%. In that case, the region during the 1995 period also saw a ground water versus surface water ratio of 77.38% 22.18% (Table 2). Table 2. Total Withdrawals by Source and State 1995 in MLGD
 |
| |
|
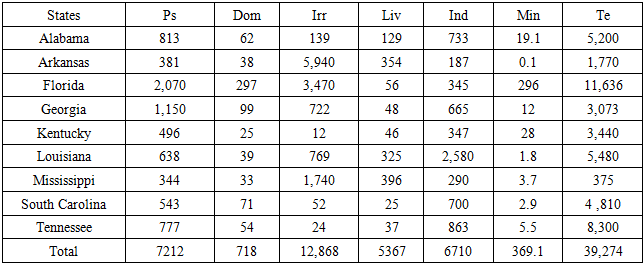
Looking at the category of consumers in 1995 among the states, Florida led the rest of the states as the dominant user of water. This stems from the extraction of water destined to different sectors made up of publics and domestic, irrigation, mining, thermoelectric power or hydroelectricity in the land use of the 9 South East states. Being the leading consumer of water in the year and the largest in terms of population, the state’s usage levels went from 2007-297 mlgd and 3470 mlgd in the amount of public supply, domestic, and irrigation. Even though water extraction for livestock and industrial stood at current levels of 56-345 mlgd, it accounted for the largest water use in the areas of mining and hydroelectricity with 296-11,636 mlgd volume of water consumed in the sectors. Going by the high distribution of water volumes in 3-7 categories, Louisiana held on to its position in water use in the industrial, livestock sectors, and as key extractor of water destined to hydroelectric power during the fiscal year. The state had sizable volumes of water estimated at 2580 to 5480 mlgd in both industrial and thermoelectric power. The activities in the area of domestic and public water supply amounted to 638 mlgd, and in the same time span, the state’s water for irrigation and mining industry usage stood at 709-1.8 mlgd respectively. In the case of the others, especially Arkansas and Alabama, the later used up 813-62 to 139-129 mlgd for public and domestic needs, irrigation activities and livestock. Aside from the 733-19.1 mlgd in water furnished to industry and the mining sector, Alabama stills stands out in the class of major users of water with 5200 mlgd to sustain thermoelectric operations in the 1995 fiscal year while irrigation water use of about 5940 mlgd in Arkansas exceeded the levels for the other states during the same period. In the other areas, sectorial demands from livestock and industry consumed 354-187 mlgd while the power and utilities sector again pumped 1770 mlgd. Being one of the largest economies in the zone, Georgia used up appreciable portions of hydrological assets (1150 mlgd to 99 mlgd, 722 mlgd), directed at series of sectors particularly publics, domestic, and agricultural side of irrigation. Consistent with the water needs in the state are (48-12 and 665, 3073 mlgd) demands from livestock, industries, and mining and thermoelectric therein that continued in the same fashion. Kentucky on the other side, saw unbalanced withdrawal levels in usage (496-25 and 12-46 mlgd) tied to the public area, domestics and irrigation sprinkling and livestock. In the heavy industrial sectors, mining and hydro power fluctuated notably (by 347- 28, 3440 mlgd). The situation in the remaining coastal states of Mississippi and South Carolina differs slightly as community and household usage levels of water stood at 344 mlgd to 543 and 33 -71 mlgd. Whereas Mississippi an agricultural state dominated in irrigation and livestock by 1740 to 52 mlgd and 396-25 mlgd, South Carolina’s heavy consumption levels (700-290 and 4,810-375 mlgd) in industry and the power sector stayed visible. Also, in Tennessee, there exists notable distribution of water (8300,863,777 mlgd) to hydro, industrial and public destinations in comparison to meagre levels in domestic, irrigation and mining sectors in the state water uses (Table 2.1).Table 2.1. Total Withdrawals by Water Use Category 1995 in MLGD
 |
| |
|
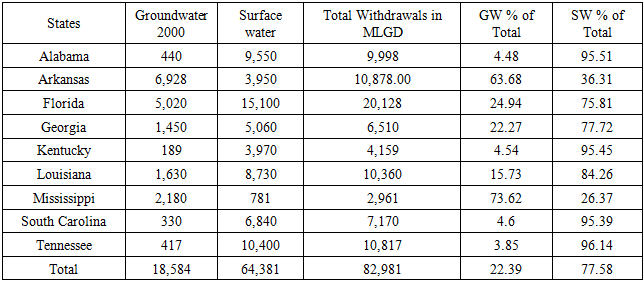
One of the things that stood out within the study area during the fiscal year 2000 in overall water use stems from the superior withdrawal levels of Florida in all the phases when compared to the others. Beginning with ground water, with Florida as second to only Arkansas whose usage stood at 6928 mlgd, the former consumed 5020 mlgd. The closest state to these two, Mississippi known for its dependence on ground sources extracted 2180 mlgd during the same period. The other group of states with ground water consumption volume in the lower thousands (1450-1630 mlgd) consisted of Georgia and Louisiana on the region’s coastal plain. The trio of other states (Alabama, Tennessee and South Carolina) whose ground water use stayed at identical levels (440, 417-330 mlgd) surpassed the state of Kentucky where the resource remained minuscule. Except for Mississippi that consumed under 781 mlgd in surface water, being a coastal region, surface water extraction among the remaining 8 states ranged from over 15,000 to 3000 plus mlgd with the top 3 users (Florida, Tennessee, Alabama) exhibiting overwhelming dominance in consumption estimated at 15,100 mlgd, 10,400 mlgd to 9550 mlgd while Louisiana and South Carolina edged closer in usage with 8730 mlgd to 6840 in the 2000 fiscal year. Furthermore, in the mix among these groups, are the 3 states of Georgia, Arkansas and Kentucky that used up over 5000 mlgd to 3000 mlgd plus in surface water. With Florida the undisputed number one in total water withdrawal again with 20,128 mlgd. The neighboring states of Arkansas, Louisiana and Tennessee appeared tied in second place with identical totals of over 10,000 mlgd. In as much as South Carolina and Georgia had slightly identical totals of 6510 mlgd to 7170 mlgd, Kentucky and Mississippi’s totals in water use stood at over 4159 mlgd to 2961 mlgd. Since Mississippi and Arkansas shared ground water percentage totals of 63.68%-73-62% with surface water use ratios of 36.3-26.37% versus the other states. Again, the South East region remains a surface water dependent region with 4 states’ levels of use put at the rate of 95% while in a trio of others, stream water availability amounted to 75-84% of water use. This comes in the face of 82,981 mlgd in total water use for the region at a ratio of 18,584 mlgd to 64,381 mlgd between ground and surface water at a percentage level of 22.39% to 77.58% (Table 3).Table 3. Total Withdrawals by Source and State 2000 in MLGD
 |
| |
|
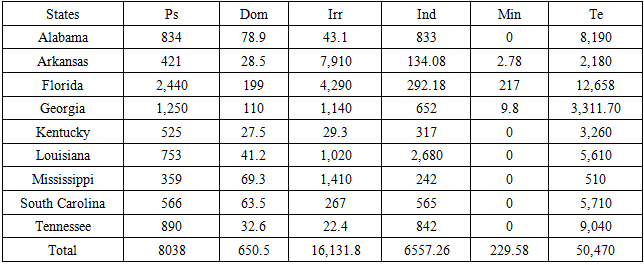
Aside from the dominance of Florida in the total amount in water use categories in the fiscal year 2000. Of all these components, thermoelectric water extraction remains the biggest water user in the Southeast followed by irrigation, public water and industrial sector while mining emerged as the lowest user regionwide. Among the individual states, both public and domestic water distribution (2440-199 mlgd) in Florida remained large compared to other states in the region during the fiscal year 2000 coupled with the huge irrigation water use of 4290 mlgd. Considering a much lower water use level of 292.18 mlgd for the industrial sector, the water extraction values of 217-12,658 mlgd in both mining and the thermoelectric sector stands as the highest in the southeast region. In Alabama and Arkansas, where water usage differed markedly by 834-421 mlgd under the community or public sphere, domestic extraction therein stayed at 78.9- to 28.5 mlgd individually among the two states. Except for irrigation and mining under which Arkansas withdrew about 7910 mlgd -2.78 mlgd, Alabama consumed 833 mlgd -8190 mlgd to meet water needs in industry and hydroelectricity and ranks as the 3rd largest user of water in the power sector. In as much as Georgia stands as a bigger player in the two water source categories through the distribution of 1250-110 mlgd, in other areas in the state, both irrigation and industry used up 1140 mlgd-652 mlgd. In the same fiscal year, mining and thermoelectric activities resulted in the diversion of 9.8-3311.70 mlgd volumes of water. Even though Kentucky used up 525 mlgd in public water, domestic and irrigation water use reached identical levels (27.5-29.3 mlgd) coupled with industrial and hydroelectric use measured at 317-3260 mlgd while the prominence of Louisiana stayed visible by the vast amount (753-41.2 mlgd and 1,002 mlgd -2680 mlgd) devoted to community, irrigation and industry with over 5600 mlgd in the power sector. The distribution based on all categories are also worthy of note with Tennessee as the third largest user in public, industrial and power category while the other three states Mississippi, Louisiana and South Carolina remained important users of water as well (Table 3.1). Table 3.1. Total Withdrawals by Water Use Category 2000 in MLGD
 |
| |
|
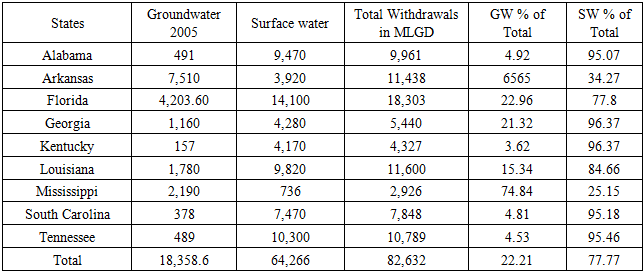
With a total of 82,632 mlgd in water resources in 2005, both ground and surface water stayed at 18,358 to 64,266 mlgd. As the top users of water spread from Florida, Louisiana to Arkansas, Florida with a total of 18,303 mlgd in water outtake outpaced the next two states where consumption levels reached over 11,000 mlgd. The other two states, (Tennessee and Alabama, that occupied the fourth and fifth position withdrew more water volumes of 10,789 mlgd to 9,961 mlgd) than the other next states in the ranking (South Carolina, and Georgia) whose usage levels ranged from 7,000 mlgd plus to 5,440 mlgd. Both Kentucky and Mississippi with 4327 mlgd-2926 mlgd finished below the other states in ranking in the Southeast region. On the top tier of the states beginning with Florida, ground and surface water use were in the order of 4,203.60 to 14,100 mlgd, Arkansas as the largest user of ground water with 7510 mlgd saw that number drop to 3920 mlgd in surface water consumption as Louisiana’s water sources went from 1,780 to 9820 mlgd. Tennessee and Alabama in the next order of the ranking had relative usage levels of 491-9470 mlgd to 489 mlgd-10,300 mlgd that exceeded those of South Carolina estimated at 378-7407 mlgd. See also that during the same period, Georgia and Kentucky had disparate ground water use levels of 1160-157 mlgd, but slightly contained surface water of the same levels (4280-4170 mlgd). The reverse comes in Mississippi with 2190 mlgd to 736 mlgd in the different water sources in 2005 (Table 4). Table 4. Total Withdrawals by Source and State 2005 in MLGD
 |
| |
|
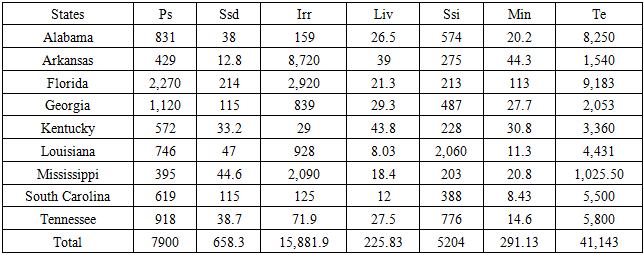
In the 2005 period again, among the extraction activities under various classes, thermoelectric, irrigation, and public water supply (50,673, 15,230.9,8133 mlgd) emerged as the major users with the largest withdrawals. This came at levels higher than domestic, livestock, industrial and mining. During that period, Florida once again showed its dominance in the thermoelectric and community supply and domestic use with 12,058 mlgd-2540 mlgd to 190 mlgd as well as 195 mlgd in the mining sector. Elsewhere in other sectors, Florida’s water pumpage directed at irrigation, livestock and industry (3070 mlgd, 17.8 mlgd,-244.19 mlgd) in that period remained substantially enough. In the ranking, Alabama and Tennessee withdrew a total of over 8000 mlgd for thermoelectric activities and identical volumes in (802,914, to 39.1 -36.7 mlgd) in both public and domestic water followed by somewhat similar values in mining and livestock water use. Aside from the visible differences between Georgia and Kentucky in which Kentucky used up more water for livestock (45.9 mlgd), Arkansas held on as the largest user of irrigation water at 8530 mlgd with sizable use of 38.8 mlgd for livestock. The two other states Louisiana and South Carolina stood firm as the next group with higher thermoelectric water withdrawals levels of over 6000 mlgd. The former exceeded South Carolina in industrial and mining water use by 3110-177.9 to 419 mlgd. Added to that, Mississippi’s 1560 mlgd in irrigation water stayed third on the ranking (Table 4.1).Table 4.1. Total Withdrawals by Water Use Category 2005 in MLGD
 |
| |
|
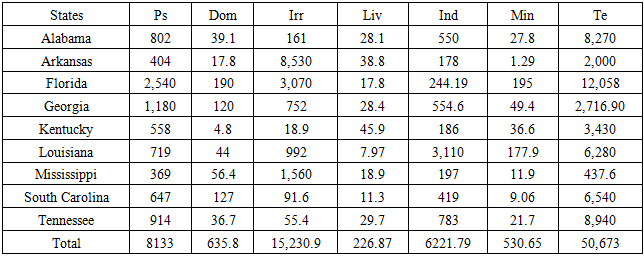
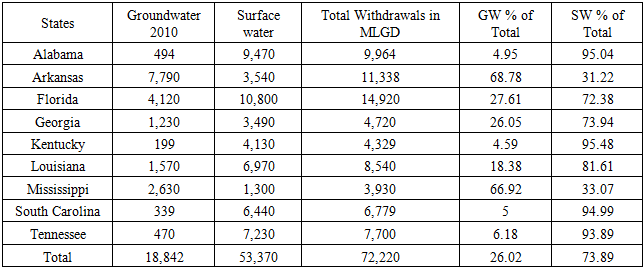
Bearing in mind the lowly levels of water distribution for the 2010 fiscal year. Ground water and surface levels for the southeast region stayed at 18,842 to 53,370 mlgd on a rate of 26.02% with a total of 72,220 mlgd in water extraction among the entire nine states. At the individual state level, Florida as the leading consumer in the region, accounted for a total of 14,920 mlgd down from the previous years. Out of the consumption totals, for Florida the surface and ground water use levels were in the order of 41,20 to 10,800 mlgd. In the case of Alabama and Arkansas, audits of both sources for the former reached 494-9470 mlgd-7790-3540 mlgd. This is followed by a total of 9000 plus to over 11,000 mlgd in water withdrawal for both states. Louisiana and Tennessee with overall water use (8540-7700 mlgd) during the year 2010, diverted notable volumes of water from sources as well. Within similar margins in place, at a total of 6779 mlgd, ground water and surface water in South Carolina vacillated from 399-6440 mlgd while Georgia and Kentucky held identical volumes in extracted water. In terms of Mississippi, out of the state total water values of 3930 mlgd, ground and surface water distribution ratio of both sources stood at 2630-1300 mlgd. In terms of the prevailing levels of ground and surface water usage therein, only two states, Arkansas and Mississippi relied more on ground water (at the rate of 68,78-66.92%) as 7 of 9 states from Alabama to Tennessee in the region drew more of their water from surface sources (Table 5).Table 5. Total Withdrawals by Source and State 2010 in MLGD
 |
| |
|
Interestingly again in 2010, the withdrawals by water consuming groups signalled some drops among the main indicators especially thermoelectric, irrigation, and public supply (at 41,143, 15,888.19 mlgd, 7900 mlgd), even though the figures were slightly lower than in 2005. During that year, hydrological indicators for 7 different variables showed Florida as the leading state, as it allotted vast quantities of water (9183, 2270, 214 -2,920-113mlgd) in different areas from electric power to public supply, irrigation, and mining. Furthermore, one need not overlook also Florida’s other water extraction activities (21.3-213 mlgd) devoted to livestock and industry. Among the other selected group of states, Alabama takes center stage with the diversion of 8250 mlgd for electricity, coupled with additional uses (831,38,26.5,374,20.2mlgd) directed towards the needs of the public sector and private users, as well as mining and industries. Note also that South Carolina and Tennessee with over 5000 mlgd in the power sector saw more use of water in service to communities and household residents based on the various levels in use (619-115,918-38.7 mlgd) coupled with notable usages (388-776 mlgd) in the industrial sector. Said that, the distribution levels for Arkansas and Mississippi shows irrigation gulped 8720-2090 mlgd and Georgia saw 2053 mlgd-1120 mlgd diverted to the power sector and public water use known for its importance to the economy of the state. Louisiana’s use patterns of 4431 mlgd to 2060 mlgd in thermoelectric and self-supplied industry are quite notable coupled with the distribution activities (746-47-928 mlgd) directed to the public, domestic and irrigation sectors of the state (Table 5.1).Table 5.1. Total Withdrawals by Water Use Category 2010 in MLGD
 |
| |
|
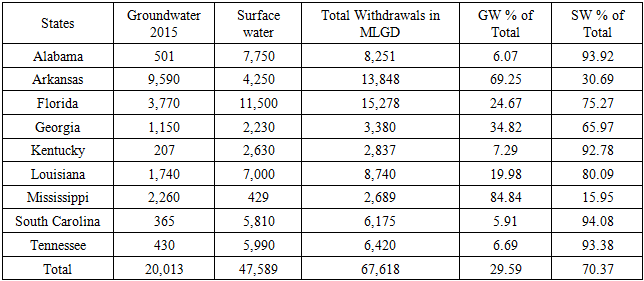
Under the 2015 display of hydrological parameters of the southeast region among the states, out of the total of 67,618 mlgd in extracted water, both ground water and surface water for the region ranged from 20,013 mlgd to 47,589 mlgd. Of the total distribution among the states, Florida’s overall volume (of 15,278 mlgd) as the highest in 4 or 5 consecutive years involves both ground and surface water estimated at 3770 mlgd-11,500 mlgd. Also, Arkansas stood out as the 2nd largest consumer at 13,848 mlgd of these totals for the state’s volume of both sources while a breakdown of the totals for both sources were 9590 -4250 mlgd. In the other places with respect to the total water use, both Alabama and Louisiana finished with over 8,000 mlgd, the distribution of the trends in that fiscal year reveals varying splits of 501-1,740 mlgd to 7,750 mlgd -7000 mlgd in consumption levels of ground and surface water among the two states. Under the 4th and 5th tier of states as it relates to water distribution, South Carolina and Tennessee outpaced Georgia, Kentucky and Mississippi in the 2015 fiscal year. During that period, South Carolina and Tennessee averaged over 6000- mlgd in total water extracted with identical levels in ground water and surface water distribution of over 5000 mlgd and 365 to 430 mlgd. With Mississippi and Kentucky at similar levels of over 2000 mlgd in total water usage, Georgia extracted over 3000 mlgd at levels bigger than the previous two states (Table 6).Table 6. Total Withdrawals by Source and State 2015 in MLGD
 |
| |
|
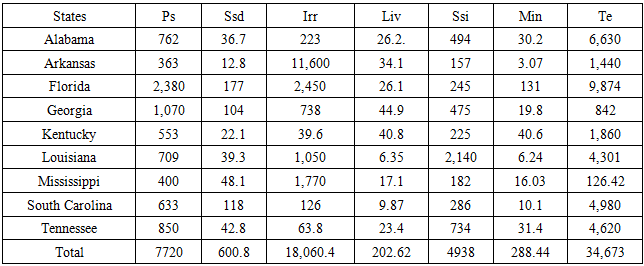
As we have seen again before in the 2015 fiscal year, the distribution of water use in the multiplicity of categories in the Southeast again reaffirms the prevalence of a trio of sectors (thermoelectric, public supply and irrigation). With the accrued volume of these big users of water at 34,673 mlgd-18,060 mlgd-7720 mlgd followed by industrial water use of 4938 mlgd. Among the states, Florida is still quite higher in consecutive consumption figures in several sets of hydrological indicators beginning with thermoelectric, public and domestic water use, irrigation, and mining. In these categories, the state gulped notable quantities of water to the tune of (9874 mlgd-2380 mlgd and 177 mlgd - 2450 mlgd to 131 mlgd) that are quite significant. Alabama in the second position with 6000 mlgd plus in hydroelectricity usage, did take up 30.2 mlgd in mining followed by 762 to 36.7 mlgd in public and domestic water while the use levels for industry and livestock stood at 494-26.2 together with the 223 mlgd devoted to irrigation sprinkling. The trio of other states such as Louisiana, South Carolina and Tennessee had opening values of over 4000 mldg devoted to the power sector. Of these states, Louisiana appeared the most active user of irrigation water and industrial water valued at 2140 mlgd to 1,050 mlgd. The other notable categories of importance among these states involves public and domestic water usage, mining, and industry where consumption levels were in the order of 709-633 to 850 mlgd in domestic water usage. The fifth and lower tier states of Kentucky and Mississippi adds another dimension to the analysis especially in the power sector where the Blue grass state gulped 1860 mlgd compared to 126.42 mlgd for the former. During the same year, Mississippi’s irrigation water volume of 1770 mlgd surpassed many states (Table 6.1). Table 6.1. Total Withdrawals by Water Use Category 2015 in MLGD
 |
| |
|
3.2. Changes in Water Use 1995-2015
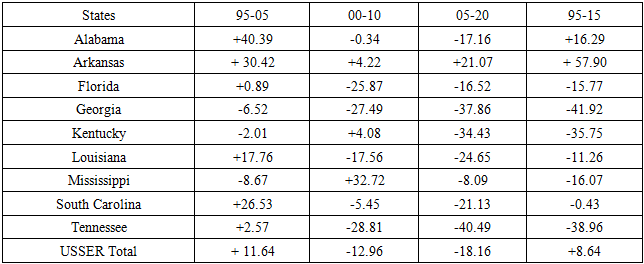
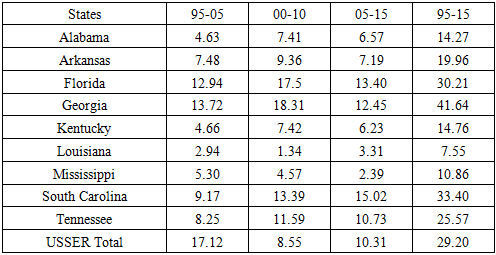
In terms of the actual changes that occurred, the study area’s main total of 389,466 mlgd averaged 76,093 mlgd all through 1995 to 2015. For that, the zone had 75,015 mlgd in 1995 and that number grew to 82,981 mlgd in 2000 but only to drop to 82,632 mlgd in 2005. With time in 2010, the total volume of water extracted fell from 72,220 to 67,718 mlgd. Along these lines, the percentage levels of changes point to gains of 10.6% by 1995 through 2000 followed by drops of -12.6% to -9.8% between 2005-2010 and 1995-2015. Note also that the percentage rates of consumption of water for 2000-2005-2010 at over 21%, stood out as the period of the highest water extraction compared to 1995-2010 levels of 19.71% to 18.98%, while 2015 at 17.7% remains the lowest point and year in usage in the study area. In the context of percentages of change in total water resources consumption across the states all through the southeast region, of all the states in the zone by 1995-2015, only 2 (Alabama and Arkansas) saw gains of 16.29% to 57.90% out of the entire 9. Even though some of the states during the years, experienced a mix of gains and declines, Arkansas emerged as the most consistent with back to back increments in the periods 1995-2005, 2000-2010, 2005-2015 than the other states. Pertaining to the double digit drops in 1995 to 2015 in the rates of usage, Georgia, accounted for the largest drop off estimated at 41.92% as the neighboring states of Kentucky and Tennessee incurred declines that were indicative of higher losses in consumption by 38.9%-35.75%. Florida and Mississippi on the other side, also saw declines of 15.77% to 16.07%. Of the remaining states, Louisiana and South Carolina also posted declines of 11.26% to 0.43%. Based on the foregoing trends, except for Alabama and Arkansas, water declines were across the board among the states in the study area with some of the rates at high double-digit levels between 1995-2015. So, based on the information, the same can be said of some years under analysis that the states in a moist region like the US Southeast region do have water use issues. At those rates, the study area consumed about a total of over 300,000 or 379,466 mlgd of water between 1995 through 2015 (Table 7).Table 7. Total Percentage Changes In Water Extraction By States 1995-2015
 |
| |
|
3.3. The Impacts of Water Use Issues in the South East
The degree of water resources stress in the past years in the US Southeast region precipitated stern effects that have been felt in various places in the study area. Just as these repercussions remain evident in varying forms among the states. The water use problems in the zone did have notable implications predicated on declines and interstate disputes, political-economic and ecosystem fallouts that reverberated across the area.
3.3.1. Water Declines Amidst Interstate Disputes
Water shortfalls as experienced in the zone increases the burden to allocate to all areas in urgent need amidst ecological and communal challenges. In the process, the study area has been clearly embroiled in those problems considering the threats of water shortages and the transboundary disputes over allocation among the states in the past years. With the capacity of the states to divert water from one place to the another for the areas in need now under challenge. Essentially, water allocations occur with undesirable stressors like contaminants, nutrient loads and sediments or residues. In those settings, there is a probability of temperature and turbidity increments in the river system at the other end during the transfer process that can limit quality elsewhere. More so, in the last couple of decades, the region had seen escalations and legal fights in courts over a Tri state water war involving Florida, Alabama and Georgia due to the jurisdiction to control water flow from the Apalachicola-Chattahoochee Flint River basins waters [25,26]. Georgia on its part sought to hold water flow from Lake Lanier for distribution to over 3 million residents in the Atlanta metropolis [1,16]. However, Alabama also needed substantial water flow onto the Chattahoochee River to drift barges, cool off the temperature of Farley nuclear facility in Dothan and to sustain fishing activities. Florida’s claims for additional water distribution along the Apalachicola River, centres on a desire to protect a trio of endangered creatures in line with federal guidelines and for the purposes of preserving commercially vital oysters of global fame in the Apalachicola Bay. Elsewhere in the fiscal year 2007, South Carolina took legal actions against North Carolina for unauthorized water diversions out of the Catawba River that serves several electric power amenities, water outdoor retention activities, as well as many industrial facilities and their infrastructures. From the volume of activities on the water front, the Catawba has been listed among the most degraded rivers in the US as a result of the unprecedented development, especially in the Charlotte North Carolina area, amidst poor water management framework in the two states [1,16].
3.3.2. Political and Economic Fall Out
The South eastern region water scarcity in the past years left in its wake grave economic and political effects going back to the situation in 2007. In a period, when loses in the farm sector that hit key produces made up of maize, soybeans, cotton and hay amounted to over $1.3 billion [1,16]. The operators in animal husbandry and dairy and horticultural enterprises and outdoor and eco-tourism also saw their assets severely battered due to the drought. As the low water volumes in the lakes at that period intensified, power operators in the region such as the Tennessee Valley Authority (TVA) and the Duke Energy in North Carolina were forced to cut down power output from the affordable and renewable hydro power or thermo electric to the costlier and pollution intensive fossil fuel sources. In the same way, had cooling pool levels dropped below operational thresholds, that could have resulted in the closure of most nuclear-powered plants. The degree of aridity in the region also created political tensions in the form of transboundary disagreements with upstream and downstream states turning on one and another through court litigations. Initially both Alabama and Florida initially won a court injunction restraining Georgia on a state-wide measure for taking out water or diverting water from Lake Lanier, the key water provider serving the Atlanta metro region. Because Lake Lanier empties onto the Chattahoochee River with critical water supplies to localities in Alabama and Florida under stress for the sustenance of a variety of at-risk creatures like freshwater mussels and sturgeon [27]. The trio of neighbouring states (Florida, Alabama, and Georgia) as mentioned earlier, have engaged in legal battles for almost 3 decades over water sharing, however the dry spell compounded the issue as they litigated with each other over the control of a declining hydrological asset [1,16].
3.3.3. Ecosystem Stress
In the aftermath of the dry spell that ravaged the region in 2005, precipitations in the winter of 2006-2007 provided a measure of hope to the region. But during the fall of 2007 when La Nina struck, it created climatic uncertainty which led to irregular rain fall patterns. In the process, the storms that once brought moisture in the past periods never quite arrived. From the unprecedented dryness, government officials asked the public to cut back on water usage beginning with the Governor of Georgia who asked citizens to forgo watering the lawns and car washing. In Alabama, The Birmingham Water Works enforced an extra charge on 25,000 subscribers among its clients for surplus water extraction in the June of that year. Furthermore, The Georgia Environmental Protection (EPD), was forced to declare a state of emergency over a level 4 drought category in reaction to the unfolding disaster in every county in Northern Georgia region which also extends to Atlanta, by banning any open-air water usage. By October ending, the state governor informed the Georgia EPD to adjust both surface water and ground water extraction and freshwater authorizations to attain a 10% drop in water consumption in the Northern Georgia area. During the height of the dry period, when Atlanta’s main reservoir, Lake Lanier, sank more than 14 feet, usage restrictions were declared, and the states sued each other and the federal government over the use of water in rivers and reservoirs [52]. Even with the arrival of winter, the water volumes in reservoirs constantly declined as the sub terrain water and river systems were unable to replenish. In the 2nd week of February in 2008, many parts of the South east region stayed unusually arid due to water shortages. For that, most of the water management systems at risk started pushing several new plans to justify the call for preservation.
3.4. GIS Mapping and Spatial Analysis
The mapping of various aspects of water issues in the US Southeast utilizing GIS commences with a visual exhibition of the structure of water volume and groundwater network information across the states in the zone. Together with that are the geospatial patterns of groundwater depletion experienced over time and the concentration of water quality parameters in the face of regional exposure to extreme climate events associated with hydrological stress.In the context of hydrological parameters shaping water volume, real time data as presented in the map legend is quite provincial, meaning that the data have not been reviewed or edited. Said that, the real time info can also be affected by the volume of back water from ice or debris as well as long jams, algae and aquatic growth in the stream. In fact, during low stream flow conditions, aquatic grasses debris or rock nearby can produce artificial increases in water level reading. Accordingly, from the info on the map pertaining to real time water flow, note that they appear more solid on the coastal areas along Southeast Louisiana and South Florida areas, South Carolina, Georgia and Alabama and other places. Apart from the gaps in real time data in Florida as manifested in green, they appear more concentrated in upper Georgia and South Carolina in 2019 (Figure 2).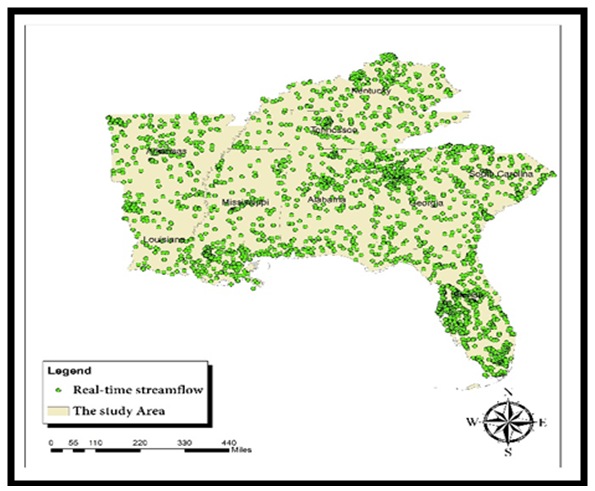 | Figure 2. Real Time Stream Flow 2019 |
With groundwater network information based on water well information calibrated under different values. They emanate from a set of water wells at which water levels are routinely measured for the planning and management of water resource programs from the percentile intervals under different scales. From the information represented under different levels made up of below to above normal, and not ranked from the colors of yellow to beige and orange as the highest and blue as the above normal. The South Florida area boosts of a combination of the small oval objects denoted as below normal (at scales of 10-24%) within clusters of areas in the zone where normal (24-75%), above normal grouping and > 90% level appeared prominent. This is a bit different when compared to the North West and South West areas like Louisiana, Mississippi and Arkansas. Among the states, see that the normal, above normal category and much more normal class held firm in Louisiana, upper and central Mississippi during the same period. Elsewhere, Kentucky, Tennessee and Alabama saw meagre presence coupled with some presence in Georgia (Figure 2.1). 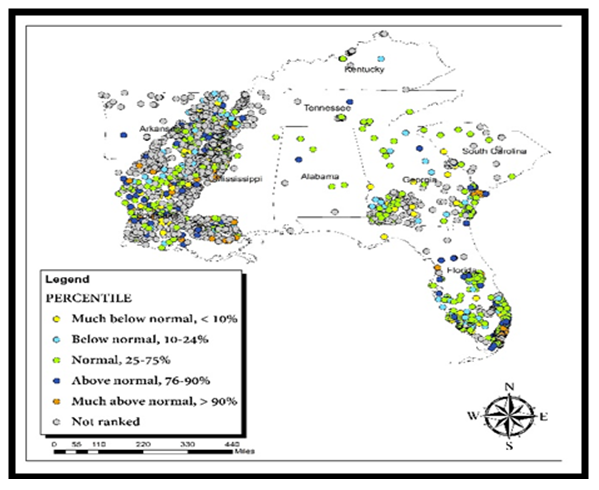 | Figure 2.1. Active Groundwater Network 2019 |
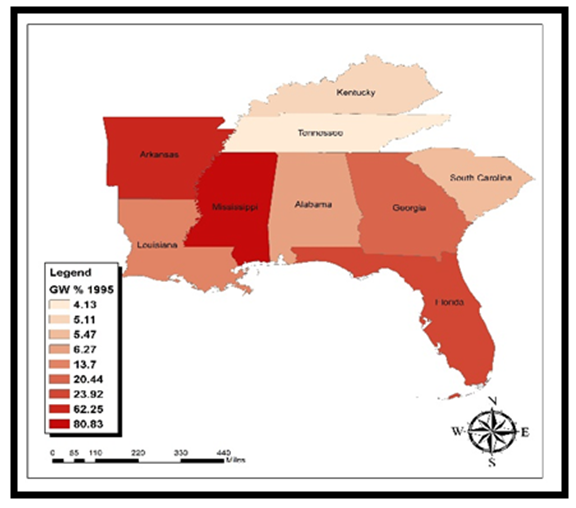
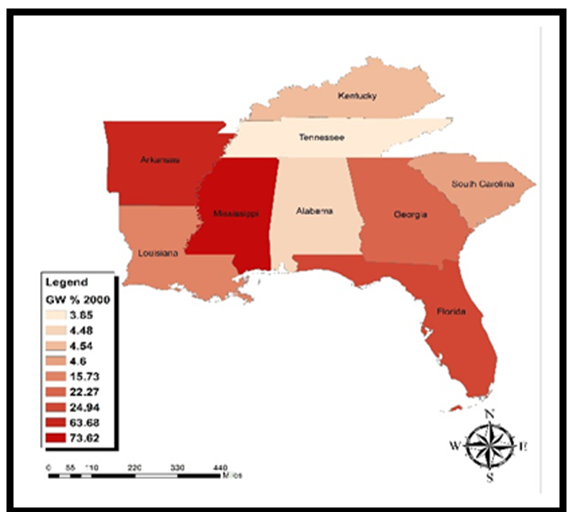
In as much as groundwater depletion of the highest scale are limited in the study area, that is not the case in Louisiana, Mississippi, Georgia and South Carolina. From the map, these areas saw depletion levels in the order of 1-8 and 1-9 km as represented in beige and orange between 1900-2008 (Figure 3). Added to that from 1995-2015, Arkansas and Alabama in green emerged as the states with surplus water budget or gains. Among the others, the extent and form of deficits run all through from Florida in yellow to Kentucky and all over in the lower south and the upper North corner of the study area (Figure 3.1). Further on the spatial distribution of ground water percentage totals in the region, the patterns from 1995 through 2010 remained steady with Arkansas and Mississippi as the leading areas with other states lagging fully behind in that category (Figure 4-5.1).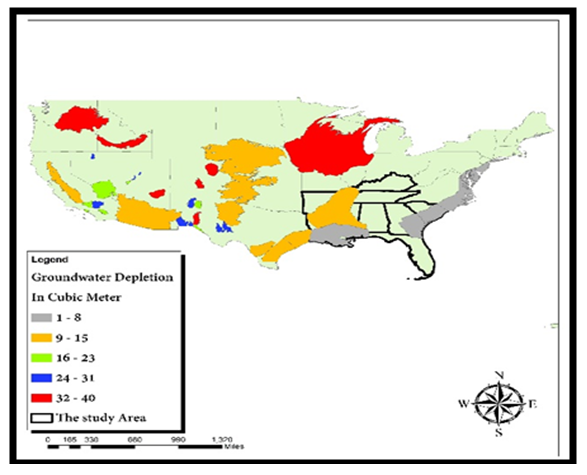 | Figure 3. Groundwater depletion in the U S (1900-2008) |
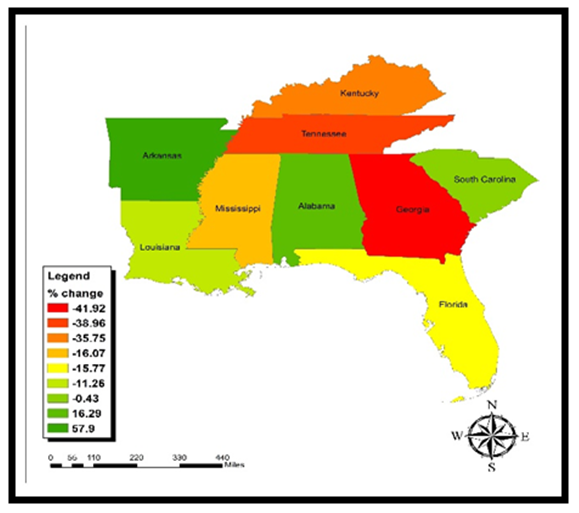 | Figure 3.1. Water Withdrawal Changes 1995-2015 |
 | Figure 4. Ground Water Total Percent 1995 |
 | Figure 4.1. Ground Water Total Percent 2000 |
 | Figure 5. Ground Water Total Percent 2005 |
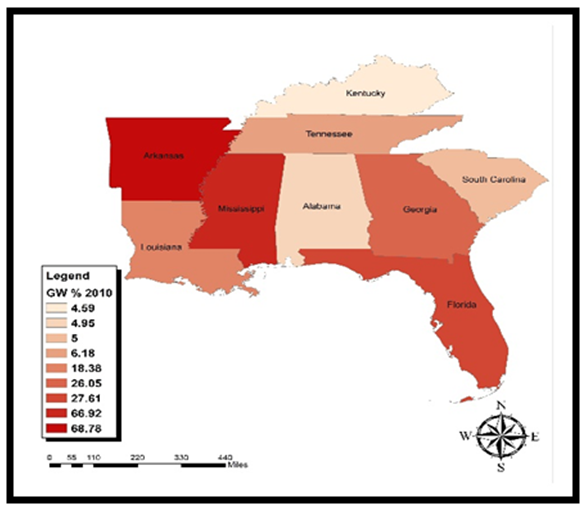 | Figure 5.1. Ground Water Total Percent 2010 |
The spatial distribution of the potentials of chloride to sulphate mass ratio of the Galvanic corrosion of lead all through 1991-2015 in the study area revealed a disparity among some of the states. For that, the critical thresholds among indicators appeared fully evident and limited across space in some of the areas, they are known to occur. With the PPGC indicators represented as low, medium and high, Kentucky in the Northern part of the study area showed scanty presence of the indicators as the low levels represented in blue seemed much more evident compared to the Southern East side of Florida, North west Louisiana, and South West as well as North west Arkansas where low and moderate potentials from Galvanic Corrosion of lead appeared prominent between 1991-2015. From the map, note clusters of areas in upper South Carolina, East Central Georgia, and Lower Alabama, South West Louisiana, and Northern Tennessee where possibilities of Galvanic corrosion of lead are obvious. Furthermore, let us not also overlook that additional clusters of highest potentials of Galvanic corrosion of lead stood firm in the central areas of the map in Alabama, Georgia, and South Carolina and upper areas of Tennessee, lower areas of Mississippi and Alabama in brown color (Figure 6). 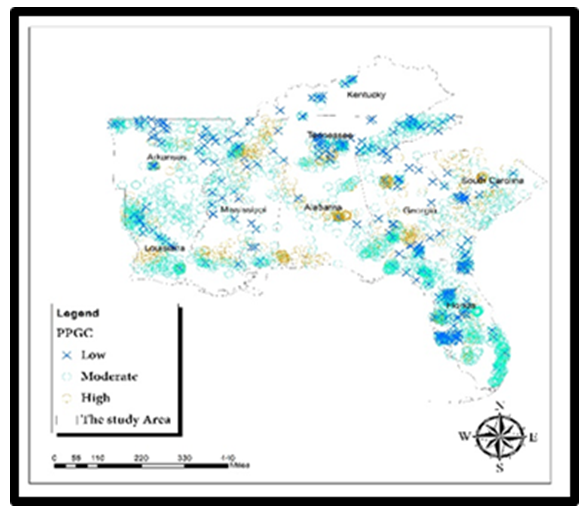 | Figure 6. Potential to Promote Galvanic Corrosion of Lead, 1991-2015 |
When it comes to potential corrosivity of ground water, the info on the map legend highlights the scale on a trio of the indicators denotated as very high, high, and moderate under blue, pink, and red colors. Among the states in the study area, the risks of potential corrosivity of untreated ground water in red appeared more in the North East part of the map made up of South Carolina, Georgia and Alabama. The higher types in purple showed a notable spread along five states (Tennessee, Alabama, Mississippi, Louisiana and Florida) as Kentucky emerged as the only area with moderate cases of the risks from corrosivity and untreated ground water (Figure 6.1). 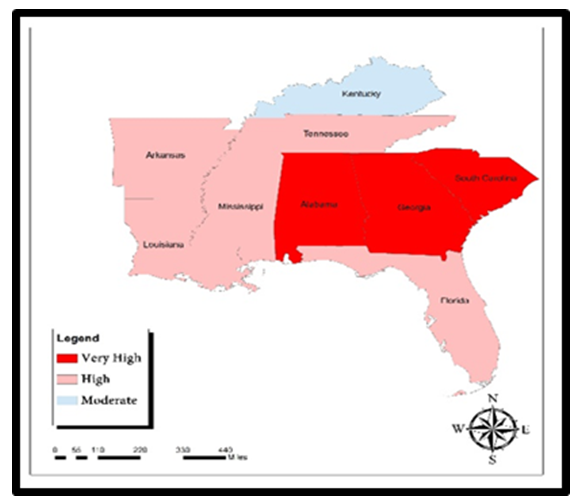 | Figure 6.1. Potential Corrosivity of Untreated Ground Water |
Even though arsenic is a naturally occurring element with cancer causing probabilities. Some of it can be released into groundwater via human activities such as mining and production and industries in animal feed and normal pesticide applications. Because it does pose problems at low levels. In 2001, the US EPA lowered the maximum contaminant level (MCL) for arsenic community water supplies to 10 micrograms per liter ug/L. With much of the arsenic maximum contaminant level or parameter of 10 microgram per litre denoted in different categories or colors in the study area. They are identified in space initially under the yellow class tagged as more than 5> to <10, and the less than 10 portions in light yellow / light green. The other classes represent the greater than >3 to <5 levels, and the green group in less than <3 level. With time, the occurrence of the first categories >5 to <10 to >3 to <5 stretches through the state of Arkansas, Louisiana, parts of Alabama and Georgia and deep into Florida and South Carolina. In the same order, the less than <3 level held firm all over South Carolina, Louisiana, Tennessee, Florida and Upper Arkansas (Figure 7).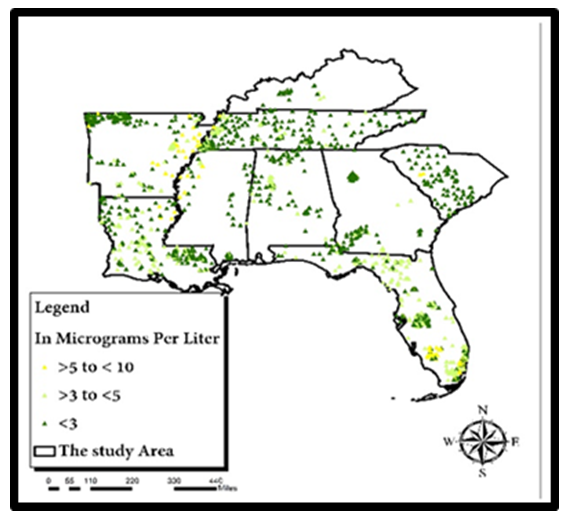 | Figure 7. Arsenic Concentration, In 2001 |
Considering the US EPA strategies of drinking standard for nitrates of N (10-milligrams per litre) as the threshold. The estimated areas and percent of states with groundwater nitrate concentration of 3>5 mg/L, shows Louisiana and Florida on the list with 9-15% in the dark red followed by Kentucky at 4% in light red. Among the other states, Mississippi, Alabama, and Tennessee in the Central and the North west part of the study area had 1% of their areas with ground water nitrate concentration of >5mg/L. In the neighboring states, South Carolina and Arkansas and Georgia each saw 2% of their areas with ground water nitrate concentrations of >5mg/L (Figure 7.1).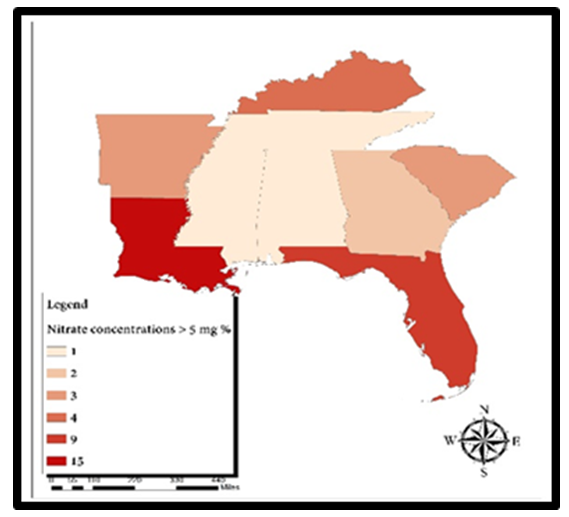 | Figure 7.1. Areas with Ground H20 Nitrate Levels > 5 mg/L |
In putting the extent of drought in a moist region like the study areas into context over the years given the history. In the month of May 8 in 2012, the Southeast region was heavily bombarded by dry spell of varying proportions under a long and short basis of over and less than 6 months periods within the respective states. At that time, the intensity of the drought wave that convulsed the area under different types made up of exceptional, extreme and severe levels appeared in full force around many counties in Alabama, Georgia and North west Florida and parts of South Carolina. In the same period, the extreme weather evidence faded slightly as the abnormally dry and moderate forms of drought intensity moved across lower Louisiana, minute portions of south and North west Mississippi, Arkansas and Tennessee (Figure 8). By 2018 to 2019, the drought hazards in the region seems to have faded in space among the states with slight presence of severe case in 2019 in lower Alabama as moderate and abnormally dry areas clustered around in a quite a few states by 2018 (Figure 8.1-9).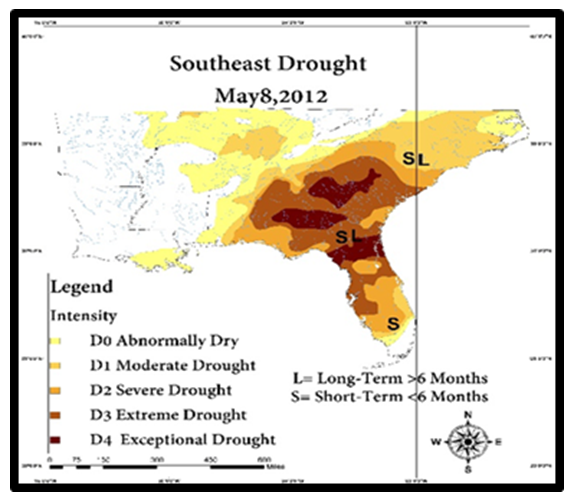 | Figure 8. Heavy Drought Spell 2012 |
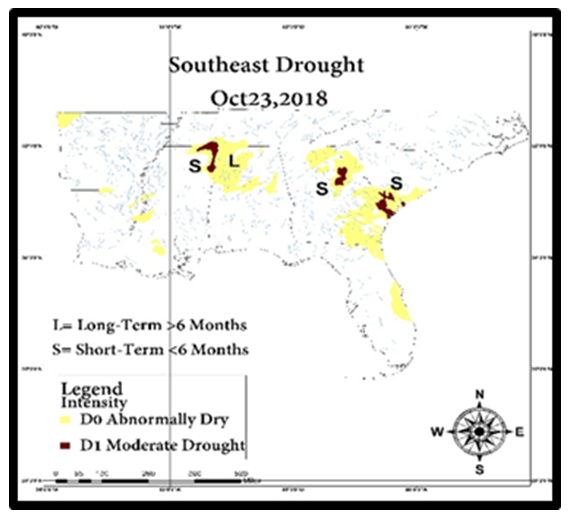 | Figure 8.1. Meagre Drought Spell 2018 |
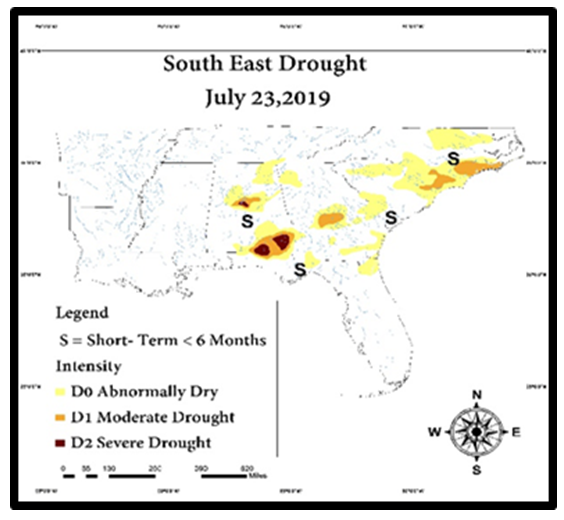 | Figure 9. Serious Drought Levels 2019 |
3.5. Factors Behind Regional Water Stress
The growing occurrence of water stress and depletion in the US South East zone never occurred in isolation. It is linked to a host of socio-economic elements (population growth and policy) and environmental parameters of climate change. These factors are fully stressed in the paragraphs below.
3.5.1. Population Growth and Building Permits
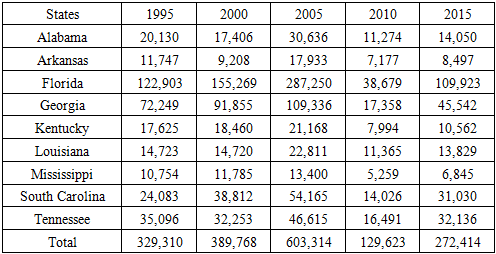
The past 20 years in the South east came with increased population and the issuance of new building permits that spurred rising consumption of water amidst robust urban growth. Within the period of two decades from 1995-2015 the study area’s overall population grew from 47,932 to 61,930 million at rate of 29% coupled with additional increases in the other sub periods. With Florida as the largest populated area amidst current growth levels, its numbers doubled significantly alongside Georgia which had 23 of the top 100 booming cities between 2000 to 2007. During that period, at least the region had 58 cities among the top 100 fast booming localities in about nine states. Also, in Florida where the residents consume almost 6.5 billion gallons of freshwater daily. South Florida which accounts for about 40% of the state population and a large farm sector, uses 3.4 billion gallons of water daily (or over 50%) of the overall amount state-wide. Under the projected pattern of steady growth, the current population figures of over 64 million in the Southeast will rise by 23 million in 2030. For that, of the big state water users both Florida and Georgia stood out with much larger population figures (14.166 to 7,201million) followed by 16,000-8190 million in 1995-2000. In the later years, Georgia’s population of 9 million plus in 2005 to 2010 climbed to 10 million plus in 2015 while in the same period, Florida’s population rose visibly from 17,900 to 18,800 million to 20,300 million. The percentages of change for both states of Florida and Georgia points to an increment of 30.2 1 to 41.64 all through 1995 to 2015, that coincides with water shortages in the Southeast (Table 8). In terms of the other states in the region that have experienced transboundary disputes over the years, the population in Alabama grew much of the time as the state averaged over 4.5 million with 2015 tagged as the highest (at average figures of over 4 million) [42]. Similar levels of growth also occurred in a trio of states like Mississippi, South Carolina and Tennessee. Meeting the needs of the growing populations in the face of water stress and migration into the zone requires the development of new settlements involving subdivisions, roads and the construction of buildings. For that, by 1995-2015, the study area’s quest for new building permits reached a total value of 1,724,429 at an average of 344,886 per year. In those periods, building permits request rose from 329,310 to 389,768 at a rate of 18.35% in 1995 and 2000 (Table 8.1). Given that these permits jumped by 83.20% to 603,314 from 1995 to 2005. By 2010 through 2015, the request grew even further from 129,623 to 272,414, at 110.15% with Florida and Georgia as the leading states (in 1995 to 2015) putting more strain on water security [42].Table 8. Total Population Percentage Changes By State 1995-2015
 |
| |
|
Table 8.1. Total Value of Building Permits By State 1995-2015
 |
| |
|
3.5.2. Incoherent and Adhoc Policies
The access to and the reduction in water consumption in the Southeast do reflect the extent of incoherencies embedded in existing policy instruments. The US agricultural policy under the farm bill created the agricultural water enhancement program (AWEP) to ensure continual operational irrigation and water preservation initiatives to boost yield. To sustain a vigorous farm market and food expenditure in the zone, various states like Florida, Georgia and Mississippi considerably increased their irrigation activities in the past 4 decades as evidenced with the volume of water allotted to that sector between 1995 to 2015. However, irrigation extraction impedes summer water flow and does undermine water systems. Elsewhere, the obsession with large water takeout by the thermoelectric power sector between 1995-2015 did not occur in isolation. As an integral part of the energy policy, it creates sectorial imbalance, blind competition and minimal integration of the water needs of every sector in the South, with huge concentration of water budget in one area of the economy at the expense of others. Additionally, the recourse to a quick fix of water shortages in the Southeast in the early 2000s is not different from the adhoc nature of water policy responses. This involves the tendency to sit back and watch the uncertainties surrounding impending emergencies unfold and then institute temporary solution when disasters occur. That is what happened with the introduction of stringent water conservation measures across various states in the aftermath of the 2008 drought disasters. Although during that period, the Birmingham Water Works saw a drop of 14 mlgd to 95 mlgd in public usage with the introduction of extra costs. Such adhoc measures are often temporary solutions that do not ensure long term access to water in the Southeast region. Added to that, the unprecedented boom in the region over 5 decades, sustained by policy, created plenty of low-priced water incentives which in turn prompted the growth. This probably inflicted a major stress on community water access during the drought seasons over the years. Furthermore, with population still growing with many people migrating into the region, current land use laws did little to increase water storage and reduce unwise consumption practices. Rather, what occurred stems from the surge in sewer flow in places adjacent to water supply amenities and the preference for poor water management practices beginning with the proliferation of impervious rooftops, highways and car parks that allow rainwater loss in place of harvesting it. [17].
3.5.3. Changing Climate
The link between climate change threats and fluctuating water access in the Southeast over the years remains obvious. This comes with the frequency at which pressures from rapidly dangerous weather conditions impend marine environments stretched beyond their capacity and the $29 billion eco-tourism sector they sustain. From the scale of what transpired in terms of varying budgets regionwide, the rising pace of aridity constitutes a serous menace for marine creatures, as the search for scarce water can drain rivers, lakes and surface water sources. Aside from the presence of water all through the dry periods, the irregular refill and plummeting levels as experienced in the region diminishes the quality of water in a manner that pushes leftover marine creatures onto dwindling habitats. In those settings, minor streams warm up more much quicker and that cuts the volume of dissolved oxygen the water can retain, making the survival of most marine creatures and the benefits from them much harder. With global warming known to induce large storms marked by lengthy drought times, vegetations vital to the flood control are not only often damaged, but the process of ground water recharge stays impeded [29]. In the event of strains from water stress or inundation, forests and other floral species such as the pines are vulnerable to the outbreak of diseases. In fact, the pines have some susceptibility to destruction through dangerous insect pest threatening diseases in the US Southeast region during aridity, and inundation or storms impairment. When the drought periods raise the vulnerability of southern vegetations to wildfire they endanger the lives and properties and the ecology of these areas including the soil nutrients in most cities. During the fiscal year 2007, drought induced fire razed some hundreds of thousands of acres in the states of Georgia and Florida [16]. Seeing that rainfall stands as the main source of fresh water in the US Southeast region, the recurrent storms from climate change induced flooding will probably diminish the zones ability in storing ground water thereby contributing further to shortages [18,19].
4. Discussion
The research emphasized the extent and level of water usage and the slight depletion and deficits, the reliance of various segments of the economy on surface and ground water sources and the common challenges of water abundance, stock and availability. The other important outcome in the analysis, involves the existing linkages binding water use, security and socio-economic and physical factors including rapid population increase in urban areas throughout the Southeast, growing water extraction and pollution threats. Based on the findings, the state of US Southeast water use appears somewhat mixed and anchored in the abundance and depletion interface despite propensity to extreme events. Being a moist region where water is supposed to be in abundance, water usage serves essential needs of many sectors in the economy heavily dependent on it amidst climate uncertainty. Besides that, the Southeast region boosts of large swaths of areas covered by water sources and lifeforms which thrive on continual flow. Considering the widespread search for water in the region and the limited access involved due to the massive surge in population and development across cities. The desperate search for water to fuel ambitious development plans of states and cities and their projected population explosions in 2030 has now triggered a major scramble for the resource in the Southeast. In the process, the fight over the control and extraction of water from key watersheds has emerged as part of the elements pitting neighboring states of Georgia, Florida and Alabama against one other in legal battles in the last several years. To track the extent and form of water use trends amidst ongoing conflicts, the threats of shortages, and host of factors, together with future and current uncertainties. The paper adopted mixscale model of descriptive statistics and GIS with data covering multiplicity of socio-economic, ecological and hydrological indicators like ground and surface water sources, daily use across the sectors and consumption. Of great importance in the analysis, is that 7 of 9 states in the region got their water from surface sources while only 2 others did the opposite. This makes the area a largely surface water dependent zone. Regarding the state of water use in the zone based on the analysis, the study area saw notable changes in the use of water resources in the form of gains and declines in some periods. But between 1995-2015, water extraction grew throughout the Southeast region by over 8% followed by drops in the two periods of 2000-2010 and 2005-2015 at double digit points. Except for Alabama and Arkansas, water declines were across the board among the states in the study area with some of the decreases at high double-digit levels between 1995-2015. So, based on the information, the same can be said of some years under analysis that the states in a moist region like the US Southeast do have water use issues which should no longer be taken for granted. Among the individual states all through 1995-2015, there exists some level of water use hierarchy across sectors and between the states in the Southeast. In that way, throughout the zone, the state of Florida emerged as the biggest water user in total volume of ground and surface water extracted. Aside from that, the classification of the largest withdrawers of water also extends to critical categories like public use, household and electric power water and others. Further at the state level, Georgia also followed up in that category behind Florida especially in the use of water destined to activities devoted to heavily built up areas like public and domestic water use crucial to the unprecedented urban migration and growth that occurred in the past 2 decades in the region. Notwithstanding the fact that thermoelectric water usage in the Southeast exceeded other categories all through 1995-2015, Florida still turned out as the biggest user of thermoelectric power water than the other states in the region. The water use trends among the other smaller states in the region did reveal the dominance of Arkansas as the state with the largest ground water sources and sectorial water use for irrigation between 1995-2015. In those years, the state of Arkansas took out the total of 37,278-42,700 mlgd of water through ground sources and water for irrigation sprinkling at an average of 7455.6 -8540 over the two decades ahead of the other states in the Southeast. In the area of irrigation water extraction, Arkansas accounted for 54.06% of all the water use in that sector. The GIS analysis of the patterns presented the diffusion of hydrological stress and the exposures of water sources to pollution risks, the outbreak of extreme droughts, the relative levels of depletion and the composition of ground water use. Other dimensions of the spatial analysis showed the extent of water deficits and surpluses under water extraction categories in the states in the region. Given that the changing trends in water use in the Southeast left in its wake far ranging impacts that rattled the region’s ecology quite miserably. The paper shows that the problem does not operate in a void due to a host of socio-economic and physical elements located in the larger hydrology and ecosystem of the region made up of the rapid growth in population and urban development, climate change and ineffective policies. To mitigate the problems, the study proffered several recommendations ranging from the need for effective policy and growth containment, conservation measures, the education of the public and the design of a Southeast regional water info system/mapping, coupled with the use of early monitoring and airborne warning system to track water usage among the states and the establishment of a regional water arbitration panel to mediate interstate water conflicts.
5. Conclusions
The study assessed the state of water resources use and the common challenges with valuable findings highlighted under the ensuing headings: a) mix-scale technique efficient; b) changes caused by many factors; c) water deficit evident; d) consumption on the rise; e) impacts of the crisis apparent.1) Mix scale Model Efficient In stressing the challenges of water resource use among the states in US Southeast from 1995 and 2017, mix-scale approach showed different phases not used before by managers. The use of descriptive statistics in that way, displayed flashes of novelty in the capability of the tool to spot the level of usage in the respective states faced with a mix of surplus and deficits coupled with the risks of hydrological stress. Seeing the scale upon which GIS visualization identified the composition, isolated dispersion of ground water depletion, changes in water withdrawal volumes, pollution risks and clusters of drought concentration in some states. The inferences from the emergent patterns in water resource use in the zone increases the readiness capacity likely to ensure prompt measures by planners. Similarly, the complete GIS visualization remained feasible in mapping the threats of indices linked to changing climatic parameters such as droughts alongside temporal variations in ground water composition, depletion exposure, pollution dangers and the fluctuations in extraction levels. Under such settings, managers have better opportunities in devising result-oriented plans deeply rooted in sound reason. With these scenarios today handy, scholars, practitioners and water resource consumers have at their disposal, information on the prospects and dangers to hydrological assets as a model for sustainable use in the places prone to recurrent stress. 2) Changes Prompted By FactorsThe key elements influencing water consumption and access in the US Southeast region as demonstrated in study emanates from a host of socio-economic and environmental forces based on incoherent policy, teeming population and urban expansion and changing climate. Of these elements, various policy instruments like US agricultural water enhancement scheme focus on irrigation and crop yield prompted extensive usage in Florida, Georgia and Mississippi from 1995-2015 regardless of how it diminishes water flow in the summer months. Under such policy lapses the preference for more thermoelectric power plants in the energy sector creates huge sectorial imbalance with much of the water in the zone allotted to the industry. The reactive approach of water policy, alongside water subsidy that fuelled growth and the attendant land use laws, overlooked water storage and best management practices in cities. This to some degree accentuated the issues. Just as ineffective policy of that magnitude hampers serious considerations towards water deficit containment, the challenge seems worsened by the rising population and urban growth. In addition to that, are the vulnerability of the zone to the threats of changing climatic hazards like drought and storms threatening water security given the exposure of most hydrological indices to stress. In identifying these indicators, this enquiry added another dimension for managers in tracking the stressors to water security in moist environments.3) Deficits evidentConsidering the sequence of water emergencies, the resulting tendencies, and the variations prompted by extraction and misuse of water resources throughout the region in past periods, coupled with the threats of water shortages and the transboundary tensions over sharing. The burdens of shortfalls as exemplified by the incidence of falling reserve levels at major rivers and reservoirs cuts across different parts of study area and unending. For that, the level of declines in water budgets across the states and the withdrawals from key hydrological sources like the Floridian aquifer, Lake Lanier and the declines that occurred in many of the states in the Southeast region in a span of 2 decades from 1995-2015 are ample measures of depletion flashpoints. From the recurrent demands, water depletion patterns as manifested along the states of Mississippi, Louisiana, Georgia and South Carolina over the years also pose enormous risks in the region’s ecosystem stability. Thus, drawing from what transpired in the study, hydrological stress remains evident in the US Southeast states where the carrying capacity of fragile natural areas in the zone face mounting dangers. For that, it is safe to point out that, the states in water rich Southeast zone face the threats of deficits in water use. The capacity of this enquiry in outlining the existence of water shortfalls and reduction provides a blueprint for the states in designing a common template for dealing with emergent water problems that are often encountered in shared waters4) Water Use On the Rise Essentially, in a region facing enormous growth and changes over the years, the allocation of ground and surface water to meet sectoral demand appears to be driving the use of the resource. With this trend manifested obviously at the state and city levels. The biggest users which consists of power and utility, irrigation and public supply consumed more water throughout 1995-2015 worth millions of gallons daily. From what transpired in the region over two decades, the enquiry showed that the Southeast not only consumed more than 300,000 mlgd of water from 1995 through-2015, however, water flow remains critical in the zone. This came with huge take out from thermoelectric sector that averaged a total of 43,246 mlgd yearly or 58.13% of sectorial water from 1995-2015. With water use in the power sector estimated at over 50,000 mlgd from 2000 to 2005 as the peak, it outpaced the rest of its competitors. Additionally, in the region, water extraction grew by over 8% from 1995-2015. The design of hydrological indices of water use in the study as assessment tool, improves the commitment of managers to monitor consumption over time by making the zone fully cognizant of the changes. This will ensure speedy response on their part when the thresholds of stress and deficits sets in. 5) Impacts Evident in the RegionIn line with the findings of this enquiry, the study acknowledged how the widespread dependence on continuous use of water in the US Southeast region over the years left in its wake visible impacts in the form of declines, economic-political challenges and uncertainty in the physical environment within a handful of areas. With the abundance of water assets in the zone, the intensity of usage in the respective states have persisted to the extent that cities resorted to over pumping their reserves to meet daily needs. In the process, the emergent scramble for hydrological assets prompted visible shortfalls and transboundary legal disputes among some of the states (Georgia, Alabama and Florida) as mentioned earlier over competing jurisdictions to regulate movement of water from common reservoirs and adjacent basins to serve different uses ranging from residential, ecological and industrial units. From the experiences in the study area, the water scarcity that occurred in 2007 also created economic and political issues that left the farm sector severely battered with losses estimated at over $1 billion in major crops like corn, soya and cotton. At that time, among the physical environmental impacts, the pressures unleashed from the drought outbreak in 2005-2007 led to measures to combat scarcity. This began via conservation with the requests from public officials in Georgia and Alabama to reduce usage by proscribing open-air use and the imposition of extra charge for those who overdraw water. Exposing these threats given the level of water stressors, the water shortfalls and the ecological risks herein, represents a major leap towards secure access. Considering the utilization volumes in surface and ground water sources in the past years, and the alarms raised by the shortfalls in common water resources as indicated in this enquiry. Planners and researchers will be required to elicit crucial answers to several queries that are essential to water security. The questions are as follows: How would future consumption levels shape water security? What are the regional implications of transboundary water problems in the Southeast? How will changing climatic parameters affect water security? How will the current growth levels in the South and the concentration of sectoral allocations in the thermoelectric power industry shape access? How will the states in the region address the growing threats of water scarcity in the area? Based on these queries, ample possibilities exist for rigorous enquiry and practice to strengthen the focus on sustainable regional water use.
Appendix
Acronyms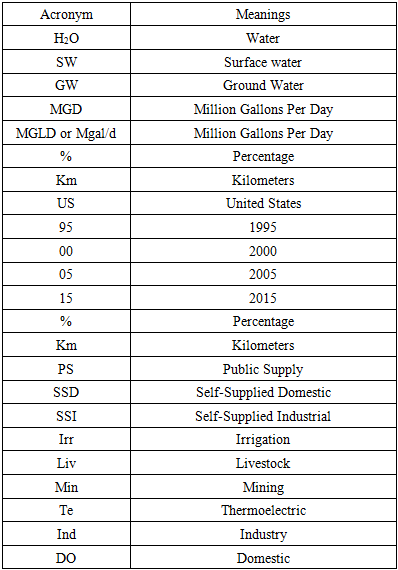
References
| [1] | National Wildlife Federation. (2008)). More Variable and Uncertain Water Supply: Global Warming’s Wake-Up Call For The Southeastern United States. DC Washington, National Wildlife Federation, pp 1-8. |
| [2] | Barber. Nancy. (2014 November). Summary of Estimated Water Use In The United States in 2010.USGS Factsheet 2014-3019 US Department of the Interior. 1-2 USGS, Reston Virginia. |
| [3] | Hutson, Susan. (2004). Estimated Use of water in The United States in 2000. USGS Circular 1268. US Department of the Interior, USGS USGS Information Services, Denver Colorado. Pp 1-44 use. |
| [4] | Maupin, (Molly). (2014). Estimated Use of water in The United States in 2010. Circular 1405. USGS Reston Virginia 1-52. |
| [5] | Soley, Wayne. (1998). USGS Estimated Use of Water In The United States In 1995. US Geological Survey Circular 1200 US Department of the Interior, USGS Information Services, Denver Colorado. Pp 1-74. |
| [6] | Florida On Line. (2018). Florida’s Natural Resources McGraw Hill LLC. Retrieved On May 25 2019 Fromhttp://www.glencoe.com/sites/florida/student/socialstudies/fl_online/natural_resources.html. |
| [7] | Merem, E. C. (2018, February). Assessing Water Resource Issues in the US Pacific North West Region. In Proceedings of 2018 Mississippi Political Science Conference (MPCC), Jackson, MS. |
| [8] | Merem, E. C. (2019). Assessing Water Resource Issues in the US Pacific North West Region. International Journal of Mining Engineering and Mineral Processing, 8(1): 1-19. |
| [9] | Richard L. Marella. (2012) Water Withdrawals in Florida, Orlando Florida, USGS. U.S. Geological Survey Open-File Report 2015–1156, 10 p. |
| [10] | South Florida Water Management District. (2008 September). Water Conservation - A Comprehensive Program for South Florida, West Palm Beach Florida, 1-28. |
| [11] | Gavrilles, Beth.(2010 December). South-Eastern U.S. With Exception of Florida, Likely To Have Serious Water Scarcity. Science Daily. Athens, GA UGA www.sciencedaily.com/releases/2010/12/101213184436.htm. |
| [12] | Schneider, Keith, (2012 April) Faces Era of Water Scarcity. http://water-spouts.blogspot.com/2012/04/us-faces-era-of-water-scarcity.html. |
| [13] | Bryan, Wiliam. (2018 March). There’s A Solution To The Southeast’s Water Crisis. But Will Georgia and Florida Agree to it? Washington Post. |
| [14] | Mizuno, J. (2007). Potential Losses of Freshwater Resources in Coastal Aquifers Caused by Climate Change. Geographical Society of America Abstracts with Programs 39: 431. |
| [15] | Furlow, J. (2002). The Vulnerability of Public Water Systems to Sea Level Rise, in Proceedings of the Coastal Water Resource Conference. Middleburg, VA: American Water Resources Association: 31-36. |
| [16] | Weinmann Aileo, (2008). More Variable and Uncertain Water Supply: Global Warming’s Wake-Up Call For The Southeastern United States. Schwartz report. |
| [17] | Merem, E. C. (2020, March). Assessing Water Resource Issues Among States in the US South East Region. To be Presented at 28th Annual AEHS Conference. San Diego, CA. |
| [18] | USGS (2009). Effects of Climate Change Variability and Change on Groundwater Resources of The United States. USGS Fact Sheet 2009-3074, US Department of the Interior. Office of Global Change pp 1-4., Idaho Falls, Idaho. |
| [19] | US. Geological Survey, (2007a). Climate variability and change: U.S. Geological Survey Fact Sheet 2007–3108, 2 p. |
| [20] | U.S. Census Bureau, Population Division, (2005). Interim State Population Projections. Available at: www.census.gov/population/www/projections/projectionsagesex.html. |
| [21] | Pema, levy. (2013). Southeast Water Wars: Georgia Winning Over Alabama And Florida. International business Times https://www.ibtimes.com/southeast-water-wars-georgia-winning-over-alabama-florida-1356799. |
| [22] | Kenny, Joan. (2009). Estimated Use of water in The United States in 2005. Circular 1344. USGS Reston Virginia 1-50. |
| [23] | Earth Justice. (2018 December), Georgia at a Crossroads Groundwater Contamination From Coal Ash Threatens the Peach State: A report by Earthjustice and the Environmental Integrity Project. https://earthjustice.org/features/coal-ash-contamination-georgia-groundwater. |
| [24] | Clean Technica. (2018 March). These 3 US Cities Could Be The Next To Face A Severe Water Crisis. Clean Technica and The Climate Reality Project. |
| [25] | Southern Environmental Law Center (2019). Tri-State Water Wars (AL, GA, FL). Charlottesville, VA Southern Environmental Law Center. https://www.southernenvironment.org/cases-and-projects/tri-state-water-wars-al-ga-fl. |
| [26] | Southern Environmental Law Center (2018 June). U.S. Supreme Court Remands Florida v. Georgia Interstate Water Fight Back to Special Master. Southern Environmental Law Center. Charlottesville, VA https://soso.bz/6BNoonEdckGo. |
| [27] | Manuel, J. (2008). Drought in the Southeast: Lessons for Water Management. Environmental Health Perspectives 116(4): A168-A171. |
| [28] | Seager, R. (2008). Drought in the Southeastern United States: Causes, variability over the last millennium and the potential for future hydroclimate change. Submitted to J. of Climate. |
| [29] | National Oceanic and Atmospheric Administration (NOAA) 2008. Climate Change Science Program (CCSP), Weather and Climate Extremes in a Changing Climate. Regions of Focus: North America, Hawaii, Caribbean, and U.S. Pacific Islands. (Washington, DC: Department of Commerce, NOAA's National Climatic Data Center, 164 pp. |
| [30] | National Oceanic and Atmospheric Administration (NOAA) National Climatic Data Center (NCDC). Time Bias Corrected Divisional Temperature-Precipitation-Drought Index (TD-9640) April 2007. NOAA) Washington, DC. |
| [31] | Water Rights Group (2017 November). Common Water Problems; Eastern and Southeastern States. Regional Rights Group. Appleton, WI Wisconsin. |
| [32] | Groisman, P. (2004). Contemporary changes of the hydrological cycle over the contiguous United States: trends derived from in situ observations. Journal of Hydrometeorology, 5(1), 64-85. 8CCSP, 2008. |
| [33] | Meixner, T. (2016). Implications of Projected Climate Change for Groundwater Recharge In the Western United States. Journal of Hydrology. 534: 124. |
| [34] | Galloway, D. (2002). Ground Water Depletion and Spaced-Based Monitoring of Aquifer-System Compaction In the Western USA. Proceedings of Geological Society of America Annual Meeting. Denver: Colorado October 2002. |
| [35] | Environmental News Network. (2015 August). Impacts: Is the California Drought Causing Land to Sink. Pasadena: California Jet Propulsion Laboratory. |
| [36] | Merem, E.C. (2017). Techniques of Remote Sensing and GIS as Tools for Visualizing Impact of Climate Change-Induced Flood in The Southern African Region. American Journal of Climate Change. 6: 306-327. |
| [37] | Merem, E.C. (2014). Analyzing Water Issues In the State of Mississippi. British Journal of Applied Science & Technology. 4: 2: 3179-3216. |
| [38] | Merem, E.C. (2012). Using Geospatial Information Systems in Assessing Water Quality in The Mid-Atlantic Region Agricultural Watershed of Maryland. International Journal of Ecosystem. 2:5: 112-139. |
| [39] | Merem, E.C. (2017). Analyzing Water Management Issues Using GIS: The Case of Nigeria. Geosciences,7:1: 20-46. |
| [40] | Merem, E.C. (2008). Using Spatial Information Technologies as Monitoring Devices in International Watershed Conservation along the Senegal River Basin of West Africa. International Journal of Environmental Research and Public Health. 5:5: 464-476. |
| [41] | Merem, E.C. (2008). Geospatial Information Systems Analysis of Regional Environmental Change along the Savannah River Basin of Georgia. International Journal of Environmental Research and Public Health, 5(1) 281-294. |
| [42] | United States Bureau of the Census. (2018). Census Quick Facts. Washington, D.C: US Bureau of Census. |
| [43] | US EPA (2016 December). Climate Impacts in the Southeast. DC Washington. https://soso.bz/kCHB3G0Grk2. |
| [44] | White, Vincent. 2019. Water Resources of Tensas Parish, Louisiana. Baton Rouge, LA USGS Lower Mississippi-Gulf Water Science Center. https://pubs.usgs.gov/fs/2019/3004/fs20193004.pdf. |
| [45] | American Rivers. (2019). America’s Most Endangered Rivers. Washington, DC. American Rivers. |
| [46] | Williams, L.J. (2015), Digital surfaces and thicknesses of selected hydrogeologic units of the Floridan aquifer system in Florida and parts of Georgia, Alabama, and South Carolina: U.S. Geological Survey Data Series 926, 24 p., https://dx.doi.org/10.3133/ds926. |
| [47] | Andrew M. (2014 April). Groundwater Availability of the Floridan Aquifer System. Conference: 6th Karst Interest Group Workshop at: Carlsbad, New Mexico. |
| [48] | USGS. (2014). Floridan Aquifer System Groundwater Availability Study. USGS: Science for a Changing World https://fl.water.usgs.gov/floridan/. |
| [49] | USGSCRP. (2009). Global Climate Change Impacts in the United States. United States Global Change Research Program. Cambridge University Press, New York, NY: USA. |
| [50] | Nagy, RC. (2011 May-June). Water Resources and Landuse and Cover In a Humid Region: The South eastern United States, Journal of Environmental Quality: 40(3): 867-78. |
| [51] | Seager, R. (2008 July). Drought In The Southeastern United States: The Recent Drought In The Context of a Millennium of Climate Variability, Physical Causes and Future Hydroclimate Change. Lamont-Doherty Earth Observatory. |
| [52] | Environment News. (2009 October). Southeast Water Scarcity Blamed on Overpopulation factors. New York, Environment News Service. |
| [53] | Seager, R. (2009). Drought in the Southeastern United States: Causes, Variability Over The Last Millennium and the Potential for Future Hydroclimate Change, Journal of Climate, 22, 5021-5045. |
| [54] | USGS (2013). Groundwater Decline and Depletion Issues. 2013. https://soso.bz/fVaqqCWBdSTj. |

 Abstract
 Reference
 Full-Text PDF
 Full-text HTML