Sajed Nemati Havigh, Mehdi Behdarvandi Askar
Department of Offshore Structures, Faculty of Marine Engineering, Khorramshahr University of Marine Science and Technology, Iran
Correspondence to: Mehdi Behdarvandi Askar, Department of Offshore Structures, Faculty of Marine Engineering, Khorramshahr University of Marine Science and Technology, Iran.
| Email: |  |
Copyright © 2017 Scientific & Academic Publishing. All Rights Reserved.
This work is licensed under the Creative Commons Attribution International License (CC BY).
http://creativecommons.org/licenses/by/4.0/

Abstract
One of the important reasons of fracture in jacket pelatforms that makes the sadenly failure and structual resistanc reduce at long time, is Fatigu phenomena. Because of existence of peridice loads derived by waves, sea current, wind, etc. hence, fatigue analysis is important item in offshore structual design. The known methodes of fatigue analys is published at design codes suche as, API and DNV and ABS and other relavant codes, that are in acceptable relationship whit toghether. This paper will reviwe the fatigue analysis methodes and will tries to present a simple and accurate methode that be according to Persian Gulf candition. Whereas, the most of jacket pelatformes in Persian Gulf, has natural ferequence about less than 3s, that’s wisely to using Deterministic methhode for fatigue analysis. However, the mentioned offshore design codes, offer the Spectural methode for all of environmental condition, although the Spectural methode has more accuracy in comparition whit other methodes, but it’s take larg time to analys and needs to high knowledge of mathmaticul transformation functions, frecuncy-domain analysis and dynamic of structures. And in the end, the paper offers that Persian Gulf’s pelatformes, consider whit Erthquake analys, because, most of pelatformes are in the end part of those useful life time.
Keywords:
Tubular joints, Natural ferequnce, SCF, Determinstic analys, Fatigue, Jacket
Cite this paper: Sajed Nemati Havigh, Mehdi Behdarvandi Askar, The Process of Fatigue Analysis on Fixed Metal Offshore Platforms, Marine Science, Vol. 7 No. 1, 2017, pp. 10-16. doi: 10.5923/j.ms.20170701.02.
1. Introduction
Nowadays, the oil and gas industry, or in fact in more common terms, economy and energy, is one of the most important and most strategic issues that all countries are trying to access this important factor in order to be able to play a decisive role in the region and the world. Therefore, the oil and gas industry is of great importance, and the capability of the development and exploitation of oil and gas fields could be considered as one of the powerful arms of any country. Due to the existence of energy resources in seas, the exploitation of energy from marine environments requires high scientific and technological capabilities. Offshore platforms have a very important and strategic role in providing the national development. Therefore, firm steps can be taken in the direction of national and scientific interests by the preservation and quantitative and qualitative improvement of these structures. The excessive cost of building new platforms causes the subject of the renovation and retrofitting of the existing platforms to be considered more than ever. Template fixed platforms are the most common and most widely used existing platforms in the seas, which entered the oil and gas industry from the late 19th century and today account for a large percentage of the existing platforms. Due to the recurring nature of most environmental loads in the seas and oceans, these structures are constantly under multiple and recurring loadings. Loads such as winds, waves, and earthquakes that have a dynamic nature, are the dominant loads in the design of these structures [1]. In this paper, some of the existing methods for fatigue analysis will be reviewed and subsequently a useful method in terms of cost and precision will be presented for the Persian Gulf region.The phenomenon of fatigue in materials caught the attention of many researchers from the middle of 19th century, which in particular Wohler's research led to SN curves [2]. These curves are widely used in determining the fatigue life [3].
2. The Importance of Detection and Explanation of Fatigue
In engineering sciences, fatigue is defined as the failure of the structure caused by repeatedly applied loads. The random nature of this phenomenon has caused sensitivity in detecting this phenomenon. In offshore structures, including oil platforms, there have been disastrous catastrophes during the history of oil and gas industry, which have been mainly blamed on the fatigue phenomenon. Of these, we can mention the following examples. The disaster of the Alexander L. Kielland semi-submersible Norwegian oil platform in the North Sea, killing 123 crew members. One of the main braces connected to one of the pontoon bases completely failed and separated from the platform and led to the complete capsize of the platform (Almar-Naess, 1985). This platform and its capsizing status can be seen in figure (1). In 1979, a jackup rig in the Gulf of Mexico suffered an accident, which the cause of that accident was also stated as the onset and expansion of cracks due to fatigue in welded joints. Such that, about 500 millimeters of a fatigue crack, initially with an angle of 270 degrees and then with an angle of about 90 degrees had stretched and had led to the failure of the structure (Publication Document 6493, 1980). 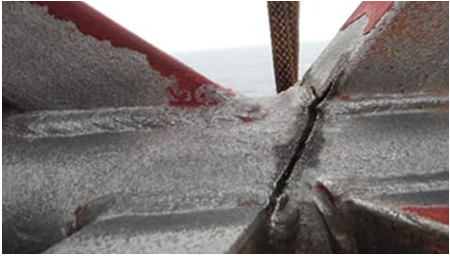 | Figure (1). Crack caused by fatigue in a joint |
Based on the studies of Ali Yaghteen and Hassan Sayadi (1398), it was determined that the life of the Iran Khazar jackup platform is about 18 years. This study was conducted under conditions prevailing in the Caspian Sea. So that the significant wave height and the speed of sea current have been assumed 12 meters and one meter per second, respectively. And the interaction between soil and structure has been modeled with elastic springs. This research has been carried out using ANSYS’s finite element software. Prior to that, the life of the studied platform had been evaluated using Sacs software, which the life of the platform had been determined to be about 20 years. This discrepancy represents an error of about 7.5% between the results of the two software that is acceptable. In the abovementioned research, the recommendations of the API guidelines have been used, which after the nonlinear dynamic analysis and the determination of the critical joint, the fatigue analysis was performed on that joint. Also, the researchers concluded that in designing the present platform, considering the direction of the dominant wave alone could satisfy the design conditions. Behrouz Asgarian and Parviz Kuzehgar (2011), in their studies on the subject of fatigue in the joints of a sample platform (SPD 10) present in the Persian Gulf, they showed that considering the local joint flexibility causes a decrease in the predicted breakdown due to fatigue in the joints, and the results of the research have advantageous effects on the optimization of underwater inspection schedule. The above-mentioned research has been carried out using finite element software OPENSEES and by spectral analysis method. Mohammad Hossein Mohassel et al. (2010) performed a study on the fatigue phenomenon in the piles of a sample template platform under the environmental conditions of the Persian Gulf. In this study, SACS software was used for static and dynamic analysis, and the GRLWEAP software was used to analyze the installation and driving of the piles. The fatigue analysis of the pile was performed by the classical method on the South Pars Phase 12 platform with two profile types of clay and sandy soils. This study showed that the peripheral and driving fatigues of the pile in the sand are more than in the clay. Also, to reduce the damage of the driving fatigue in the pile, two types of the hammer with the same performance can be used at different depths.
2.1. Fatigue
In general, the fatigue phenomenon is considered and studied in three main stages:• Initial cracking• Spread of cracking• Final fractureIn summary, the initial stage of the cracking in the member and the joints is within the range of the microscopic behavior of the materials. These cracks are usually formed due to the special geometry of the joint and the secondary effects and imperfections of the weld site, which occur either in the form of very tiny internal cracks or at the welding surface. Compared to the initial cracking, the stage of the spread of the crack is more recognizable, which fits in the framework of the theory of fracture mechanics. In addition, the depth of the initial cracks and the geometry of welds also have a significant effect on the spread of the cracks. This stage has the most important impact on the calculation of the fatigue life. The stage of final fracture takes place when the spread of cracks reaches its critical level. The final failure depends on some factors such as stress level, crack size, and the hardness of the material. Like the initial cracking stage, the final fracture stage has also little importance in the fatigue life.In general, fatigue analysis is performed for structures that are sensitive to alternative loads such as wave loads (in jackets, floating structures, etc.), wind (in the burner boom, staircase towers, inter-platform bridges, etc.), rotary equipment (the structures on which such equipment is connected to), repetitive stresses (driven piles, etc.). The most important parameters for the determination of the fatigue life are, stress range, the number of cycles, stress concentration coefficient, dynamic behavior, S-N curve or repetition-stress curve, figure (2).
2.2. Fatigue in the Offshore Platforms
The wave load is the major force applied to the offshore platforms. The wave load, due to its repetition, causes fatigue in the members and joints of the structure. Due to the concentration of stress and welding defects in the platform joints areas, they have a high sensitivity to fatigue failure.
3. Fatigue Analysis Methods
Fatigue analysis of platforms is mainly performed with the two deterministic and spectral methods. According to the API-RP 2A regulations and the paragraph 1-5 of this regulation, in the design of tubular joints, the necessary assessments for fatigue caused by alternative stresses in the joints must be performed, and for this purpose, the detailed fatigue analysis for the structure should be performed. Of course, the regulation suggests that spectral analysis should be used. Also, in platforms with a period less than three seconds and the height of less than 122 meters, and in case of the absence of access to an accurate analysis, the regulation recommends a simplified method in accordance with section C5.2 [3].
3.1. Deterministic Method
The foundation of definitive analysis is based on this principle that a limited number of waves with a specified height and period from all peripheral states of the fatigue or, in other words, the sea state existing in the wave dispersion diagram, are selected as deterministic waves. The selection of these waves is based on the contribution of each sea state in the wavelength dispersion diagram. These waves are assessed discretely and are combined such that they have the highest impact in fatigue damage. Each of these specific waves is considered at various wave crest states and in sufficient numbers. Then, these crest wave states are combined in such a way that the maximum and minimum values of stress and consequently the range of stress in the members and joints of the structure are achieved. The structural responses, which include the range of nominal stresses in the joints and members of the structure, are converted separately into the stresses of hot spots at the peripheral spots of the joint for each of these waves by applying the proper stress concentration factor (SCF) for each joint. After identifying the stresses of the hot spots, according to the number of occurrences of each wave in a given time period (in accordance with the waves dispersion diagram), and using the Palmgren -Miner law (relationship 1) of the linear cumulative fatigue damage theory, the fatigue damage rate for each wave is obtained. Finally, the overall fatigue damage of a spot in the joint periphery, for all of the waves during the useful life of the structure is obtained from the sum of fatigue damage for each of the waves. The description of this approach is in the following general form:• It is performed in the time domain.• In this method, the wave energy is simulated using the sum of a number of independent waves with specific frequency, height and event numbers, and are applied separately to the structure, and the structural response and critical stresses are obtained separately for each of these waves in at least eight peripheral joint points (with a distance of 45 degrees). • Then, the damage due to the overall fatigue of the structure is calculated from the sum of the damages of these wave loading states (which is the ratio of the number of loading cycles to the number of joint failure cycles) during the useful life of the structure. Typically, due to the ease of use, the deterministic method is more practical than the spectral method, nevertheless, both DNV (Det Norske Veritas) and API (American Petroleum Institute) regulations consider deterministic method and static equivalent analysis under the conditions that the depth of water is less than 122 meters, the materials are soft and formable, and the natural period of the structure is less than three seconds. To determine the amount of damage in a platform the cumulative damage models for failures caused by fatigue that is known as Miner’s rule should be used: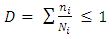 | (1) |
n: number of cycles of each stressD: damage rateN: number of permissible cycles of a specific stress
3.2. Spectral Method
Spectral fatigue analysis is used to evaluate the dynamic response of the structure to the wave height range and the frequencies corresponding to the dispersion diagram. This structural response considerably includes all states of the waves influential in the damage caused by fatigue. The spectral dynamic analysis is performed based on the spectral (wave spectrum) density function in each sea state. Such that, the sea waves are modeled according to the wave dispersion diagram model as a set of sea states. And instead of applying each sea state with a specific height and period to the platform, its spectrum (in the frequency domain) is applied to the platform and transformed to the hot spot stress spectrum in the peripheral points of the joint by the transfer function. The spectral dynamic analysis method is a method in the frequency domain and it is based on the assumption that for a specific period, the force is considered proportional to the wave height. Therefore, in order to create a transfer function for spectral analysis, the expression for the nonlinear drag force in the Morrison equation should be linearized with one of the proposed methods of the regulation such as the use of the steepness of the continuous wave. In a the dynamic analysis in deep waters under the influence of large storm waves, the dominant wave force consists of the drag force that is nonlinear, therefore, for a proper response, these structures should be dynamically analyzed in the time domain [4]. Among the important parameters in fatigue analysis, we can mention the number of wave cycles, nominal stresses, hot point stress range, stress concentration coefficients and repetitionstress curves. These definitions have briefly been summarized below. Due to the geometry of the constituent members of the marine structures, and especially the template platforms, which are often accompanied with shape and crosssectional variations in the joints, and also, the use of welding in the joints, most of these joints get lots of stress concentrations. Therefore, in the majority of structural joints, tensions at the location of the joint on both sides of the main member and the minor member are significantly larger than the nominal stresses. It should be noted that nominal stresses are directly derived from the structural analysis. The type of welding profile and connection geometry are influential in determining the amount of stress concentration coefficients. This coefficient is obtained using experimental results or finite element analysis. Some of the relationships presented in the current regulations are given below. Stresses do not remain uniform in mechanical joints, including the main and minor members, figure (2). 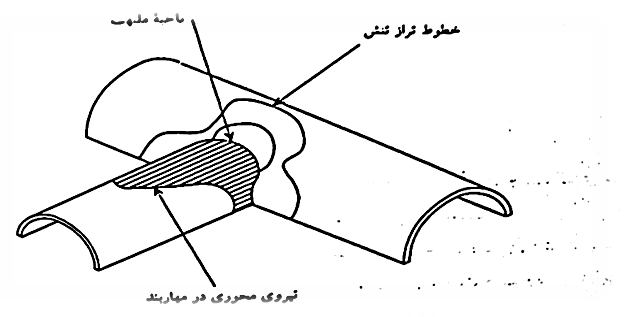 | Figure (2). A view of a T joint and the illustration of stress in the inflamed area |
The stress at the toe of a joint weld, which is, in fact, the same as the hot spot stress range. The stress concentration factor is, in fact, the ratio of the hot spot stress range (HSSR) to the range of nominal brace stress at the junction.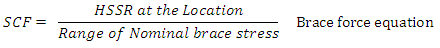 | (2) |
The hot spot stress range (HSSR) is computed at least at eight points of the periphery of the joining point of the main member to the minor member. The API RP 2A API regulation prefers Efthymiou's relationships for overlapping and non-overlapping nonreinforced tubular joints. It also recommends Lioyd equations for reinforced tubular joints. In this regulation, some minimal values have been presented for stress concentration, which generally for tubular joints, for this minimum of the axial and flexural stress concentration coefficient for the main and minor members, figure two has been recommended. For internally reinforced joints figure 2.5 and for overlapping tubular joints and externally reinforced joints with pendentive or circular hardener, figure six have been recommended for this coefficient. In offshore structures, most joints are multi-planar, which for the calculation of stress concentration coefficients, they are examined separately at each plan and the highest coefficient among them is selected as the stress concentration coefficient at the joint. The geometric parameters for tubular connections are given in the DNV regulation. The presented parameters include (figure 3):D: main member diameter t: thickness of minor members T: thickness of main member or base L: length of the member Θ: the angel between the two members g: Horizontal distance between two braces at the toe of the weld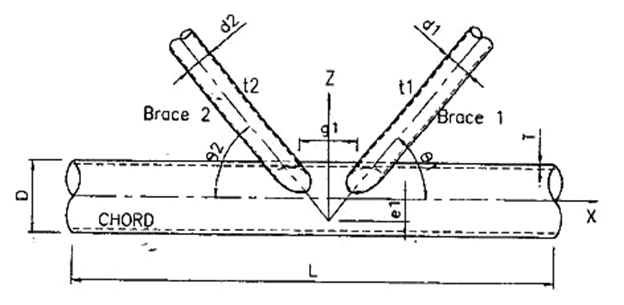 | Figure (3). Geometric Parameters of Tubular Joint (DNV) |
The forces applied to the members of a joint at the site of the weld, as well as the eight peripheral spots of the joint for calculating the hot stress spot, are shown in figure (4). The axial load (N), in-plane bending moment (IPB), and out of plane bending moment (OPB) can be seen in the figure 4. 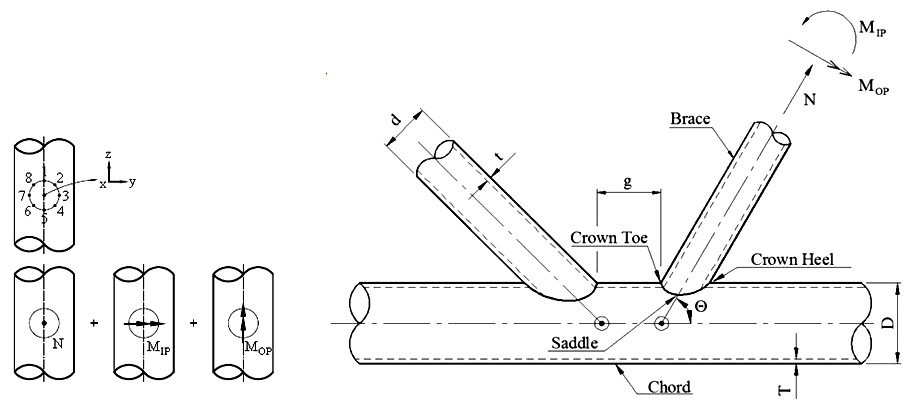 | Figure (4). Forces Applied on a Joint |
Hot spot stress (HSS) in the periphery of a joint is calculated from the recommended relationship in the DNV regulation as follows and it is used in the repetition-stress diagram [5].  | (3) |
DAF: dynamic amplification factor Z: basis of the cross-section inplane bending moment stress concentration factor
 Out of plane bending moment stress concentration factor
 angle between peripheral spots
3.3. Repetition-Stress Diagrams
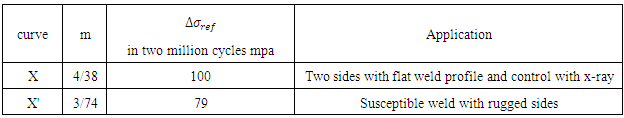
The recommended diagrams in API regulation, which are in the two x and x' states [3], figure (5).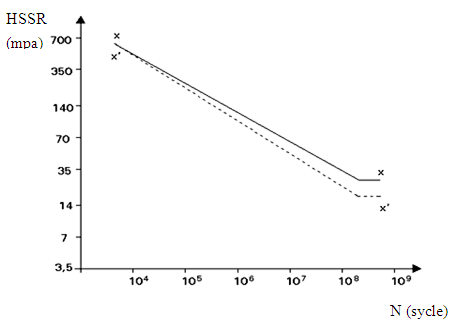 | Figure (5). These curves are plotted according to the following equation: |
 | (4) |
N(s): Number of permitted cycles existing stress
 experimental standard stressm: curve slopewhere the slope of these diagrams is given in the following table:
Table (1). Characteristic values of the equation of the S-N diagrams
 |
| |
|
The curve X is considered for a state where the weld profile is controlled and the thickness of the minor member is less than 25 millimeters. If the thickness of the minor member is less than 25 mm, the correction of the effect of the thickness is done according to equation (5) in the following.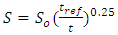 | (5) |
So: allowed stresse obtained from S-N CurvesS: allowed stresst: thickness of the minor membertref: 16 mm for X ' curve and 25 mm for X curveX' curve, is for the case where the welding profile is not controlled but conforms to the smooth profile of the AWS standard. By the way, this curve is used when the thickness of the minor tube is less than 16 millimeters. The correction of thickness will be done similar to equation (5).
3.4. Modeling a Sample Platform in Abacus Software
The depths of the platforms in the Persian Gulf are generally less than 100 meters, and also due to the relative rigidity of marine structures such as jackets because of the type of their welded joints, the natural period of these structures often does not exceed 3 seconds [6]. Due to the geometry of fixed metal platforms in the Persian Gulf and the installation depth of these platforms, which are usually between 60 and 80 meters, an example fixed metal platform similar to the specifications of the implementation plan of the SPD15 structure (Prepared at National Iranian Oil Company) has been modeled using Abacus 2016 software under the environmental conditions of the Persian Gulf (Fig. 6). The present platform (substructure), with a total height of 73.85 meters from the sea bed and at a depth of 66.6 meters, has been modeled. It has been drawn in three-dimensional form, and of the coordinate type with wire members, which are joined together in the form of a fixed connection. These members have been defined with pipe profiles, and three-dimensional beam elements, which have the capability of incorporating rotations, bending, and displacement at the ends of each element. This platform has been modeled using B32 element in the partitioning and in the form of fixed at the end of the legs at the bottom of the sea, figure (6). Due to the high hardness in this model, the natural period of this model is about 1.3 second. This modeling has been done without taking into account the interaction between the soil and the structure. Also, the natural period of the Resalat template platform with four legs and at an approximate depth of 68.2 meters, which is about 3.2, has been modeled using ANSYS software [7]. Also, the SPD19A platform, with a depth of 54.5 m and a height of 70.55 m, has a natural period of 2.32 using SACS. [8].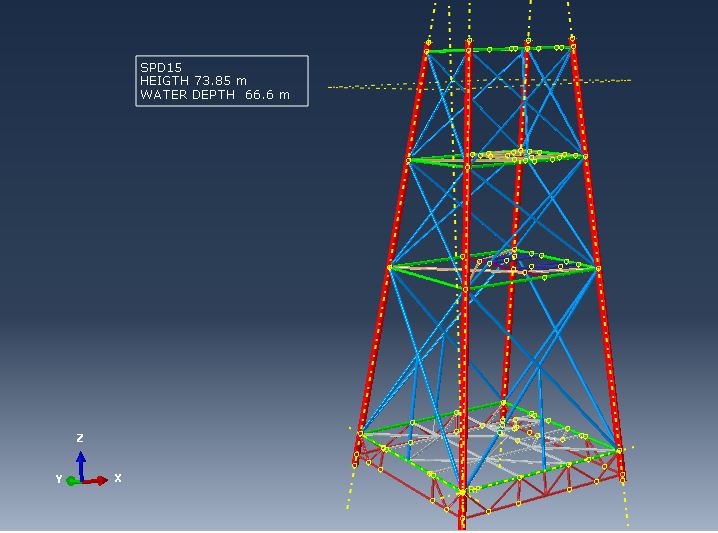 | Figure 6. The Platform Modeled using Abacus Software |
 | Figure 7. The First Six Modes of the Simulated Platform |
4. Results
In this research, first the importance and the process of fatigue analysis in the fixed offshore platforms has been discussed, and then the stages of analysis by deterministic and spectral methods have been described. With regard to the similar geometry and hardness of metal platforms in the Persian Gulf region and the natural period of these structures, which is generally less than three seconds, the deterministic method can be used to analyze the fatigue of these platforms with a good accuracy. Considering the applied method in the analysis, the definite analysis has a lower time and cost compared to the spectral analysis. Therefore, with confidence in the results of the deterministic analysis, we can use this method for the platforms in the Persian Gulf. Considering the useful life of the existing platforms in the Persian Gulf, which is about 25 to 50 years, most of these platforms are in their final years of their life, which this fact makes the seismic analysis of these platform important as well.
References
| [1] | Tabeshpour, M. R., Komachi, Y., Golafshani, A. A., Assesment and Rehabilitation of Jacket Pelatforms, 2012. Prof, Abbas Mustafa (Ed), ISBN: 978-953-53-0123-9. |
| [2] | Almar-Naess, A., 1985. – Fatigue Handbook – Offshore Steel Structure. Tapir, Trondheim, Norge, 520p. |
| [3] | American Petroleum Institute, 2002, “API RP 2A - WSD. Recommended Practice for Planning Design and Constructing Fixed Offshore Platforms. Working Stress Design,” 21st Edition. |
| [4] | Anastogtopoulos, S. A., 1982. Dynamic Response of Offshore Structures to Extrem Waves Including Fluid-Structur Interaction. Eng structures, Vol.4, pp 179-185. |
| [5] | Det Norske Veritas, October 2001, “DNV. Recommended Practice RP- C203, Fatigue Strength Analysis Offshore Steel Structures.” |
| [6] | Zaynoddini, M., 2005. The Design and Implementation of Fixed Oil Platforms. First print, National Center of Oceanographic Sciences, Tehran, 340. |
| [7] | Mohajer Nasab, S., Dastan, M. A., Tabeshpour, M. R., Seyf M. S., Mehdigholi, H., 2013, The Application of NewWave Theory in the Endurance Wave Analysis (EWA) for the Evaluation of Fixed Base Platforms Under the Loading of the Persian Gulf Waves. Journal of Marine Engineering, Fall, and Winter of 2013, Ninth year, No. 18, pp. (71-82). |
| [8] | Documents of the National Iranian Oil Company. The Calculations of the In-Place Analysis of SPD19A Platform, Document Number: SP19 -P0-ST-A-8021. |

 Abstract
 Reference
 Full-Text PDF
 Full-text HTML