-
Paper Information
- Paper Submission
-
Journal Information
- About This Journal
- Editorial Board
- Current Issue
- Archive
- Author Guidelines
- Contact Us
Marine Science
p-ISSN: 2163-2421 e-ISSN: 2163-243X
2017; 7(1): 1-9
doi:10.5923/j.ms.20170701.01

Coastline Mobility of Goree Island (Senegal), from 1942 to 2011
 Abstract
 Reference
 Full-Text PDF
 Full-text HTML
Bakhoum P. W.1, 2, Ndour A.3, Niang I.3, Sambou B.1, Traore V. B.2, 4, Diaw A. T.2, Sambou H.1, 2, Ndiaye M. L.2
1Institute of Environmental Sciences, Cheikh Anta Diop University, Dakar, Senegal
2Geoinformation Laboratory, Polytechnic High School, Cheikh Anta Diop University, Dakar, Senegal
3Department of Geology, Cheikh Anta Diop University, Dakar, Senegal
4Hydraulics Laboratory and Fluid Mechanics, Cheikh Anta Diop University, Dakar, Senegal
Correspondence to: Bakhoum P. W., Institute of Environmental Sciences, Cheikh Anta Diop University, Dakar, Senegal.
| Email: |  |
Copyright © 2017 Scientific & Academic Publishing. All Rights Reserved.
This work is licensed under the Creative Commons Attribution International License (CC BY).
http://creativecommons.org/licenses/by/4.0/

This current study aims to quantify Goree island littoral evolution from 1942 to 2011 in the context of sea level rise. Digital Shoreline Analysis System (DSAS), in ArcGIS software was used to extract shoreline positions based on satellites and aerials photography (1942, 1966 and 2011) and estimate historic rate of change. Rates of change statistics were calculated using End Point Rate (EPR) and Net Shoreline Movement (NMS). In this study, EPR was calculated by dividing NMS by elapsed time between earliest and latest measurements for each transect. Results obtained show that shoreline between 1942 and 1966 retreated (-4m) at an average rate of -0.16m /year, compared an average of -0.06m / year between 1966 and 2011. This dynamic can be interpreted as result of project to preserve and restore Goree island (1979-1981). Slave house, mosque of island, Mariama BA School, and historical museum are the most sector affected by erosion. Analysis of results showed that causes are more natural than anthropic. These results provide coastal erosion specialists with valuable information for warning, prevention and adaptation measures against natural disasters such as flooding.
Keywords: Coastal erosion, Shoreline, Aerial and satellite photography, DSAS, Goree, Senegal
Cite this paper: Bakhoum P. W., Ndour A., Niang I., Sambou B., Traore V. B., Diaw A. T., Sambou H., Ndiaye M. L., Coastline Mobility of Goree Island (Senegal), from 1942 to 2011, Marine Science, Vol. 7 No. 1, 2017, pp. 1-9. doi: 10.5923/j.ms.20170701.01.
Article Outline
1. Introduction
- Nowadays, Coastal erosion is a problem that concerns most of the world's sandy coasts and islands at the first level of this crisis. Studied throughout the world, this process of receding the coastline currently affects more than 70% of the [1]. According to [2], erosion rates on the sandy areas of Senegal to Sierra Leone vary from 1.2 to 6 m / year. Rising sea levels as a result of climate change are conspiring with coastal erosion to slowly submerge communities along the West African nation’s coast [3]. According to [4], awareness of the quality of global coastal ecosystems being adversely impacted by multiple driving forces has accelerated efforts to assess, monitor and mitigate coastal stressors. Studies on the coastline dynamics on the Senegalese coastline estimate these rates between 1 and 1.3 m / year with strong spatio-temporal variations which make it possible to qualify certain sectors that are very vulnerable to coastal erosion such as the (langue de Barbarie), the Sangomar arrow, the coast of Saly, the Bay of Goree, etc. [5-10]. The later add that coastal zone and its resources represent an important component of the development of West Africa countries. In Senegal, according to [11], 4.5 million persons (66.6% of the population) live around the coastal area of Dakar, the capital city, where approximately 90% industries. Erosion processes in the Bay of Goree which includes the coast of Goree, Hann Thiaroye, Mbao, Rufisque and Bargny have been studied by many authors such as [5, 10, 12-19]. No study in this sense has been carried out on the island until today, which justifies the interest in this study of coastline’s evolution of this island. The diversity of the time steps considered, the spatial scales and the methods used in these work lead to a strong heterogeneity of the values of retreat or advancement of the coastline along the Bay of Goree where the general rule is the erosion of this coast being able to reach several tens of meters per year. In Rufisque, for example, shoreline retreat phenomena began in 1937 [5], with an average decline of 1.30 m per year for the period 1937-1950 With strong spatio-temporal variations; 1.5 m / year for the BATA zone between 1954 and 2006 [10]. According to [7], Hann-Thiaroye area is characterized by very low erosion between 1954 and 1978 (less than 10 cm per year), but greater between 1978 and 1997 (about 60 cm per year); in Mbao, it is on average close to 1 m / year for the period between 1954 and 1997. For Bargny the rates are 2.5 m / year [20]. Goree commune has been classified as a world heritage of humanity since 1979 by UNESCO with the aim of developing a policy of safeguarding for the future generation. Thus, the study on the evolution of the coastline enters perfectly within this same framework. According to [3] historic shoreline change information, which portray a cumulative outcome of the processes that altered the shoreline for the periods analysed, facilitate formulating effective coastal management strategies and planning by revealing trends. The dynamics of Goree island have been marked in recent years by cracks on public buildings such as slaves’ house, wall collapses, recurrent floods and loss of beaches. This article aims to quantify the island littoral evolution to analyze its degree of vulnerability in the face of sea level rise indicated as one of the main causes of this problem. This will allow to alert national and international populations and decision-makers of the current state of affairs at the world Heritage level. The human and industrial concentration within this bay has resulted in an increasing need for infrastructure (extension of Dakar port, supply channels for cooling water for certain plants) and building materials (sand, shells), but also made more sensitive to coastal erosion phenomena, which required the construction of protective structures. These different human activities interfere with coastal processes, in particular by reducing sediment inputs. They must contribute to accentuate the phenomena of coastal erosion, especially since the entire coastline bordering the Bay of Goree is undernourished from the point of view of the sedimentary contributions [5].
2. Materials and Methods
2.1. Study Area
- Goree is an island community in the Dakar region, located 3.5 km of Dakar. Its area is 18.94 hectares; it extends from south to north on 909.51 meters long and from east to west on 358.48 meters wide. The island of Goree belongs to the Senegal-Mauritanian basin. It presents a geomorphological profile marked by 2 zones with distinct geological characteristics, [21]. According to a north-south orientation, there are two different zones due to the nature of the materials and their period of emplacement (Figure 1): a high zone, located in the south of the island characterized by a cliff by the first finite-tertiary volcanic episode that takes place between the Oligocene and the upper Miocene. It manifests itself in effusions of basalt; (ii) a low zone, which is located in the center and more to the north of the island and consists essentially of limestone and silts of tertiary age. This lower part corresponds to a raised beach on which the houses are located. The dominant swells originate from the northwest (320° N to 20° E), southwest (N180° to 200° E) and west (N270°), (Masse, 1968). The largest waves originate from the northern sector and are observed from October to June. With an average height of 1.75 m, they sometimes reach 3 m. The tidal range varies between 0.5 m (period of dead water) and 1.6 m (period of vivid waters), which makes it possible to qualify the coast of microtidal. From the seasonal evolution of surface currents and upwelling, [22] distinguished 4 marine seasons whose duration and date of occurrence vary according to the year: (i) a cold season from advective to weak upwelling (November to January), which corresponds to the installation of the trade winds which are still weak and irregular; (ii) a cold to strong upwelling season (February to May) which coincides with the period when the trade winds are intense and stable; (iii) a homogeneous warm season (June-August) which corresponds to the northward rise of the Inter-Tropical Convergence Zone to the northeast trade winds and thus suppresses upwelling on the south coast, while allowing climbing to the north of the tropical hot and saline waters from the equatorial counter-current, and (iv) an unstable hot season (September to October) during which the currents are reversed with the appearance on the north plateau of currents directed southward. The island of Goree has a resident population of approximately 1680 inhabitants [23], consisting of 206 households distributed in 84 concessions. The average age is estimated at 23.4 years.
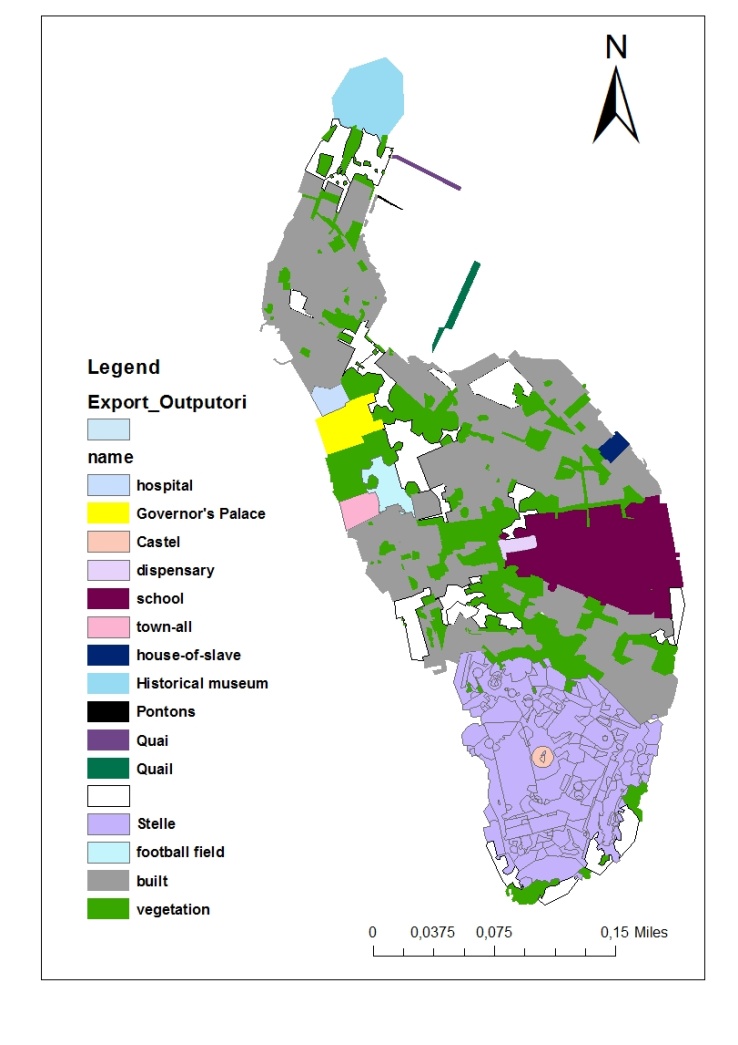 | Figure 1. Land use map of island of Goree |
2.2. Data Processing
- Methodology used in this study is based on computer-assisted photo-interpretation techniques described by many authors [8, 24-27]. It is inspired by numerous studies on the diachronic analysis of coastal evolution at the historical scale [28]. The imageries span a period of 69 years (1942, 1966, and 2011) and were acquired from the Direction of Geographic and Cartographic Works (DGCW). The images were geometrically rectified and projected into the UTM / WGS 84 / ZONE 28 North map projection system. Validation of the georeferencing was done by superimposing remarkable elements such as the historical museum, the house of the slaves, the Mariama BA School, among other infrastructures. There are more than a dozen lines of reference materializing the position of the shoreline [29], [30]. On the images we used, two shorelines are identifiable: the instantaneous shoreline (Figure 3) and the base of cliff that represents the limit of the cliff (Figure 2). The instantaneous shoreline is the position of the land–water interface at one instant in time [31]. Following the geometric corrections, we digitized the shoreline with ArcGis software on each image. Errors resulting from image registration, and digitization of the shoreline were considered. These factors of additional lags are to be assessed before drawing conclusions on the coastal kinematics [25, 28, 32-34].
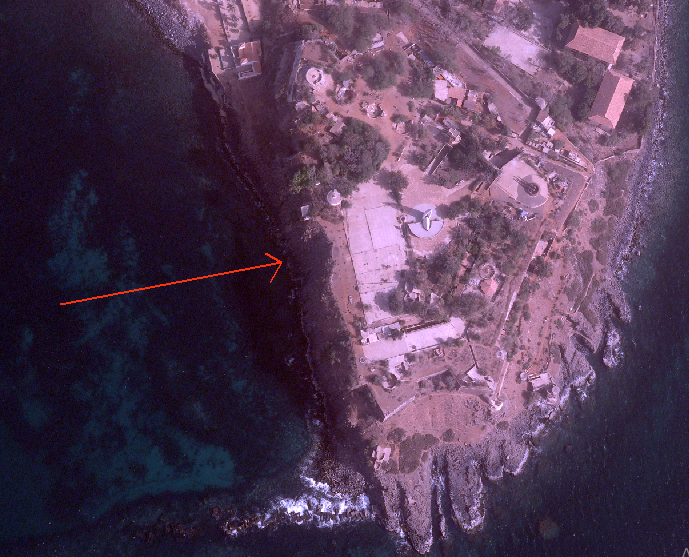 | Figure 2. Overview of the base of cliff |
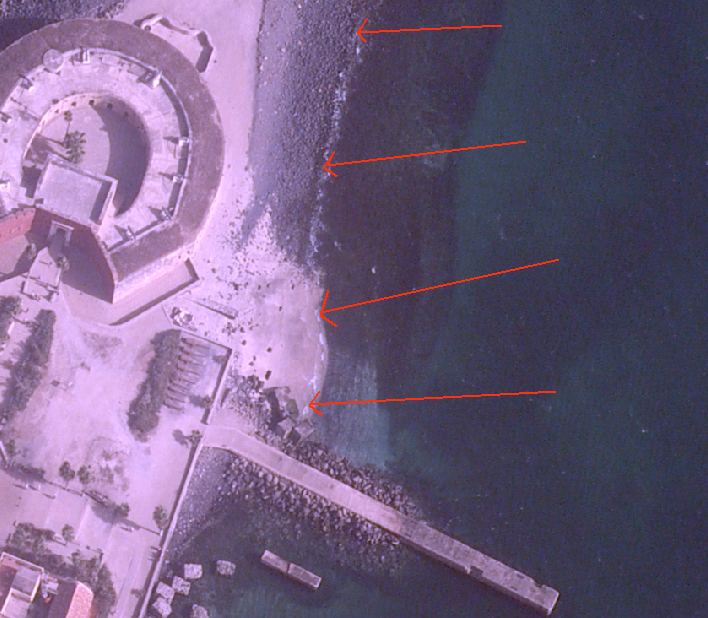 | Figure 3. Overview of instantaneous shoreline |
2.3. Shoreline Analysis and Estimation of Errors
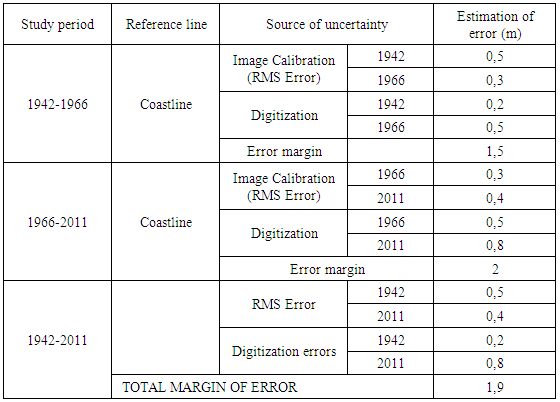
- Indeed, the photography of 2011 offers a very good ability to identify the references lines and the most important infrastructures (historical museum, house of slaves, Mariama Bâ school, mosque, Church etc.) to perform a good image’s calibration of 1942 and 1966. However, during the verification of the georeferencing, there appeared an root mean square (RMS) error of 0.4 m for the image of 2011 0.5m for 1942 and 0.3 m for 1966. We relied on the digitization approach several times [35] to estimate the margin of error induced by digitization on the screen. First, the coastline of each image was digitized several times (5 to 10 times) at two-day intervals. In a second step, the various digitized lines were compared. This repetition made it possible to calculate the average variations of the offsets recorded during the positioning of the reference lines. An accuracy of 0.2 m is obtained for the 1942 image; 0.5 m for 1966 and 0.8 m for 2011. The estimation of the various errors (georeferencing, and digitization errors) is shown in Table 1. The shoreline positions were compiled and managed in ArcGIS 10.2. two database was created (geodatabase and personal geodatabase) for the extracted shoreline positions. Each shoreline has attributes which include date, length, ID, shape and uncertainty. The date of acquisition for each image was entered for the date column while the length, ID and shape were automatically generated. Uncertainties were also quantified and entered as integers for the uncertainty column. The three shoreline positions were then appended to one shapefile for rate calculation. The Digital Shoreline Analysis System (DSAS 4.3) was used for rate estimation. The software is an extension for ArcGIS and computes rate of change at user specified interval along the shoreline using different methods. The DSAS uses measurement baseline method to calculate rate of change statistics for a time series of shorelines. The baseline is constructed to serve as the starting point for all transects cast by the DSAS application. For this analysis the baseline was constructed by manually digitizing about 2000m offshore away from the closest shoreline, taking into consideration the general orientation of the shoreline. In order to evaluate the historical evolution of the coastline, we automatically generated indicators with the DSAS 4.3 extension. These include: (i) the Net Shoreline Movement (NMS), which indicates the distance between the oldest and the most recent shoreline for each transect; (ii) the End Point Rate (EPR) which is well suited when only two shoreline are available to assess coastal kinematics. It represents the ratio between the (NMS) (in meters) and the time (in years) elapsed between the two dates.
|
3. Results and Discussion
3.1. Results Related to Evolution of Coastline
- The study of the kinematics of the coastline of the island of Goree from 1942 to 2011 testifies to an erosion of the littoral during this period, in agreement with the conclusions of [2]. Change rates were calculated for the period between 1942 and 2011 (Figure 4, table 2). The results show that there have been changes along the island coast for the 69 years period under study. Results obtained show that, shoreline of Goree between 1942 and 2011 retreated (-6,62m) at an average rate of -0.09m /year. Thus, the results may be influenced by the margin of error, particularly in the south-east and north of the island where measurements are less than or equal to ± 1.9 m. This influence is negligible for all the other segments which have recoil values well above the margin of error (1,9m).
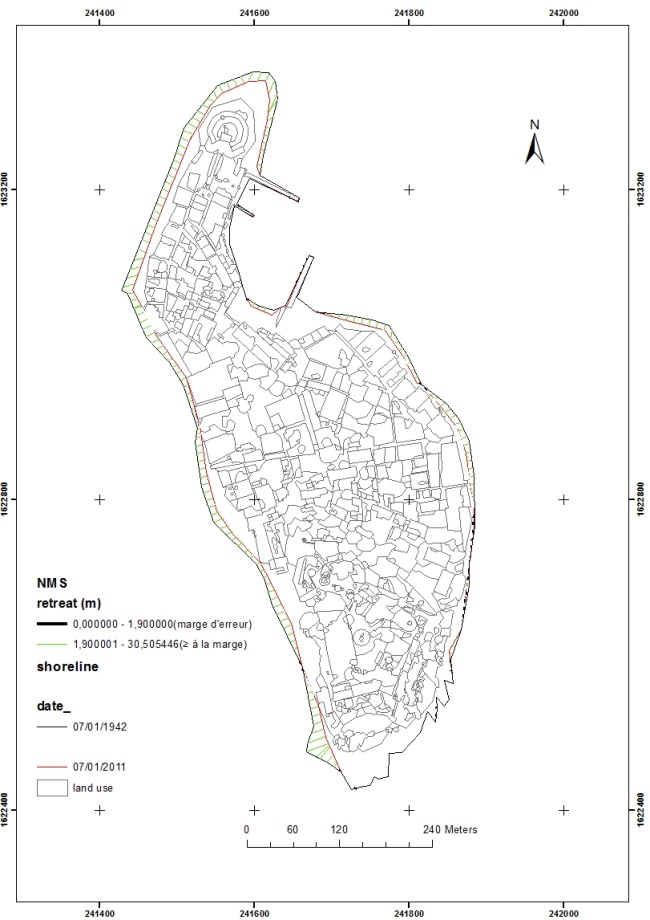 | Figure 4. Rates of Change between 1942 and 2011 |
|
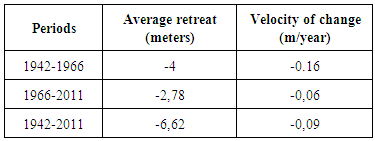
3.2. Results Related to Coastline Dynamic from 1942 to 1966
- Figure 5 illustrates the coastline dynamic of Goree Island between 1942 and 1966. The result shows that between 1942 and 1966, according to the morphological evolution, there have been significant changes along the coast (-4 m) greater than the margin of error (±1.5 m) for the 24 years period with an average rate of -0.16 m / year. The highest erosion rates are located on either side of the three wharves (quay of the launch, quay André Brue and pontoons); and the historical museum (-10 m), with an average rate of -0.41 m / year (figure 5). The higher erosion rates occur around the mosque on the western side (-11 m). This evolution could be explained by natural causes accentuated by anthropogenic causes. Among the processes likely to have modified the sedimentary contributions to the coast on a historical scale, there are drought, which has been particularly marked since 1970 [36-40]. According to [41], drought would have reduced the river intakes, not only of large rivers such as Senegal, but also of numerous small coastal river systems. In terms of sediment brings, this negative influence of drought must be reativized because the sediment from rivers such as Senegal are mainly fine silt-clayey sediments [42], which contribute little to sediments beaches. Nevertheless, although no precise measure is available, it is reasonable to assume that the sedimentary brings of coastal fluvial systems have been affected by drought, with consequences for coastal areas. [41] reveals the presence of coastal fluvial systems currently reduced or nonexistent because they have been backfilled and dried up in malaria control programs carried out during the colonial period. This is the case with the Hann lagoon system, which extended eastward as far as Thiaroye and north to the foot of the Cambérène dunes and fed an area used by both ships and the inhabitants of Gorée [43]. These lagoon systems, although mostly functioning as tailings ponds, could, during wintering periods, be discharged at the sea, [5]. Coastal erosion is also caused by natural forces such as currents, waves, storm surges, and winds, as well as anthropogenic developments [44]. Waves are active in Goree and it is considered a energy beach. This wave generates an littoral transport and the Shoreline retreat because sediments exposed at the shoreline to the littoral zone are by longshore transport. Rising sea levels as a result of climate change are also conspiring with coastal erosion to slowly submerge communities along the West African nation’s coast and this partially explains the erosion rates found in Goree. Coastal systems react to changes in mean sea level by redistributing sediments. As supply of sediments reduce along this coast the shoreline retreats [45]. Goree has been identified as highly vulnerable to increased erosion associated with sea level rise (2,32 mm/yr).
 | Figure 5. Coastline dynamic of island of Goree between 1942 and 1966 |
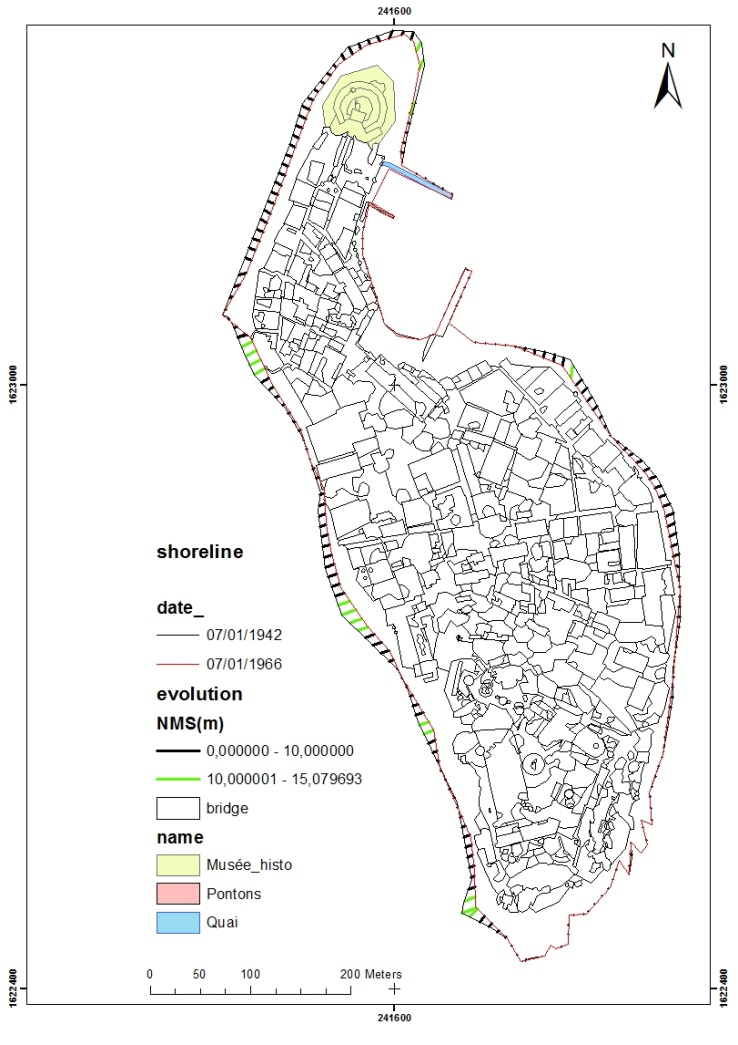
3.3. Results Related to Coastline Dynamic from 1966 to 2011
- The result shows that between 1966 and 2011, there have been changes along the coast (-2.78 m) greater than the margin of error (2 m) for this 45 years period with an average rate of -0.06 m / year. We present in (Figure 6), the coastline dynamic of Goree island between 1966 and 2011. Analysis of the results show that during these 45 years to the east of the island, the average retreat varies from -2 to -7 m between the quay of the boat and the house of the slaves, and -1 to -2 m between the house of the slaves and Mariama BA School causing the fall of its wall (Figure 7a). In the south-east of the island, there is a stabilization of the coastline with the presence of the basalt cliff. However, in the south-west, there is a retreat of the cliff with an average speed of -0.33 m / year resulting in the fall of the protection wall of the mosque (Figure 7b). This evolution could be explained by anthropogenic causes. Indeed, following the project of preservation and restoration of the island (1979-1981) which constituted a component of the overall project of development of the "Petite Côte" south of Dakar; Financing allocated for the development of certain infrastructures provided the Municipality of Goree with an amount of 2,017,000 US dollars for the construction of the quay André Brue which is a port work perpendicular to the coastline (figure 6). This port structure blocks the sedimentary transit resulting from the coastal drift especially as the openings provided under the quay for the passage of the sand were finally suppressed. According to [45], Engineering structures built along the coastline did not solve completely or stop the erosion problem but shifted it from one place to another or focused it in front of these structures. This is also the case for the Pontons and the rowboat depriving the sectors downstream of a sedimentary stock that accumulates upstream of the obstacle. Consequently the immediate shoreline near the harbor retreat. Encroaching on the sea, these ports disturb the unstable equilibrium of the nearby shoreline. In addition to submarine extractions for the recharging of shellfish streets, the basalt blocks taken on the coast in front of the Mosque and in front of the House of Slaves also participate in the retreat of the shoreline. This considerably alters the equilibrium of the coastal system, since the supply of the coast is no longer assured regularly, the shoreline is retreating. Whatever the extraction of the materials (legal or otherwise), they constitute a principal main factor of imbalance for this coastline because it accentuates the shortage of sediments in the short or the long term and consequently the retreat of the coastline, already activated by of natural factors, would be practically generalized throughout the coast. It should be noted that there are not enough studies of dynamics of the coastline more precisely in Goree from which we could compare our results, however, the rates of evolution for this period 1942-2011, are consistent with trends observed by some authors (in the literature on the Bay of Goree which covers the coast of the island of Goree [7, 9, 10, 20, 41].
 | Figure 6. Coastline dynamic of island of Goree between 1966 and 2011 |
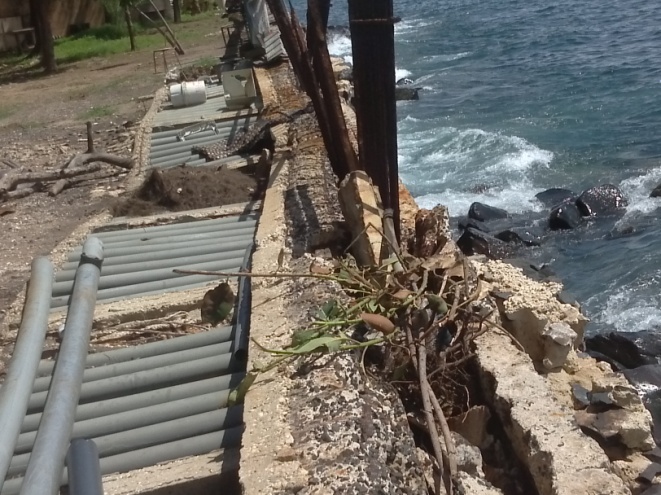 | Figure 7a. Destruction by Erosion at Mariama Bâ school |
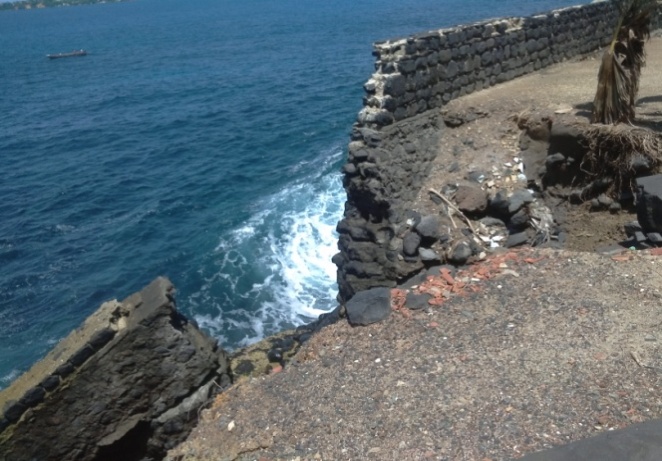 | Figure 7b. Destruction by Erosion at Goree mosque |
4. Conclusions
- This study aims to quantify the evolution of Goree island littoral using the position of the cliff base and the instantaneous shoreline to measure coastline evolution between 1942 - 1966 and 1966 - 2011. Based on mapping aerials photography, it can be concluded that Goree island shoreline is instable. The shoreline change varies in response between geographical zones and observations periods. Between 1942 and 1966, the coastline was in natural erosion at an average rate of 0.16 m / year. From 1966 to 2011, results show that the shoreline experienced an average decline of -2.78 m with an average erosion rate much lower (-0.06 m / year) compared to the period 1942- 1966. Such results provide some interesting indications for experts and decision-makers to combat and prevent flooding. Given the multiple consequences and the causes of natural and anthropogenic orders, it would be interesting in the future to study hydrodynamic processes and physical parameters of the island in order to know its degree of vulnerability to sea level rise in the context of climate change.