-
Paper Information
- Paper Submission
-
Journal Information
- About This Journal
- Editorial Board
- Current Issue
- Archive
- Author Guidelines
- Contact Us
Marine Science
p-ISSN: 2163-2421 e-ISSN: 2163-243X
2016; 6(1): 11-15
doi:10.5923/j.ms.20160601.02

Investigation of the Effect of the Circular Stands Diameters of Marine Structures and the Distances between Them on Wave Run-up and Force
 Abstract
 Reference
 Full-Text PDF
 Full-text HTML
Mohammad Ghatarband1, Mehdi Behdarvandi Askar2
1Dept. of Marine Engineering, Khorramshahr University of Marine Science and Technology, Iran
2Dept. of Marine Structures, Khorramshahr University of Marine Science and Technology, Iran
Correspondence to: Mehdi Behdarvandi Askar, Dept. of Marine Structures, Khorramshahr University of Marine Science and Technology, Iran.
| Email: |  |
Copyright © 2016 Scientific & Academic Publishing. All Rights Reserved.
This work is licensed under the Creative Commons Attribution International License (CC BY).
http://creativecommons.org/licenses/by/4.0/

Designing see platform stands has always appealed to a large number of engineers active in the field, because see platforms are one of the most important types of offshore structures for utilization of oil and gas resources. Engineers need to know as much as possible about the forces applied to these stands in order to design them in the best way. The purpose of the research is to be able to study and investigate as far as possible the applied forces and wave run-up at circular stands located in offshore regions. Flow-3D software was used for this purpose and for modeling. It was observed after modeling with different geometries that the highest run-up value occurs at 0.3 meter stand diameter and at stand number 1. Furthermore, the greatest applied force occurs in the state where stand diameter is the largest, and the distance between the stands is the shortest.
Keywords: Sea platforms, Wave run-up, Wave force, Circular stands, Flow 3D
Cite this paper: Mohammad Ghatarband, Mehdi Behdarvandi Askar, Investigation of the Effect of the Circular Stands Diameters of Marine Structures and the Distances between Them on Wave Run-up and Force, Marine Science, Vol. 6 No. 1, 2016, pp. 11-15. doi: 10.5923/j.ms.20160601.02.
1. Introduction
- In view of the fact that water, oceans and seas in particular, constitutes two third of our planet, and that the field has appealed to a large number of developed countries in recent years from the aspect of energy provision and oil extraction, and also that the field has an ever-increasing share of oil extraction and energy provision in the world (Deng et al., 2014). Today, there is great competition between developed countries to exploit more and more in the offshore field, because this field enjoys more untouched resources and greater space. Therefore, the competition makes this type of structures twice as much important (Bonnefille and Germain, 1963). As you know, the most important and the major part of offshore structure design is designing the stands on which the structure will be located, and engineers have always sought to construct this type of structures by spending the lowest cost and with the highest safety factor (Chakrabarti and Tam, 1975). Designing sea platform stands has always appealed to a large number of engineers active in the field, because sea platforms are one of the most important types of offshore structures for exploitation of these resources. Engineers need to know as much as possible about the forces applied to these stands in order to design them in the best way. Generally, one of the commonest geometric shapes in designing sea structure stands are circular, or so called cylindrical, platforms, which are superior to the other geometric shapes of sea structure stands from the aspect of ease of design as well as ease of analysis of their interaction with waves (Haney and Herbich, 1982). The tests for unlimited spectrums of wave interaction parameters with a scattered parameter KA was more than 0.6. All the three conducted studies can be displayed with linear distribution theory. With an experimental study of the interaction between waves and vertical cylinders, Wang (2012--please put his paper's title and journal name in reference of this paper) investigated and monitored wave run-up, and obtained different results (Bahadori and Askar, 2016). The theory by Isaacson (1978) showed a theoretical approach to cnoidal waves by estimating run-up in a large circular cylinder in shallow water, and demonstrated that even though cnoidal theory is less complete than wave run-up theory, it is better and more complete than linear distribution theory (Tarifi et al., 2016). Galvin and Hallermeier (1972) investigated the phenomenon of wave run-up around a large number of sections, and suggested that wave run-up distribution has been symmetrical around the circular cylinder (Hallermeier, 1976). Haney and Herbich (1982) investigated the phenomenon of wave run-up around vertical, sloped pillars. In this study, the wave run-up data have been estimated as a function of maximum velocity, and presented using wave crest velocity under a regular, nonlinear From a hydraulic aspect, in the above article, interpretation of wave run-up is more tangible in these parameters of maximum velocity and height. Even though the results have been outside the regime of scattering for a very limited range of dimensionless parameters, it is very surprising that very little scattering is observed in the results (Bahadori and Askar, 2016). Chakrabarti and Tam (1975) investigated the run-up factor by studying the relative depth factor and the wave slope factor. Also studied and investigated the same factors in supplementary form exclusively on cylindrical stands (Galvin and Hallermeier, 1972). The difference in the hydraulic and geometry characteristics causes a complexity in flow hydraulic and creates an interaction between the main channel and floodplains, resulting in an apparent shear stress and a transverse momentum transfer. This research investigates the change of the velocity on seawall crown by considering the obstacles in different layouts and slopes (Ebrahimi et al., 2015). The increase in population in coastal areas increases the importance of protection of the coasts and ports. Iran has several thousand kilometers of coastline and must provide (Bahadori and Behdarvandi Askar, 2016). The intended slopes for seawalls were 22, 27, 32, 39 degrees, respectively and had the roughness heights on wall surface were 15 cm, 20 cm and 30 cm. Moreover, four types of roughness layouts on the wall surface were investigated (TARIFI et al., 2015). A wide range of studies have been conducted in aforementioned parameters is followed by the complexity connection with symmetrical compound rectangular of the hydraulic flow. Such differences cause an channels and the investigation of the apparent shear interaction between deep flow in the main channel and stress in them as well as the effect of various parameters (Iman et al., 2016).Breakwaters are structures which are constructed in order to create peace in a pool of ports, to prevent port erosion, and to protect the shipping channel (Bahadori and Behdarvandi Askar., 2016). Apparent shear stress and transverse momentum transfer resulted from it play important roles in the calculation of flow rate and secondary flows to identify and control the sediment transport mechanism for protecting coasts, organizing rivers, designing a stable channel, analyzing scouring as well as transmitting the contamination (Behdarvandi Askar and Moghadam, 2013).
2. Materials and Methods
- The interactions between nonlinear waves and structures causes wave run-up to occur in high frequencies (Deng and Yang, 2014) in Figure 1. Deng and Yang (2014) by analyzing high frequency on waves at vertical cylinders concluded that the interactions between nonlinear waves and structures causes wave run-up to occur in high frequencies. In the present research, the following assumptions have been made for concentration on investigation of the factors being studied. The only factors effective on wave run-up and the force resulting from stand diameter and distance and effects of other factors have been disregarded, and the stands are impervious.
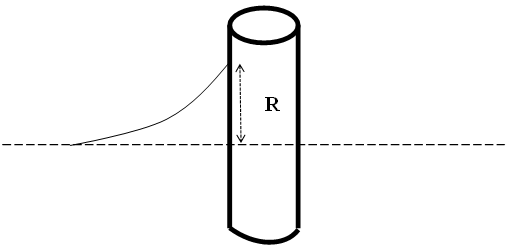 | Figure 1. Schematic image of wave run-up at a circular stand |
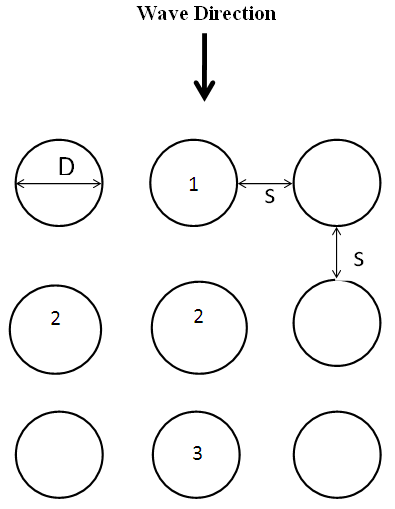 | Figure 2. Schematic index of the circular stands in regular layout |
3. Conclusions
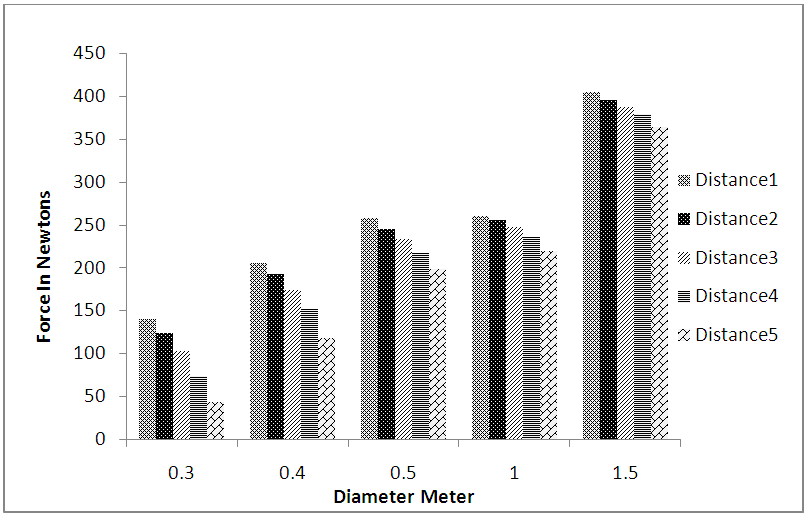
- As Figure 3 suggests, it can be found that at stand 1, the value of the force applied to the stand increases as stand diameter increases, which is also observed in Figures 4 and 5 respectively concerning stands 2 and 3. The reason for the phenomenon can be an increase in the cross section of the stand where waves hit it, because, as we know, an increase in the cross section causes one in the applied force. As Figures 3 to 5 suggest, the values of the forces applied from the waves to the stands decrease as the distances between them increase. In other words, as the stands approach one another, the values of the forces applied to them increase. The reason for the phenomenon can be that when the stands are close together, the flow passes through a narrower channel, the velocity of the flow increases. It can itself be a cause for increase in momentum and the force applied to the stands. Furthermore, if Figures 3 to 5 are simultaneously examined and compared, it can be found that the value of the forces applied to cylindrical stand 1 are in general and in all states higher than the value of the forces applied to stand 2, being also observed in the case of comparison between stands 2 and 3. This can be explained in terms of the locations of stands 2 and 3 relative to the flow path. Thus, because the group of stands, stand 1 in particular, is located in the flow path and a large amount of energy and wave force is depreciated (for stand 2 and also stand 2 for stand 3). This is the reason why less effect is observed at stands 2 and 3 than at stand 1.
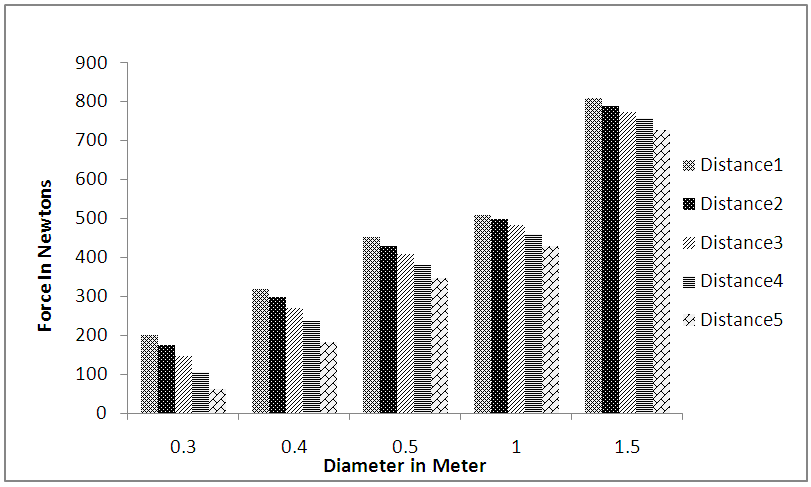 | Figure 3. Changes in force in terms of stand diameter changes at the first stand |
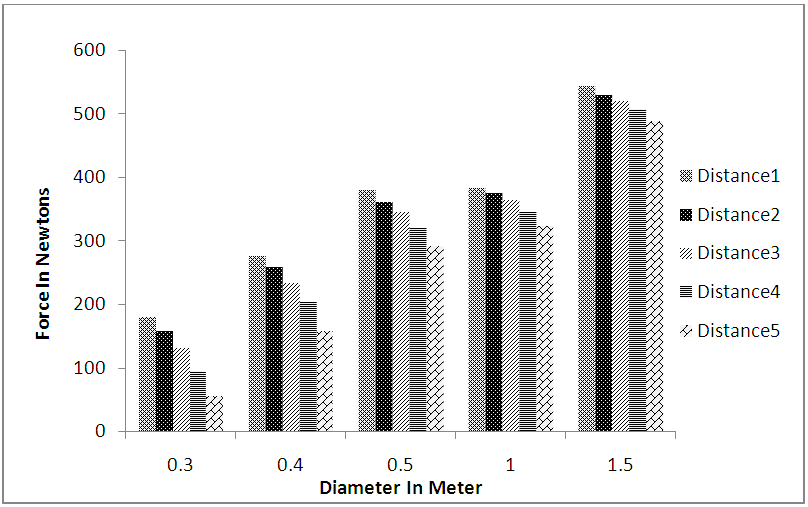 | Figure 4. Changes in force in terms of stand diameter changes at the second stand |
 | Figure 5. Changes in force in terms of stand diameter changes at the third stand |
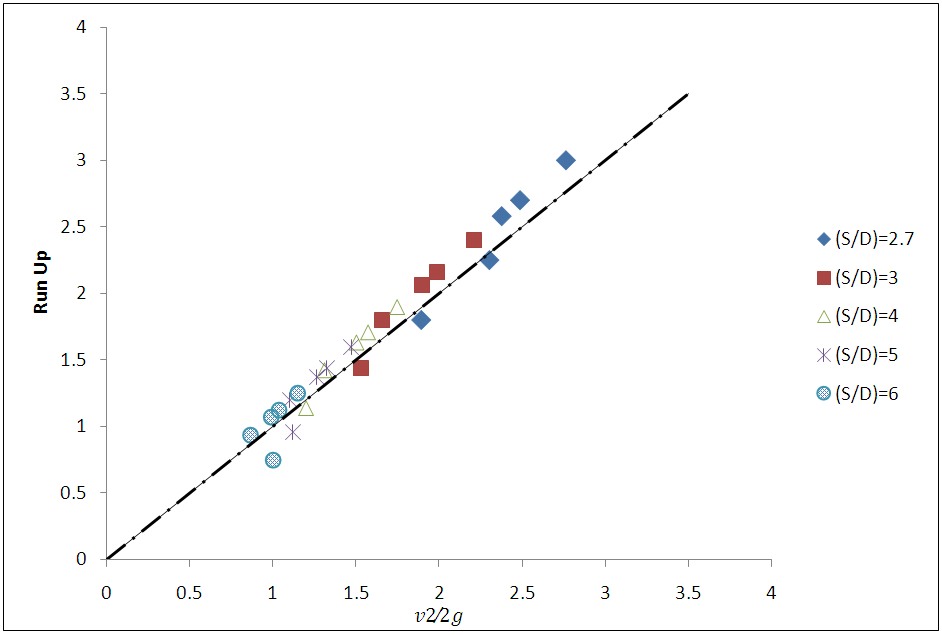 | Figure 6. Comparison between the value of run-up and the height resulting from the stagnation point |