Mansoureh Gholami
Department of Natural resources, Sanandaj Branch, Islamic Azad University, Sanandaj, Iran
Correspondence to: Mansoureh Gholami, Department of Natural resources, Sanandaj Branch, Islamic Azad University, Sanandaj, Iran.
| Email: |  |
Copyright © 2012 Scientific & Academic Publishing. All Rights Reserved.
Abstract
Zarivar lake is one of the most unique freshwater lakes in the world. A lake with an elegant and complex ecosystem which is unique in its kind. This lake is located at 2km from northwest of Marivan and is located at an altitude of 1,285 meters above sea level. In this research, the physico-chemical parameters, Zooplankton identification and investigating the seasonal variations during the annual period seasonally within 5 stations were measured which based on these species such as Brochionus, Keratella, Daphnia and Cyclops were identified. Most of the zooplankton genera identified here was observed all year round. The identified zooplankton of Zarivar Lake includes the genera of crustaceans and Rotatoria.In the study of Oxygen solution variations process with depth of lake and its clearness, we found a correlation between the oxygen solution and depth of lagoon (r=P<0.01) and a positive correlation between the oxygen concentration and traditional view depth ( r=P<0.01) was observed. Investigating the pH variations during the research, showed a fluctuation range about 7.918.
Keywords:
Zarivar Lake, Zooplankton, Physico-chemical Parameters
Cite this paper: Mansoureh Gholami, Identification and Investigation of the Seasonal Variations of Zooplankton in Zarivar Lake–Kurdistan, Iran, Marine Science, Vol. 4 No. 1, 2014, pp. 26-32. doi: 10.5923/j.ms.20140401.04.
1. Introduction
Zarivar Lake is located at the geographical coordinates of 35°32′N 46°08′E.This lake was created by the effect of regional geologic erosion and fault creation and due to the loose layers in this region and gradually settling to the bottom of the bed and land drainage and water collection were provided. Generally, Marivan region is located at the Northern Zagros folding and placed tectonically at an active region and its folding is related to Mid-Tertiary geology.Zarivar as an aquatic ecosystem ecologically has a great importance and value. Zarivar lake is the only natural lake at the heart of the Zagros Mountains where are surrounded from the west, east and north by the forested highlands. Also, around the lake is covered by the aquatic plants that hinders the progress of human's use from the lake territory.This lake is a natural genetic storage of gas for all types of plants and aquatic creatures and animals which live beside the aquatic environments and since that the main origin of its water resource are the bed spout springs, affected less by the genera transferred from the its basin.Zarivar is a lagoon in one of the most important stations for aquatic migratory birds in the winter and some of passing migrant birds in the other seasons and annually is open for 6 thousands of migratory aquatic birds and due to the natural landscapes, having smooth boundaries of coast, having a mountain wall covered with forests, fresh water with sufficient depth and ease of access, have a great potential of tourism travel (ecotourism). This lake as an aquatic habitat regarding to the different types of fish farming possess a completed capacity which paying attention to them can have some economic and recreational benefits at the region.On the other hand, the execution of plans for preparation of some villages for converting to a city, constructing the overdoor of Lake outlet area, development of agricultural and livestock activities, building tourist facilities and many anomalous interactions without the evaluation and capacity finding, this lake has been led to a critical situation and faced with a dangerous situation.Also this lake receives the waste water and wastes of marginal villages and agricultural wastewaters contaminated with the toxic materials and organic materials which caused the self-purification and useable capacity of lake to be reduced.
2. Methods and Materials
The study area and identifying the sampling stationsIn this research, the Zarivar lake is located at Kurdestan. This lake is located at 2 km northwest of Marivan city and an altitude of 1258 above sea level.Lake area was approximately 2,000 acres, its average depth about 5 m and its average water volume 45 million cubic meters (Fig.1). Lake water supply resourced were through bed springs and rainfall. Sampling was done seasonally during the winter 2010-2011 from this the lake.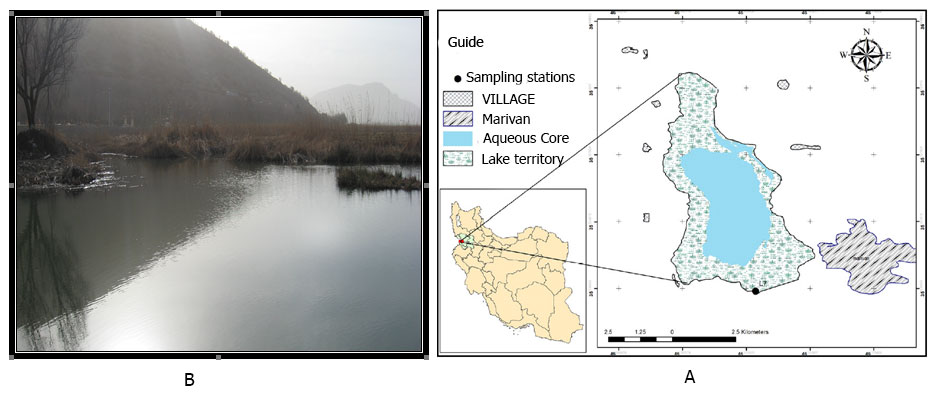 | Figure 1. A) View of Zarivar Lake location B) view of the nature of the lake in Winter-2010 |
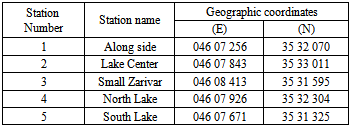
The aforementioned stations for sampling based on the trial experimental purposed of our research using GPS were selected.For selection of the stations issues such as the area, natural or artificial agents effective in the state of lake such as villages, cities, and human trafficking, distance per station in relation to these factors, a specific significant variation in the state of lake and physical- chemical and biological conditions so that a comparison can be made between the stations and access possibility and sampling per station during all seasons are considered too. Finally 5 stations were selected and identified (Table 1), therefore, we can investigate the environmental effective regions by selecting these number of stations in addition to determining the lake state.Table 1. Summary information on the geographical coordinates of sampling stations
 |
| |
|
Methods of identifying the physicochemical factors of water samplingTo determine the physicochemical factors of water resulted from the sampling was used of thermometer with an accuracy of for measuring the weather temperature, the mercury thermometer to measure the water temperature with an accuracy of 1c and pH meter (Model WTW-320) to measure the pH of water.Also, the dissolved oxygen was measured using the Winkler method (APHA 1989). Nutrients, Phosphate, Silicate, Nitrate, Nitrite were measured using the ammonia and cadmium water reclamation method (indophenol method-APHA1989, Grasshof 1983 and Moopam 1998 ) using the Spectrophotometer ( U-2000 ) and water salinity using the manual salinity meter and if possible T.S.S total suspended particles using the silver nitrate method, T.S.S total suspended particles of water is passed through a 45 size mesh and then is heated and weighed. All water soluble T.D.S materials will be distilled and weighed. COD and BOD were measured by BOD and COD meter.
3. Tools and Materials for Zooplankton Sampling
To examine zooplankton, the zooplankton mesh with 55 micron size, formalin (4%) graduated hydrobios and Bougarove Lam (0.5 and 0.1 cc) and, Stampel pipettes (0.5 and 0.1 cc), Nikon microscope, Nikon stereo and centrifugal microscope were used.Zooplankton sampling was carried out using the zooplankton 55 micron mesh and elastic mesh in a vertical manner to a depth of 3 m. therefore; a column containing zooplankton will be filtered against our considered layer. The ingredients of terminal collector storage of mesh will be gathered into a container to stabilize the samples were used of 4% formalin. Then sample's full characteristics were written on the container and samples were transferred to the Lab for more experiments. (Wetzel & Linkens, 1991).Laboratory methodFirst, zooplankton samples were poured into the besher and after making it homogeneous by volume of 0.5cc by 0.5cc stampel pipette, was counted within the Bougarove Lam. if the total number of zooplankton was less than 100, we began to concentrate the container’s water and if their number was very high (more than 300), we began to dilute the solution.After an appropriate amount of zooplankton samples, the rate (v) is noted, and after homogenization of 0.5cc inside the Bougarove Lam were identified and counted both quantitatively and qualitatively. After counting first 0.5cc First, we bagan to count the second 0.5 cc.Finally 10cc of the containers' water inside the Bougarove Lam during one or more stages were identified and counted, but during the counting of zooplankton samples in final 10cc, some species which were counted in the first and second two 0.5cc again species that were not counted, and species which were not observed in either 0.5 cc or none but counted. It should be noted that the case was counted under a microscope.In Table 2, the calculation method of the number of zooplankton per cubic meter is presented.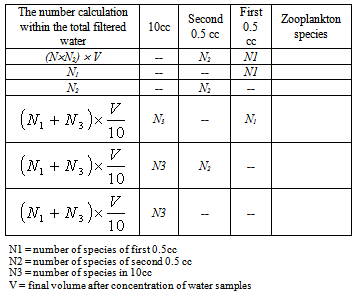 The species which are observed in both the first and second 0.5cc, namely within two repetition, gathered together and multiplied in a final volume of concentrated samples. If a species to be observed in a 0.5 cc and observed not in the other 0.5 cc and also the final 10 cc, only the same number was recorded. For example, if 4 numbers to be observed in the first 0.5cc and observed not in the next 0.5 and 10 cc, the same 4numbers will be assumed.If a species was observed in one 0.5 cc and last 10 cc and observed not in the other 0.5 cc, first its number will be calculated in 10 cc and then were collected with the number counted within the 0.5 cc.In the latter case, if a species was not observed neither of the two 0.5 cc cases and were observed only in the last 10 cc, the counted number at the last 10cc was multiplied in 0.10 of final volume. (Standard Method, 2003).
4. Discussion and Conclusions
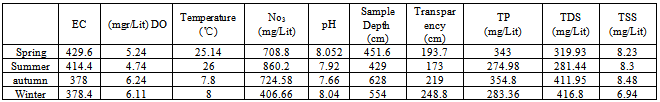
The results of physico-chemical factors in Lake Zarivar.According to data obtained from seasonal samplings, the maximum water depth in December with a depth of 780 cm in the north part of Lake and a maximum temperature of 29°C in September and its lowest level to in March to 8°C (Table 2) were observed (Fig, 2 and 3).Table 2. Average values of physico-chemical parameters of Zarivar lake throughout the year
 |
| |
|
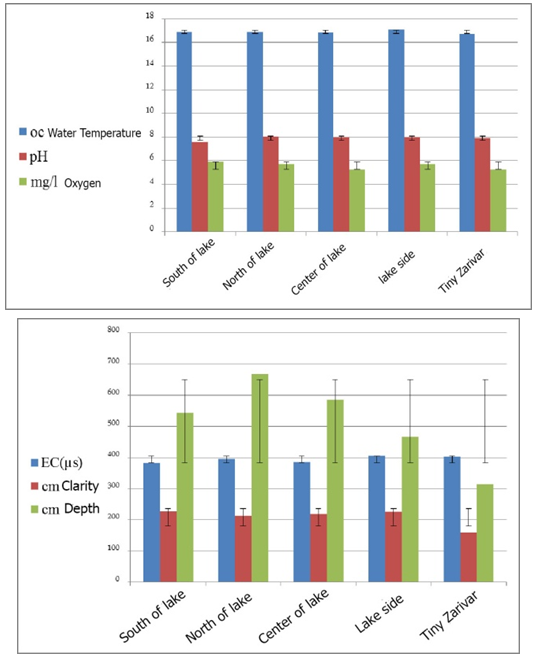 | Figure 2. Changes in the physicochemical parameters during year in the Zarivar Lake (at different stations) |
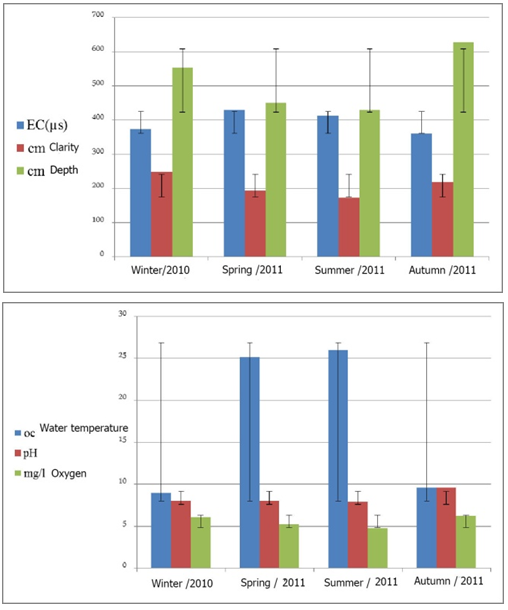 | Figure 3. the process of physical and chemical parameter changes over the year in Zarivar Lake (in the various seasons) |
The dissolved oxygen concentration with a mean of 5.58 ppm, at the time of the survey fluctuated between 4 mg in September to maximum 7.1 mg in December.In the investigation of changes in dissolved oxygen with the lake's depth and clarity shows us a positive correlation between dissolved oxygen concentration and depth of the pond (r=P<0.01) and a positive correlation between oxygen concentration and depth of the traditional view (r=P<0.01).Its average depth review clearly shows that its value during a year was 65/208 cm. Its minimum in September (135 cm) and its maximum in March (320 cm) have been observed.Studying the pH changes within this range showed us about 7.918 that its minimum is related to early September (7.2) and its maximum to November (7.9) and the average over the year and tends to be alkaline.
5. Results Related to Zooplankton in Zarivar Lake
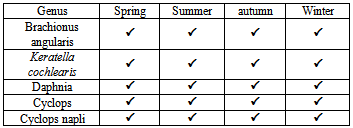
Zarivar Lake with an area of approximately 800 hectares, is a shallow lake surrounded by mountains on three sides. The south side of the lake reachs to the Marivan plain land. The average depth of Zarivar Lake is 5.38 m and maximum depth of it is about 7.5 m.Due to the dense plant growth along the shore of Marivan Lake, shoreline is vertical. A texture made from interwoven reed roots with wet mud kept secure the lake shore from erosion.Due to this, the natural fluctuations in lake water level will not cause significant changes in its area. One of the most important water sources of Zarivar is the surface runoff water such that the annual statistics is about 32 million cubic meters.Due to the low depth of the lake, overall water column across the lake has a mixed mode and therefore the Zarivar Lake seasonal lacks the seasonal thermal layering. The situation from the perspective of the fish production is an advantage in general.Although during the 10-15 years periods due to a severe cold in winter, lake surface have been freezing and reverse layering occurs. This phenomenon has a negative impact on the aquatic environment of the lake.Most identified genera of zooplankton are observed throughout the year (Fig. 4 and 5). The Identified zooplankton of Zarivar Lake is from the family of crustaceans and Rotatoria. The most abundance is related to species of Branchionus angularis with 1300 cases counted per liter (Table 3).Table 3. List of Identified zooplankton in Zarivar Lake
 |
| |
|
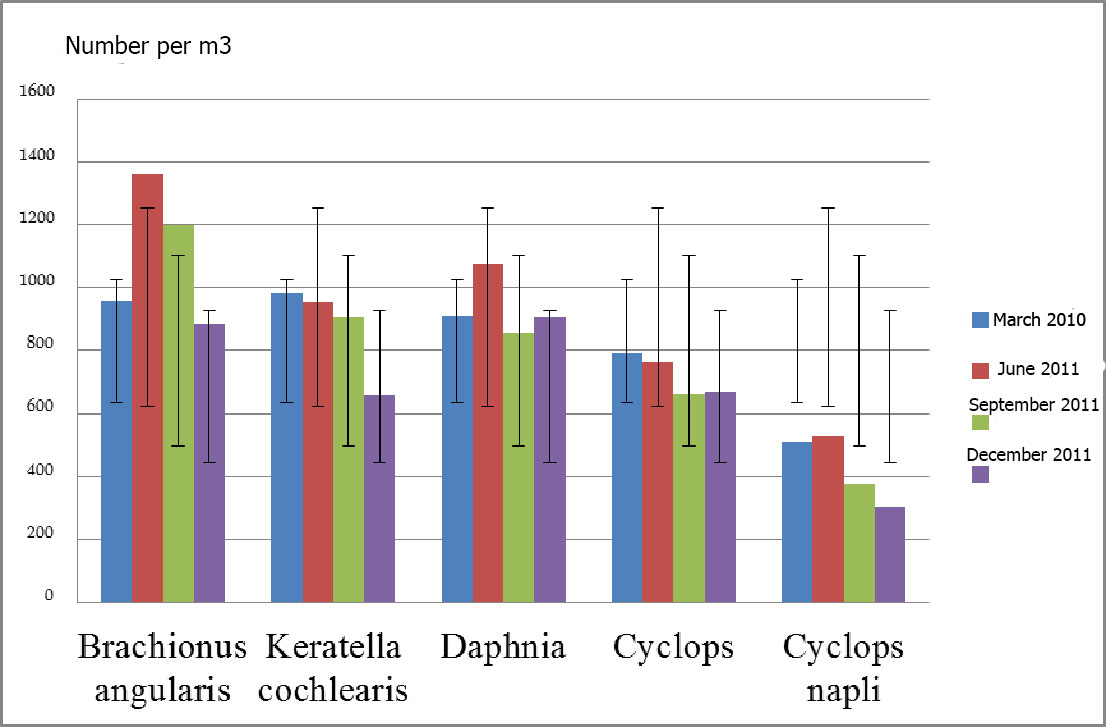 | Figure 4. Aboundance of zooplankton identified in seasonal sampling of Zarivar Lake |
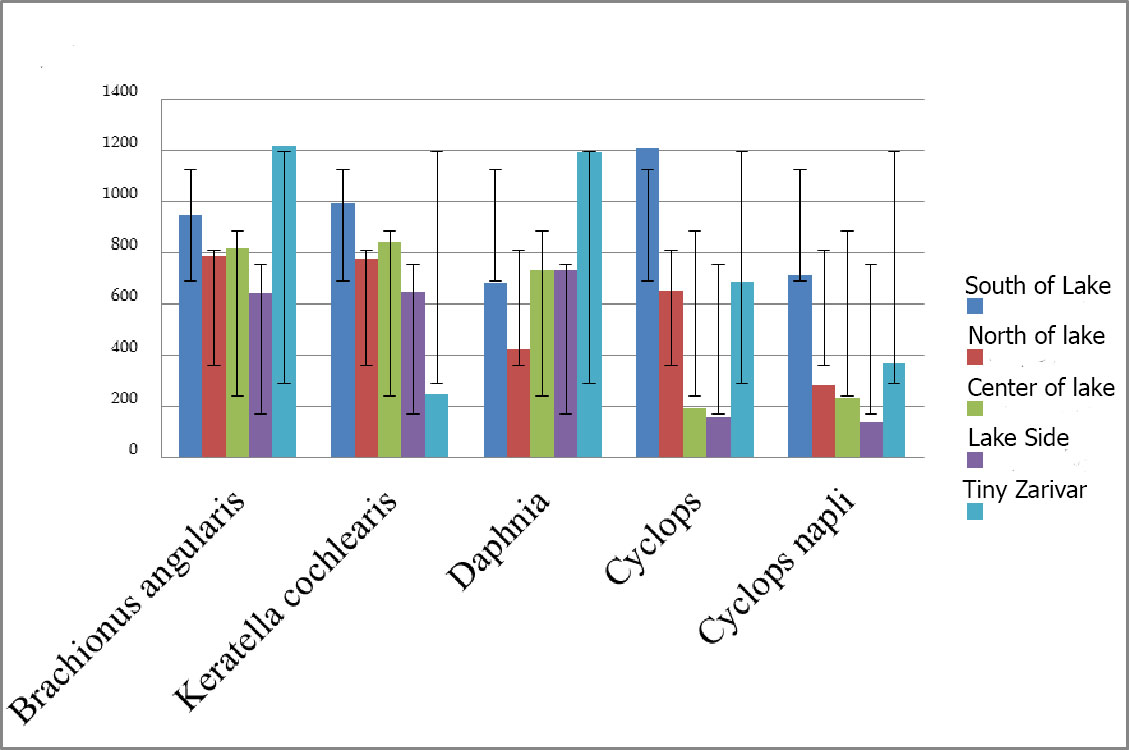 | Figure 5. Aboundance of zooplankton identified in sampling stations of Zarivar lake |
Interpretation of the correlation coefficientThe correlation coefficient may be positive (+) or minus (-). The sign of correlation coefficient shows that correlation between two variables is positive (ie, the values of both variables have a decreasing or rising trend) or negative (a variable's values has an increasing trend and other variable's values has a decreasing trend). Based on a general rule had based on the following values, the degree of correlation between variables can be judged. Remember that this interpretation is applicable for negative values: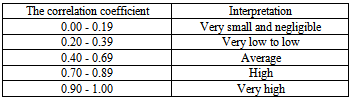 These values are not a fixed rule and have been obtained experimentally. In some texts are presented as follows:
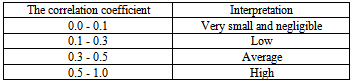 Also the statistic. Sig or the P-Value associated with the observed correlation should be smaller than the error. There is a general rule that if the correlation is greater than 0.3, the significance value would be smaller than error level 0.05.
6. Pearson's Correlation Coefficient
In the examination of the correlation between two variables if the two studied variables are in relative and spatial scale, was used of the Pearson's correlation coefficient. If the` correlation coefficient ρ and the sample correlation coefficient to be of size n from r population, r may be obtained randomly. The significant correlation test was used for this case. This test examines whether two random variables are independent and random or not. In other words, if the correlation coefficient is zero or not.This coefficient calculates the correlation between the two spatial or relative variables and its value was between 1 + and 1 - and if the value is positive, meaning that the two variables' changes occurs in the same direction, meaning that with the increase in each variable increases the other variable, and vice versa. If the r value was negative means that the two variables are in opposite direction, meaning that with the increase of a value, another variable's values decreases and vice versa.If the value is zero, indicating that there is no relationship between the two variables and if was+1, there is a positive perfect correlation and if the value was -1 then the correlation is perfect and negative.
References
| [1] | ROPME, 1999. Manual of Oceanographic observation and pollutant analyses method (MOOPAM). Regional Organization for the protection for the Marine Environment, Kuwait. |
| [2] | Wetzel, R. G. and G. E., 1991. Limnological analyses spring verlag. |
| [3] | Barnes, R. D. 1999. Invertabrate Zology. Fifth Edition, Saunders College Publishing. 893 pp. |
| [4] | Celik, K., 2002. Community structure of Macrobenthos of a shoutheast texas sand pit lake Related to water Temperature, pH and Dissolved Oxygen Concentration, Turk Zool, 26, 333-339. |
| [5] | Clesceri, L. S., Greenberg, A. E., and Trussell, R. R., 2003. Standard methods for the examination of water and wastewater. American Public Health Association. New York. |
| [6] | David R. boone, Rechard W. Castenholz, 2001. Bergey' s manual of systemic bacteriology, Second edition. |
| [7] | Ffany, H. and Britton, L. E., 1971. The Algae of lllionis, New York, U. S. A. 333p. |
| [8] | Holme, N. A. and Mclntyre, A. D., 1989. Methods for the study of Marine Benthose. IBP Hand book NO. 16. Second edition. Oxford. 387pp. |
| [9] | Nelson, S. A., 1994. The problem of Oil pollution of the sea. Adr. Mar. Biol., Vol. 8: 215- 306. |
| [10] | Newll, G. E. and Newell, R. C., 1963. Marine Plankton. Hutchinson Educational Ltd. London. 221 pp |
 Abstract
 Reference
 Full-Text PDF
 Full-text HTML