-
Paper Information
- Next Paper
- Paper Submission
-
Journal Information
- About This Journal
- Editorial Board
- Current Issue
- Archive
- Author Guidelines
- Contact Us
Marine Science
p-ISSN: 2163-2421 e-ISSN: 2163-243X
2013; 3(3): 79-90
doi:10.5923/j.ms.20130303.03
Influence of Coastal and Backwaters Coupling on Sustenance of High Nutrients and Organic Production along the Southeast Arabian Sea
 Abstract
 Reference
 Full-Text PDF
 Full-text HTML
Robin R. S.1, 2, Vishnu Vardhan Kanuri3, Pradipta R. Muduli3, M. Jaikumar4, P. Karthikeyan1, C. Suresh Kumar5, C. Saravana Kumar6
1Centre of Advanced Study in Marine Biology, Faculty of Marine Sciences, Annamalai University, Parangipettai, 608 502, India
2National Centre for Sustainable Coastal Management, Ministry of Environment and Forests, Anna University Campus, Chennai 600 025, India
3Department of Inorganic and Analytical Chemistry, Andhra University, Visakhapatnam, 530 013, India
4Aquaculture Foundation of India, No.4/40. Kabaleswarer Nagar, Neelankarai, Chennai, 600 115, India
5Institute for Ocean Management, Anna University, Chennai, 600 025, India
6Applied Microbiology, PSG College of Arts & Science, Coimbatore, 641 014, India
Correspondence to: Robin R. S., Centre of Advanced Study in Marine Biology, Faculty of Marine Sciences, Annamalai University, Parangipettai, 608 502, India.
| Email: |  |
Copyright © 2012 Scientific & Academic Publishing. All Rights Reserved.
The diversity, abundance, size fraction phytoplankton biomass and primary productivity in the shelf waters of six transects along the southern Kerala coast were studied in relation to the prevailing hydrological conditions. Southwest coastal waters of India (Arabian Sea) especially have a special environmental importance due to the formation of mudbanks, upwelling and coupling of these waters with adjacent watershed through backwaters. These coupling provides perennial source of nutrients to the adjacent coastal waters and supporting rich primary production. Result indicated that primary productivity and phytoplankton standing crop were directly tuned with chlorophyll a and nutrient concentrations. About 105 species of phytoplankton were identified in the neritic waters of southern Kerala coast. Among these, 75 species belonged to diatoms (Bacillariophyceae) and 25 to dinoflagellate (Dinophyceae). Haptophyceae was represented by two species while blue-green (Cyanophyceae), greens (Chlorophyceae), and silicoflagellate (Chrysophyceae) were represent by one species each. Phytoplankton diversity (Margalef richness d’, Shannon- Wiener H’, Pielou’s evenness J’), abundance and biomass in the waters of Paravur, Neendakara and Alleppy transects were observed to be higher relative to southern transect Veli. The nanoplankton (2-20 μm) community formed the major fraction of chlorophyll a and primary production followed by micro- (>20 μm) and pico- (0.2-2 μm), respectively. The study suggested that phytoplankton abundance; biomass and community structure played a crucial role on organic production available to the marine food web and was significantly influenced by the enrichment of nutrients from the catchment discharge and hydrographical conditions.
Keywords: Community Structure, Nanoplankton, Nutrients, Phytoplankton, Primary Production, Kerala Coast, Southwest Coast of India
Cite this paper: Robin R. S., Vishnu Vardhan Kanuri, Pradipta R. Muduli, M. Jaikumar, P. Karthikeyan, C. Suresh Kumar, C. Saravana Kumar, Influence of Coastal and Backwaters Coupling on Sustenance of High Nutrients and Organic Production along the Southeast Arabian Sea, Marine Science, Vol. 3 No. 3, 2013, pp. 79-90. doi: 10.5923/j.ms.20130303.03.
Article Outline
1. Introduction
- The Arabian Sea is a highly complex oceanic basin, strongly influenced by industrial establishments and human settlements along the west coast of India necessitate an evaluation of the type and quantum of inputs to the regional assimilative capacities. During summer monsoon, wind- driven upwelling occurs along a broad region parallel to the coast, which brings cooler but nutrient rich water into the euphotic zone, inducing a strong coupling between physical and biological processes in these waters[1]. The semi-annual reversal of coastal currents in the Arabian Sea introduces a high degree of seasonality in the physico-chemical environment[2]. The south west monsoon is the time of an equatoward current along the west coast and results upwelling[3]. During the period of upwelling that lasts from May-June to October-November and by which denser nutrient rich water is brought to the surface, leads to marked increase in phytoplankton growth thereby increasing chlorophyll a and gross primary productivity[4, 5]. Phytoplankton size structure plays a crucial role in controlling the fate of biogenic carbon (C) in pelagic ecosystems[6]. In any aquatic environment, phytoplankton growth and abundance are primarily regulated by both abiotic and biotic interactions[7]. The constant nutrient supply always supports the rich phytoplankton production, but generally nitrogen (N) and phosphorous (P) have been considered as the potentially limiting nutrients for phytoplankton growth in the aquatic ecosystems[8]. In addition to nutrients, physical properties such as salinity[9], turbidity and light availability[10] are also found to play major roles in the regulation of phytoplankton growth and their distribution in the coastal systems. In the coastal waters size of planktonic organisms largely determines their interactions and hence, the rate of biological processes [11,12]. The size and structure of phytoplankton is very important as it changes with the environmental conditions [13], reflecting the pathways of carbon cycling in the pelagic food chain[14]. Generally nutrient enrichment favors the growth of large phytoplankton[15], while the production of small phytoplankton (nano-) are mainly controlled by microzooplankton (cilites and flagellates) grazing[16,17].Any possible threat to the well being of the living resources of EEZ of India, then the coastal waters of southwest coast of India, and in particular, southern Kerala coast is the prime location prone to trigger it. The 16 major and several minor industries situated in the upstream region of the backwaters discharge nearly 0.105 Mm3 d-1 of effluents[18]. The fertilizer consumption in Kuttanad region (the main agricultural field draining to Cochin backwater) alone is reported to be 20,239 t y-1[19]. Conventional understanding of coastal waters of southeastern Arabian Sea is that the activation of mudbanks by monsoon forcing triggers intense geochemical processes leading to high productivity[20]. Mudbanks are unique in their formation and functions, and have turned out to be economically important for its rich biological resources. The holistic understanding of factors determining marine productivity requires detailed knowledge of the marine ecosystem. In this regard the present study examines changes in the environmental conditions and their influence on the diversity and distribution of different size fractions of phytoplankton (>20 μm, 2-20 μm and <2 μm) in the coastal waters of southern Kerala in an integrated manner.
2. Materials and Methods
2.1. Study Area
- A range of mountains viz. the Western Ghats on eastern side and the Arabian Sea on the Western side borders the state of Kerala. The total land area of the state is estimated as 38863 km2 in which the coastal line of the Arabian Sea sprawling on the western part is 590 km. The inshore sea area falling within the territorial limit of the state (22 km) is about 13,000 km2 and the continental shelf area of the sea adjoining the Kerala state is 39139 km2. The estimated marine fishery potential of the state is 7.95 lakh tonnes. Fisheries contribute to about ~3% to the economy of the state. The coastal low land fringing the sea extending over 590 km covers about 16.4% of the state’s total area. The 41 west flowing rivers of the state carry nearly 45,060 M m3 of water per year in to the sea. There are about 27 estuaries and 7 lagoons or Kayals in Kerala and hence well known for the occurrence of mud banks which is a unique phenomenon. Almost 30% of the total population lives in the coastal area. The average marine production from Kerala is about 25% of the country. About 300 medium to large and about 2000 small scale industries are discharging effluents directly in to the marine and fresh water bodies. It is estimated thet about one million m3 of sewage is generated per day in coastal areas and about 30000 m3 of this reaches the surface water bodies. A chain of water bodies locally known as Kayals running parallel to the coastline is a characteristic feature of Kerala coast. These are mostly interconnected by natural or manmade canals facilitating internal navigation along the entire coast.The 690 km long Kerala coast faces the Arabian Sea and the coastline of Kerala is more or less straight trending in NNW-SSE direction from north till Thangasserry headland near Kollam. The coastal orientation south of Thangasserry is in the NW-SW direction. The offshore continental shelf bathymetry is steeper to the south while the 100 m contour is at a distance of around 40 km off of Thiruvananthapuram from the shore; it is 58 km off Kasargode. The variation in the slope of inner shelf is more pronounced. This change in bottom slope has lot of implications in the hydrodynamic and sedimentological characteristics of the inner shelf of the state. The hydrodynamic regime of the coastal marine zone of Kerala depicts the typical features of a monsoon dominated tropical coast. Like the other parts of the west coast, the coastal marine zone of the Kerala coast is known for the occurrence of upwelling, which is strong during monsoon. During the southwest monsoon period when the sea is very rough, very calm sea conditions prevail in the mudbank zones adjoining the shorelines. Some of the locations well known for the occurrence of the mudbank are Koilandy, Njarakkal, Puthuvypene, Alleppey and Purakkad. Their transient nature, unpredictable periodicity, calmness and turbid nature of the water column are unique. Ramachandran and Malik[21] reported an offshore sediment source and rapid sedimentation in the mudbank region during monsoon period.
2.2. Sampling Strategy
- Six transects were selected for the study along southern Kerala coast between latitudes 9° 57’ N and 8° 29’ N and longitudes 76° 14’ E and 76° 53’ E stretching from north to south. The transect I (Kochi), transect II (Alleppey), transect III (Kayamkulam), transect IV (Neendakara), transect V (Paravur), and transect VI (Veli) respectively are stretching from north to south (Figure 1). Four stations, on each of these transects were selected for sampling viz, near shore, 2 km, 5 km and 10 km offshore across the coast. The samples were collected during the CRV Sugar Purvi, cruise programme from May-June 2005.
2.3. Materials and Methods
- The water samples were collected using 5 litre Niskin bottles. The samples for dissolved oxygen (DO) were fixed onboard and the remaining water samples were collected in 2 litre PVC bottles kept in deep freezer till the analysis. Total suspended matter (TSM mg L-1) was determined gravimetrically on Millipore membrane filters (pore size 0.45 μm) after drying at 70℃ for 6-8 hours to reduce water content before weighing. Salinity was determined using a Digi Auto Salinometer (Model TSK, accuracy ± 0.001) and the pH using an ELICO LI 610 pH meter (accuracy ± 0.01). Dissolved oxygen (DO) was estimated according to Winkler’s method[22]. Samples for nutrients (ammonia, nitrate, nitrite, phosphate and silicate) were analysed following the standard methods[22].
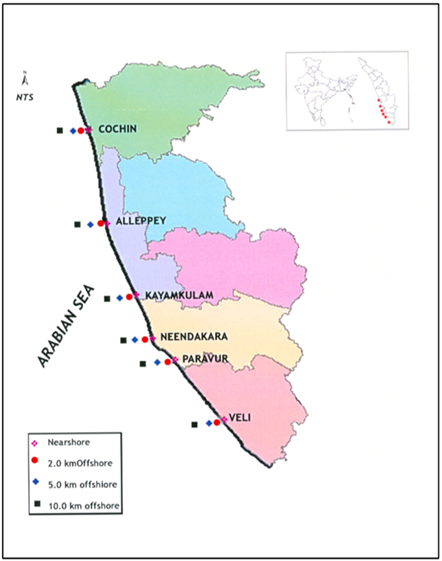 | Figure 1. Sampling sites along southern Kerala coast |
2.4. Cluster and Species Diversity Index Analysis
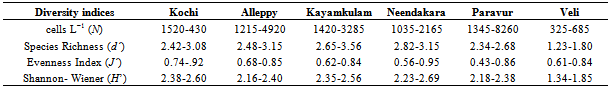
- Multi-linkage cluster analysis using group linkage method was used for identifying the similarities between stations. Diversity indices (Species Richness (d’); Evenness Index (J’) and Shannon-Wiener (H’)) were estimated on species abundance using PRIMER.
3. Results
3.1. Hydrographic Conditions
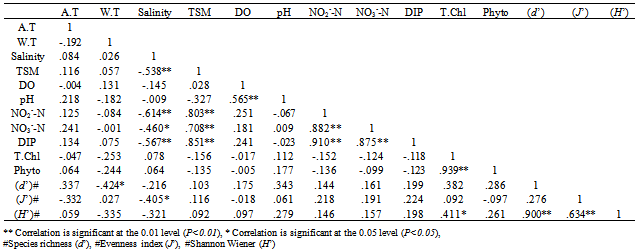
- Coastal belt of Kerala experiences a warm humid climate. Average atmospheric temperature (29.78 ± 1.06℃) was higher (27.15 ± 0.87℃) than the water temperature (Figure 2a & b). Salinity showed wide variation between the nearshore and the offshore waters (Figure 2c). The distribution of total suspended matter (TSM) was found to be more or less similar in distribution with elevated values recorded at estuarine transects (Figure 2d). Similarly, the coastal waters remained fairly saturated with respect to DO except at station Veli (Figure 2e). pH was always high in the offshore waters as compared to the estuarine and nearshore stations (Figure 2f). The nitrogenous nutrients were recorded high at estuarine transect such as Paravur, Neendakara and Kochi except for the southern transect, Veli. The phosphate concentrations did not show any spatial variation except Veli, but higher concentrations of ammonia, nitrate and silicate were observed at selected regions in the near shore regions and decreased gradually towards offshore (Figure 2 g-l). The Nitrate-N concentrations pointed towards a clear source between Paravur to Kochi, where it peaked up to >10 μM and decreased towards offshore. A slight shift but with a similar trend was observed for ammonia-N with the source centered on Neendakara and Kochi. It may be assumed that the ammonia released were either rapidly utilized by phytoplankton or oxidized within the system itself where the waters were saturated with dissolved oxygen. Distribution of silicate-Si was similar to that of nitrate and ammonia and was higher than the corresponding values reported for the waters of southeastern Arabian Sea[24]. The input of these nutrients supported high primary production (peak surface production of 597.8 ± 230.8 mg C m-3 d-1) and was represented by high chlorophyll a up to 5.60 ± 2.31 mg m-3 which was approximately two times greater than the peak values reported so far from these waters[25]. A correlation matrix is produced to investigate the relationship among the water quality variables are illustrated in Table 1.
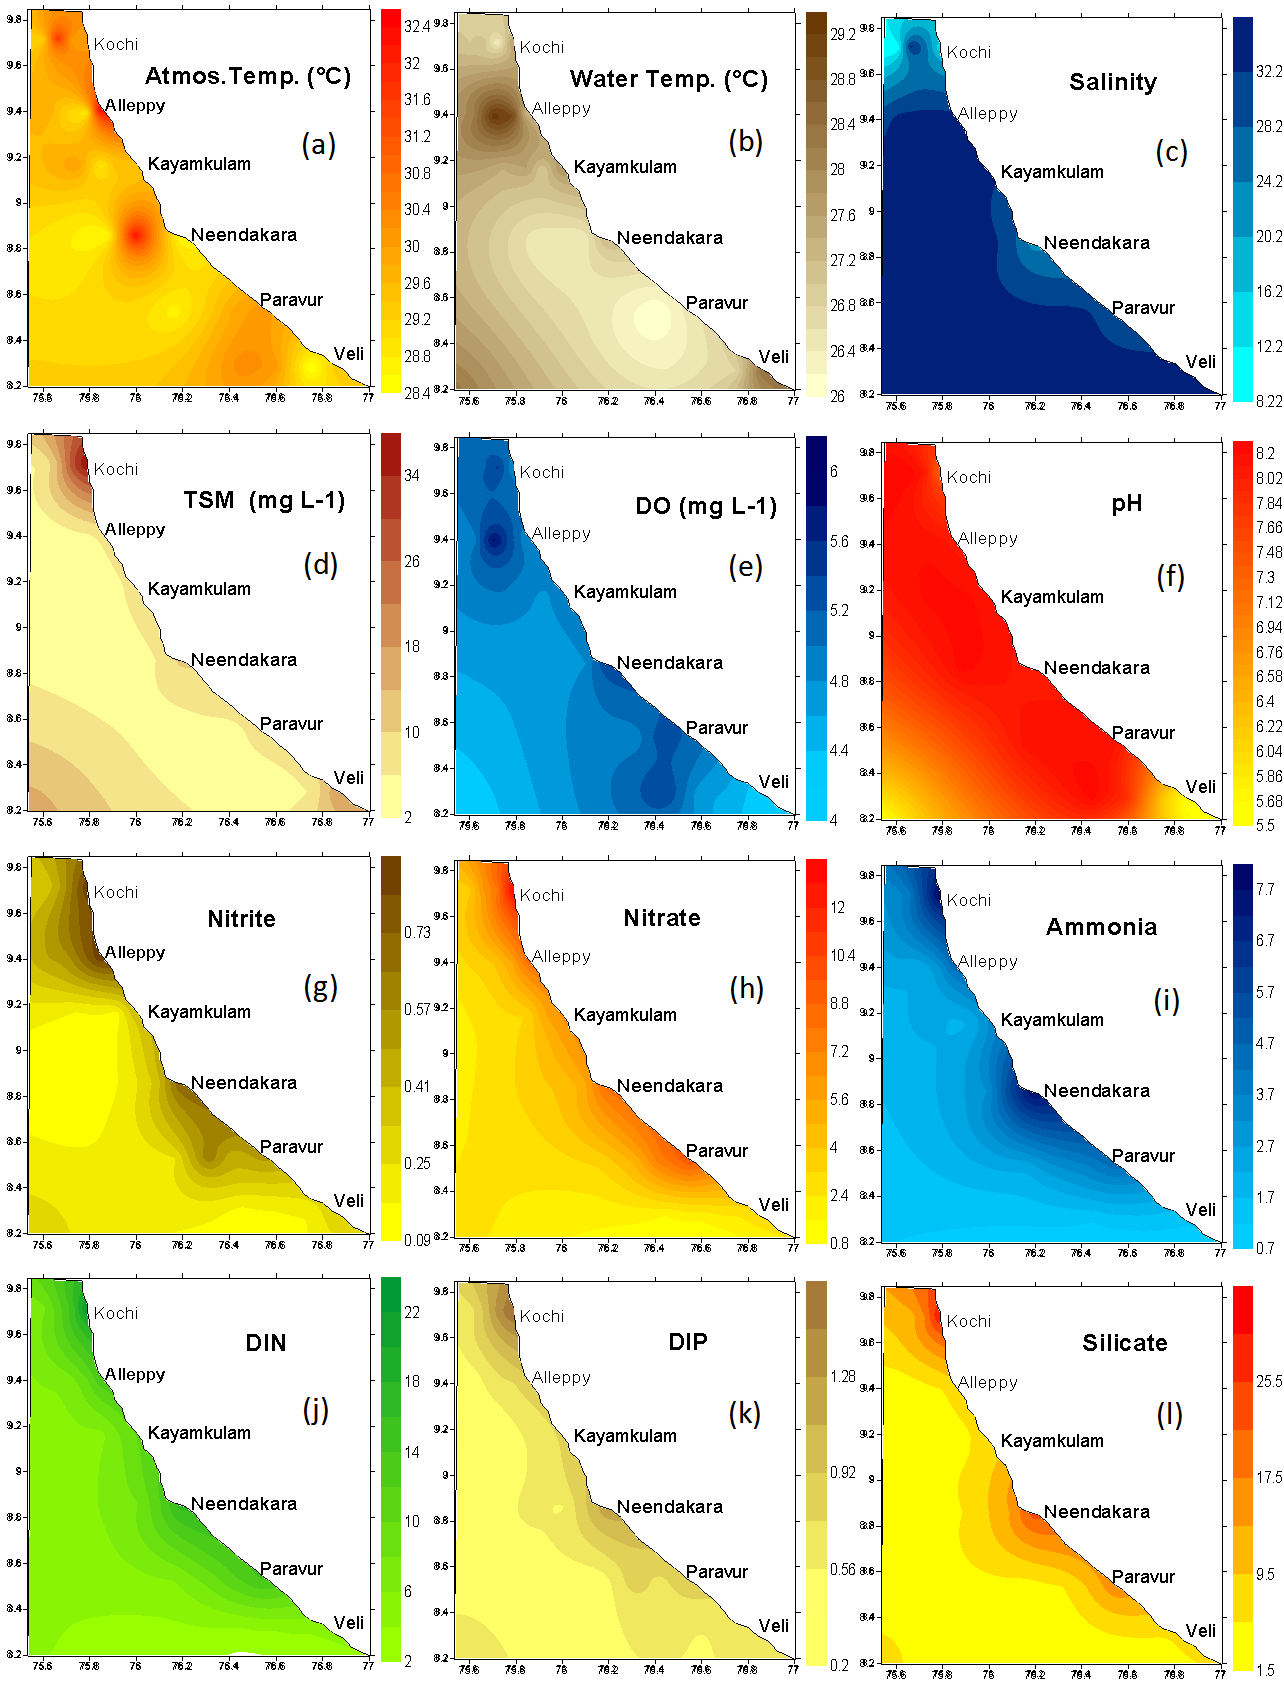 | Figure 2. Spatial variation in (a) atmospheric temperature℃, (b) water temperature oC, (c) salinity, (d) TSM mg L-1, (e) DO mg L-1, (f) pH, (g) nitrite-N (µM),(h) nitrate-N (µM), (i) ammonia-N (µM), (j) DIN (µM), (k) DIP (µM), (l) DISi (µM) along southern Kerala coast |
3.2. Chlorophyll a and Primary Production
- Chlorophyll a (chl a) contained in the pico-(0.2–2 μm), nano-(2–20 μm) and micro- (>20 μm) fractions showed significant variations with maximum concentrations recorded at transect Alleppy (Figure 4). The total chl a was higher in the nearshore, as compared to the coastal waters. Among size fraction, nanoplankton chl a was dominant (3.06 ± 1.26 mg m-3, 55.02 ± 5.5%) over micro-(1.62 ± 0.83 mg m-3, 28.5 ± 4.7%) and pico-(0.91 ± 0.37 mg m-3, 16.5 ± 2.8%). Similar to the distribution of chl a, primary production (total and size fractions) also exhibited considerable variation along the coastal transects, with higher values at Neendakara and Alleppy transects. The nanoplankton primary production was the dominant fraction (470.6 ± 200.6 mg C m-3 d-1, 77.05 ± 9.3%) of the total primary production, followed by micro-(89.16 ± 44.1 mg C m-3 d-1, 16.10 ± 6.7%) and pico- (4.71 ± 2.6 mg C m-3 d-1, 1.19 ± 1.45%) fraction (Figure 5). The high chl a and primary production contributed by the nanoplankton in the coastal waters of southern Kerala was an evidence, depicting the dominance of this community as compared to the autotrophic pico- and microplankton as reported earlier[28]. Normally nutrient enrichment favours the proliferation of large-sized phytoplankton in the coastal waters (>20 μm; Agawin et al.,[29]) and also they need high light intensity for saturating photosynthetic activities[30, 31], however in the present study relatively higher nanoplankton was observed even in presence of higher nutrients. This could be due to light limitation associated with high TSM discharged from the backwaters and wind induced re-suspension which ultimately lead to limit the growth of large-sized micro phytoplankton by enhancing water column turbidity[32].
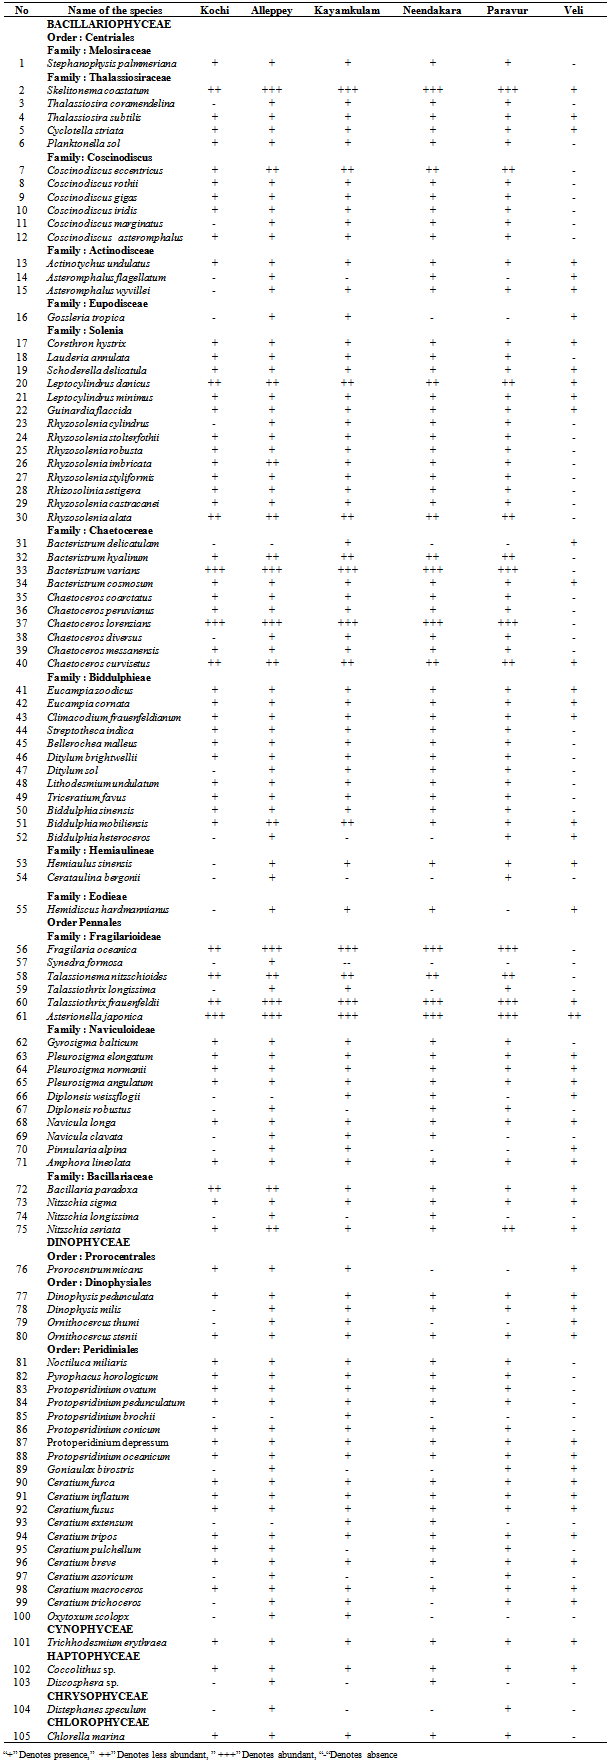
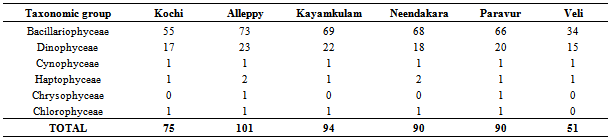
3.3. Phytoplankton Abundance and Composition
- Among the stations, maximum phytoplankton standing crop (8260 cells L-1) was recorded at Paravur 2 km offshore whereas, Veli nearshore recorded minimum standing crop of 326 cells L-1. Variations in phytoplankton standing crop at various transect were illustrated in (Figure 6). About 105 species of phytoplankton were identified in the neritic waters of six transects along southern Kerala coast. Out of these 105 species recorded, 75 species belongs to diatoms (Bacillariophyceae) and 25 species to dinoflagellate (Dinophyceae). Haptophyceae was represented by two species while one species from each of blue-green (Cyanophyceae), green (Chlorophyceae), and silicoflagellate (Chrysophyceae) were identified (Table 2). Among the Bacillarophyceae, centrales were the predominant (55 centrales to 20 pennales). The species number represented by each transects (Table 3) was in the order of, Alleppey (101) > Kayamkulam (94) > Neendakara (90) > Paravur (90) > Kochi (75) > Veli (51). The species were dominanted by Bacillariophyceae (34-73) and Dinophyceae (15-23) in all the stations. Higher number of Haptophyceae (2) was observed at transect Alleppey and Neendakara, whereas Cyanophyceae, Chrysophyceae, Chlorophyceae, contributed one species each at all transect except Kochi, Kayamkulam, Neendakara and Veli. Out of the 105 species, 75 species belong to Bacillariophyceae (40 genara, 75 species), 25 species to Dinophyceae, (9 genara, 25 species), 2 species to Haptophyceae (2 genara, 2 species) and one species to each group of Cyanophyceae, Chrysophyceae, and Chlorophyceae. The genera observed with relatively higher richness in species were, Rhizosolenia (8), Coscinodiscus (6), Chaetoceros (6), Bacteristrum (4), Ceratium (10), and Protoperidinium (6). Among 5 taxonomic groups, percentage composition of diatoms were dominant over other groups (96.84%) followed by Dinoflagellate (3.15%), Blue-greens (0.49%) Greens (0.11%) and Silicoflagellate (0.009%). The prominent species observed at transect Kochi were Asterionella japonica (39.34%), Chaetoceros lorenzianus (26.93%) and Skelitonema coastatum (14.60%), at Alleppey were Asterionella japonica (35.80%), Chaetoceros lorenzianus (26.02%), Fragilaria oceanica (17.90%) and Bacteriastrum varience (5.11%), at Kayamkulam were Asterionella japonica (38.87%),
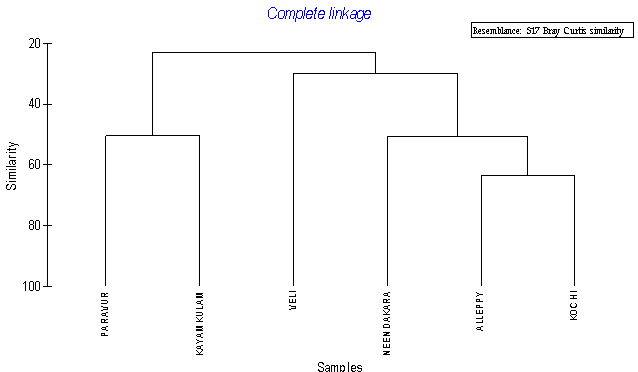 | Figure 3. Group average clustering from euclidean distances based calcification of various transects with respects to hydrographic conditions |
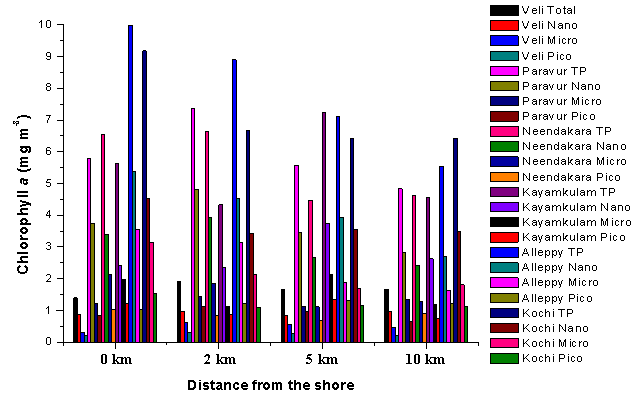 | Figure 4. Distribution of size fractionated chlorophyll a (pico- (0.2–2 μm), nano- (2–20 μm) and micro- (>20 μm) and (total) along the various transects of southern Kerala coast |
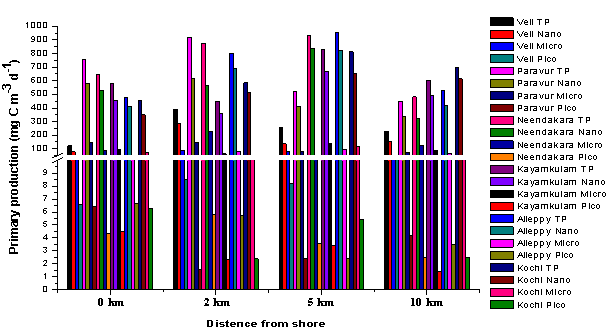 | Figure 5. Distribution of size fractionated primary production (pico- (0.2–2 μm), nano- (2–20 μm) and micro- (>20 μm) and (total) along the various transects of southern Kerala coast |
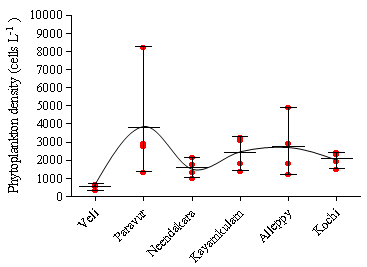 | Figure 6. Phytoplankton density along the various transects of southern Kerala coast |
|
|
|
|
4. Conclusions
- From this study, it is obvious that the variations in the water quality play a significant role on phytoplankton community structure along the coastal waters. The predominant nanoplankton community along the Southeast Arabian was largely involved in the conversion of the inorganic nutrients into phytoplankton biomass and sustained autotrophy. Preponderance of favorable environmental conditions (optimum nutrients and light) prevailing beyond surf zone, enhanced the abundance of nanoplankton community in these waters, whereas in the nearshore stations, light limitation due to high turbidity reduced the nanoplankton growth and abundance, even though existence of high nutrient level. Variation in the nutrient stoichiometry suggested, these coastal waters are very sensitive to further increase in nutrient loading. The study provides baseline knowledge on the productivity, pigment concentration, phytoplankton community structure and the quantity of phytoplankton biomass available for marine food web with respect to various environmental conditions, which could give a new insight to the future ecological assessment along coastal and shelf waters of southern Kerala.
ACKNOWLEDGEMENTS
- The authors are grateful to Ministry of Earth Sciences, Government of India for the financial support during the study period. We are grateful to Dr. C.S.P. Iyer, Former Head, Centre for Marine Analytical References and Standards (C-MARS), CSIR, Regional Research Laboratory, Thiruvananthapuram for his effective encouragement and constant encouragement and generous help, Dr. G. Madhusoodhanan Pillai (Sredha Scientific Trust, Thiruvananthapuram) who rendered great service in the final stages of this work. Thanks are due to captain and crews of CRV Sagar Purvi during shipboard work.