Edmund Merem 1, Joan Wesley 1, Daphine Foster 1, Chandra Richardson 1, Emmanuel Nwagboso 2, Jasmine Williams 1, Kameka Miller 1, Marshand Crisler 1
1Department of Urban and Regional Planning, Jackson State University, Jackson, MS, USA
2Department of Political Science, Jackson State University, Jackson, MS, USA
Correspondence to: Edmund Merem , Department of Urban and Regional Planning, Jackson State University, Jackson, MS, USA.
| Email: |  |
Copyright © 2012 Scientific & Academic Publishing. All Rights Reserved.
Abstract
Agriculture is essential in the economy and environment of Louisiana. However in the last several years, notwithstanding these benefits, the study area of south Louisiana has been experiencing a changing agricultural landscape coupled with growing environmental impacts on the surrounding estuaries and basins attributed to numerous factors. To assess these trends, the paper adopts a mix scale approach involving descriptive statistics, census data and geospatial technology of Geographic Information Systems (GIS). While regional statistics showed recurrent changes in the area of farmland, cropland, and a host of other variables located within the agricultural landscape. The results of the environmental analysis point to intense use of agrochemicals and pesticides to boost productivity. Their impacts on the built environment and natural systems such as estuaries continue to amplify with threats to water quality, and the surrounding ecology. Notwithstanding visible hurricane and climate change threats and related impacts on the landscape, the GIS assessment shows a spatial diffusion of the trends associated with agricultural landscape change in the parishes and the projected land loss in the study area. Considering the severity of the problems and the risks posed to the ecological health of river systems by numerous stressors and factors. The paper identified current efforts at the Federal and state levels to deal with the issues impeding the marine environments. The future lines of action in terms of recommendations ranged from improvement in Federal assistance to the continuous monitoring of water quality and the environment.
Keywords:
Agricultural Landscape, Impacts, Change, Environment, Assessment, Water Quality, GIS
Cite this paper: Edmund Merem , Joan Wesley , Daphine Foster , Chandra Richardson , Emmanuel Nwagboso , Jasmine Williams , Kameka Miller , Marshand Crisler , Geospatial Assessment of the Impacts of Changing Agricultural Landscape in Louisiana, Marine Science, Vol. 3 No. 1, 2013, pp. 9-29. doi: 10.5923/j.ms.20130301.02.
1. Introduction and Background Information
1.1. The Essence of Agriculture
Over the last several years, the agricultural landscape of the Southern Louisiana region within the Gulf of Mexico ecozone in the State of Louisiana remains fraught with recurrent disturbances and other forms of ecological declines fuelled partly by human activities and natural factors. All these are occurring at a time when coastal environments in the region known for farming are faced with repeated threats from inclement weather patterns and different stressors that impact the surrounding ecology of the parishes[1,2,3,4]. Aside from these problems in the region, agriculture still stands tall as an integral part of the marine economy, environment and life activities of the people of Louisiana and the study area. For decades, agriculture has provided at the same time, a good practices and conservation measures in place contribute to effective environmental management of the agricultural land base in a marine zone[5].Just as sound farm practices and mitigation strategies in place for water contribute to effective ecological preservation of the land base, Louisiana contains a hydrological area stretching close to 48,000 m2 indicating extensive water and marine resources across the state. In the process, significant portions of water resources are pumped out of their usual sources to meet communal needs for industry, rural areas, domestic homes, and agricultural purposes in the areas of irrigation, animal husbandry and fish farming[6]. While hydrological information of this type serves a useful purpose in assessing the impacts of current patterns of distribution, and lines of actions for addressing water resource management in Louisiana[6]. In the context of the study area and the impacts of agriculture on hydrology between 2000-2005, the overall ground water outtake stood at 1.600 million gallon per day (Mgal/d). During this same period, surface water pumpage reached 8,700 Mgal/d from 2000 to 2005. The rates of change for both categories show that groundwater removal in the state which also serves the elements located within the agricultural landscape dropped by -3.7 percent while surface water outtake stayed stable[6]. Notwithstanding these benefits, in the last several years, farming activities have been associated with the changing agricultural landscape and the threats to the river environments in the area. With very little work in the literature on these trends in Louisiana, available regional statistics from 1997 to 2007 point to recurrent changes in the area of farmland, cropland, and a host of other variables as well as demographic elements of population. Even though land in orchards remained stable, farms reporting the market value of their products saw their numbers drop to -0.13% to -30.29% while those reporting estimated market value of land and building grew from 0.20% to 63.49%. Similarly, farms reporting full ownership of land initially fell - 0.36 % and latter grew to 4.74. In these settings, farms reporting full ownership of harvested cropland dropped most of the time from -8.69% to -1.01%. Another indication of the changing agricultural landscape comes from the activities involving harvested cropland farms which fell to -5.43% and peaked up at 0.40%. Farms reporting irrigation use grew from 169.30% to 737%[2, 1]. Considering that the other trends in the area involve the intense use of agrochemicals and pesticides to boost productivity, their impacts on the built environment and natural systems continue to amplify with threats to watersheds, water quality, and the surrounding ecology in the marine environment.Furthermore, variations in the agricultural landscape of the region involve changes in irrigation water use, gains and losses in the size of land devoted to farming operations and the growing problems posed to the surrounding ecology from the widespread use of agrochemicals and pesticides. These impacts have environmental health implications on the marine ecosystem which must be analyzed. At the same time, there have been no efforts in the literature to document the extent of measures adopted in the farm producing parishes to contain the threats of marine ecosystem degradation from agricultural activities. While regional statistics show that the changing agricultural landscape of the Southern Louisiana region does not operate in a vacuum. It is attributed to several socio-economic and environmental variables which had been reechoed in numerous studies in the literature (USDA[2,7,8]).The literature on the changing agricultural landscape and GIS is festooned with many interesting studies that show widespread support for the analysis. For the purposes of analysis and the fact that the current studies on agricultural landscape change come from various perspectives. We would put the landscape review into perspectives by examining the current body of research in the area under the rubric of generic analysis, farmland loss, landscape analysis, mitigation measures and others. This would be followed by a brief synthesis of the applications of Geographic Information Systems (GIS) in related analysis. Due to a lack of space a detailed segment of the literature is not presented here. In place of that, the following paragraphs provide the summary of the main ideas identified in the literature.Local studies of importance focusing on the study area include Taylor’s[9] work built on a regional flavour. Here the author not only analyzed the trends in nearby North Central Louisiana with Census of agriculture data between 1945 through 2007, but he showed how the agricultural economy of the Piney Hills of North Louisiana evolved over time[9]. Delaune and Southwick added marine impact analysis perspectives by showing how farm activities in the South Louisiana coastal landscapes left in their wake notable impacts on the surrounding ecosystem[10,11]. Southwick’s work on the potential influence of sugarcane cultivation not only offered an assessment of estuarine quality of the Louisiana’s gulf coast, but it drove home the point on accumulated impacts over the years on the marine ecosystem[11]. Other studies highlighting GIS applications with direct relevance to the study area of Southern Louisiana are quite few or non-existent with the exception of the seminal works of Merem and Twumasi in 2005 on GIS applications in land management in Central Mississippi and the use of GIS in analyzing growth management in central Mississippi[12,13,14]. Additional studies on the changing agricultural watershed landscapes and others in the south east similar to these studies can be gleaned from Merem and Twuamsi in various years[15, 16, 17, 18, 19, 20, 21, 22, 23, 1, 24, 25]. For related studies on changing landscape see Kenneth[26] Caffey[27, Dokka[28], Dianne [29] James[30] and Jackson[31]. These conclusions point to varying forms of changepertaining to agricultural landscapes in marine environments as we have seen from the literature herein reviewed. The body of research reviewed so far are laudable and informative. They show that agricultural landscape change under the different themes has continued to occur under the influence of many factors. Notwithstanding the number of studies, by Merem and Twumasi and other authors in various years[15, 16], very little has been done in showing the applications of GIS to the changing agricultural Landscape of the study area. Said that, the applications of Geographic Information Systems (GIS), in analyzing these problems spatially in the Southern Louisiana area remains quite minimal. This paper would fill that void in the Literature by focusing on the use of GIS and descriptive statistics in analyzing the changing agricultural landscape of the Southern Louisiana coastal region. Considering the severity of the problems and the risks posed to ecological health of river systems, there is a need for a GIS analysis of the impacts of the changing agricultural landscape in Southern Louisiana. Using GIS to track these trends spatially strengths the readiness of land managers to plan and protect vulnerable areas. Accordingly, the paper will bridge the gap in the literature by assessing the occurrence of change in the study area.
1.2. Objectives and Organization
This paper analyzes the changing agricultural landscape along Southern Louisiana using Geographic Information Systems (GIS). The emphasis is on the issues, trends, factors fuelling the problems, environmental analysis, and efforts to deal with the problems and future lines of action and strategies. The first aim of the paper focuses on the use of spatial technology in analyzing modifications on marine agricultural landscape, while the second objective aims to generate a tool for effective management of land and environmental resources. The third objective is to design a decision support tool. The fourth objective is to contribute to the literature. The sections in the paper consist of a review of the issues and trends. Other sections cover the methods and study area profile, the efforts to deal with the problem and ecological analysis of the trends. The paper concludes with some recommendations.
2. Methods
In terms of methodology, the paper adopts a mix scale approach involving descriptive statistics, primary census data and geospatial technology from government databases. The spatial information for the research was obtained from the Louisiana Strategic Online Natural Resource Information Systems (SONRIS) through the Louisiana Department of Natural Resources office in Baton Rouge, Louisiana, the Louisiana Department of Agriculture and Forestry, the American Farmland Trust and the United States Census of Agriculture for 1992, 1997, 2002 and 2007. Federal geographic identifier codes for the eight coastal parishes (Jefferson, LaFourche, Livingston, St. Bernard, St. Charles, St. James, St. John and St. Tammany) were used to geo-code the information contained in the data sets. The spatial data came from land-use capability and classification maps for the study area. This information was analyzed with basic descriptive statistics, and GIS, with particular attention to the temporal-spatial trends at the county level. The relevant procedures consisted of two stages, as described below.
2.1. Stage 1: Identification of Variables, Data Gathering and Study Design
The initial step in this research involves the identification of the variables required to analyze changes at the parish level from 1992 to 2007. The variables consist of socioeconomic and environmental information, including the amount of agricultural land, the number of farms, market value of land, amount of cropland, population, the number of farms receiving federal transfer payments, the size of cropland, cropland harvested, the size of orchard land, the amount of pastureland, land treated with fertilizer, the size of land treated with fertilizer, other selected indicators on housing (homeownership rate, income and unit structure and others. (See Tables 1 through 4). Appropriate variables were derived from additional sources such as government documents, newsletters and previous works. That process was followed by the design of data matrices for socioeconomic and land use (environmental) variables covering the census periods from 1992 to 2007. The design of spatial data for the GIS analysis required the delineation of city boundary lines within the study area as well. Given that the official boundary lines between the eight coastal parishes remained the same, a common geographic identifier code was assigned to each of the area units to ensure analytical coherency.
2.2. Stage 2: Data Analysis
In the second stage, descriptive statistics and spatial analysis were employed to transform the original socioeconomic and land-use data into relative measures (percentages, ratios and rates). This process generated the parameters for establishing, the extent of change or farm land cape loss for each of the eight parishes in order to facilitate gradual measurement and comparison of the trends in the area overtime. This approach allows detection of levels of change, while the graphics highlight the landscape land-loss trends affecting the study area. The remaining steps involve spatial analysis and output (maps-tables-text) covering the study period, using ARCVIEW. The spatial units of analysis consisted of the eight counties (Figure 1). The study area map indicates boundary limits of the parish units and their geographic identification codes. Outputs for each parish were mapped and compared across time. This process helped show the spatial evolution of farmland loss, as well as changes in other variables.
2.3. The Study Area of Southern Louisiana
The study area as shown in figure 1 is located in southern Louisiana coastal region. It contains eight parishes Jefferson, LaFourche, Livingston, St. Bernard, St. Charles, St. James, St. John and St. Tammany. While the region stretches through an area of about 3,678.12 square miles. It contained a sizable population of 944.790- 992.048 between 1992 through 2002 and rebounded slightly from 1021.202 to 1030.797 during 2002-2007. This represents a percentage change of -5.00 to 0.93%. The different farm land uses in the area under analysis consist of harvested land, cropland, farmland, land in orchard, pasture land and rangeland just to name a few[1, 2 ]. In the entire country, South Louisiana by and large is quite notable for its plentiful assemblage and holdings of seafood operations within the Gulf of Mexico ecozone. Being a marine environment, the region is home to a good number of active fisheries in the country. With its known capacity in the production of rice, sugarcane, and productive grazing lands attributed to the region’s soft winters and fertile soils. The area's natural features, which vary from marshland, waterways, and bayous in the coastal areas to the flat agricultural lands in the north, have helped shape settlement patterns and development. While the area's traditionally strong ties to agriculture, fishing, and trapping are still evident, they are no longer the center piece of the economy, and social structure[32].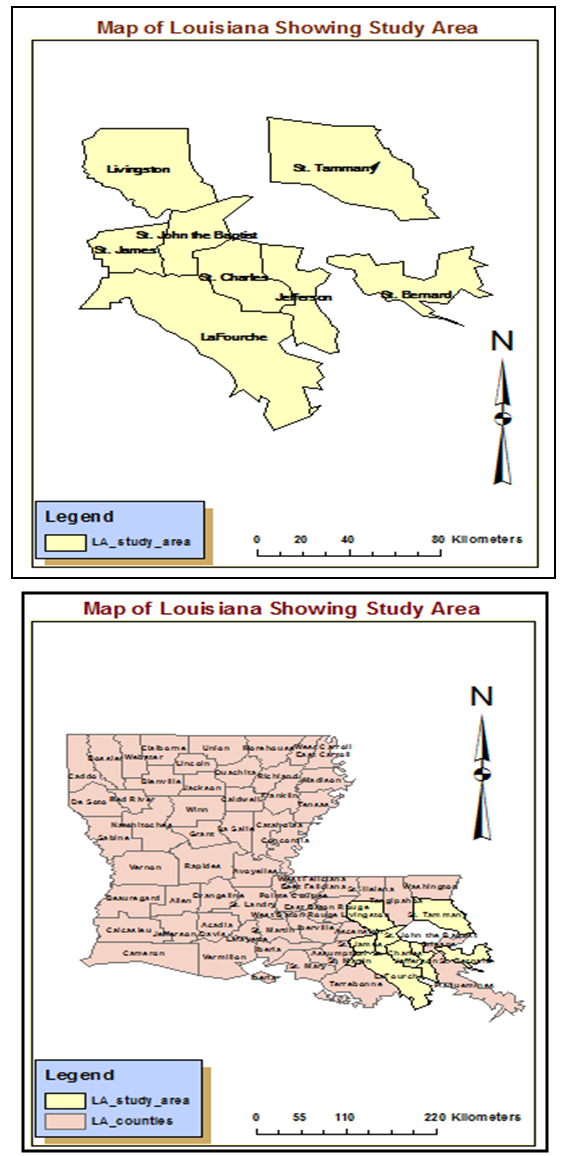 | Figure 1. The Study Area |
Just as the potential influence of sugarcane cultivation on estuarine quality of the Louisiana’s gulf coast has been fully documented from the work of Southwick[11]. Sugarcane cultivation covers an estimated area of 17,0000 hectares of land along the south central and southwestern portions of the state of Louisiana. Because of the nature of these activities, the areas devoted to sugar cane framing and agriculture drain into the bayous and rivers that empty into Louisiana's coastal bays and estuaries. Over the past years, the ecological wellbeing is threatened by erosion, pollutants, and high nutrient loads from urban and agricultural sources. Accordingly, there are ongoing efforts in place to reduce the amount of agricultural related nitrogen, phosphorus, and sediment leaving the rice farms and fields so as to reduce agricultural impacts on water quantity; and enhance or maintain wildlife habitat in the marine ecosystem. Accordingly, a total of three main watersheds areas of concern in Louisiana located in the study area have been identified for participation in the new Gulf of Mexico Initiative put forward by the Federal Government[2].Another major issue which influences the changing landscape in the region stems from the menace of climate change hazards. Accordingly, the South Louisiana region, continues to be the site of the largest wetland disappearance in the United States. This has resulted in the loss of Mississippi delta wetlands along the region, at a rate of 17 square miles annually, This is equal to 50 acres daily. Notwithstanding the current climatic variability for the region. The projected wetland loss rates for the upcoming two decades along the shore lines of the region, which is attributed to sea-level rise and the disturbances of costal ecosystems would quicken the conversion of arable land to barren sea. This would endanger the fisheries sector, fish farming and agricultural activity along the coast[33]. Similar conclusions as it relates to forests ecosystem health in the area can be found in the 2008 work Zhu and Thomas[34].
3. The Results of the Environmental Analysis
3.1. The Temporal Analysis
This part of the paper presents the environmental analysis with focus on the results of the GIS and descriptive statistics analysis tracking the state of the marine ecosystem in the area and change over the years from a temporal and geospatial perspective. The analysis of the agricultural land use, fertilizer use, harvested land, total area of cropland, irrigated land, and estuary and basins or watershed pollution occurring in the area along with the impact analysis of trends in the region are also presented. The study area stands as a heavily farmed area with intense activity occurring in all the entire eight parishes from 1992 through 2007. This can be seen by looking at the changing trends in agricultural land for the entire study area.The total number of farms in the study area dropped from 1448 to 1446 between 1992 through 1997 only to rebound from 1700 -1787. Among the individual parishes, three areas most notably Lafourche, Livingston and St.Tammany contained more farms in hundreds than the other areas under analysis. However during this period, just as Lafourche parish’ number of farms fell from 412 to 398 in 1997-2002, Livingston parish also experienced further declines from 374-345 farms. Elsewhere during the same period, St Tammany saw its number of farms, jump from 423 to 451. Among the other group of 4 parishes namely St, Bernard, St. Charles, St James, and St John with smaller farms, a contrasting pattern emerges with mounting increases in the number of farms. From the table, the number of farms for Jefferson Parish jumped from 38 to 68. The trend continued at St Bernard where the number of farms rose from 25 to 27 (Table 1). In a similar vein in St Charles, the number of farms grew by 67 to 71,and continued at St James Parish with 63 to 65 along with the 26 to 27 for St John Parish during 1992 through 1997. In the ensuing census periods of 2002 through 2007, the parishes were quite even in terms of increases and decreases in the total number of farms. Beginning with the first four counties made up of Jefferson, Lafourche Livingston and St Bernard, it is evident from the table , the farms available in the areas rose by 52 to 71, 405-445,451-476 and 24-45 respectively. In the other counties, St, Charles, St James, St John and St Tammany all saw their number of farms drop to 62-58, 69 to 64, 34-31 and 603-602 (Table1). Turning to the land in farms in south Louisiana, the opening land acreage of 302,665 for the entire area in 1992 fell to 166,797. The land acreage figures plummeted further between 2002 to the 2007 census from 319,098 to 285,722. This is somewhat lower than the previous census period for the entire study area. In the eight parishes under analysis, LaFourche Parish not only contained the largest acreages in farm land, but its farm land sizes during the censuses of 1992, 1997, 2002, and 2007 estimated at 132,678, 135, 042, 150,927 and 106,119 acres dwarfed the numbers for the other areas. The closest Parish, St James in terms of farmland size, had tens of thousands of land acreages devoted to farmland operation in the order of 42,922, 45,347, 52,802 and 43,251 in the census periods of 1992, 1997, 2002, and 2007. St. Tammany parish with identical estimates of 40,181 to 41,863 in declining acreages between 1992 through 1997 slumped further from 51,308 acres in 2002 census to 45,506 in 2007. While slightly outpaced by the previous parishes, Livingston saw its initial farmland acreages jump from 36,059 to 40,471 but only to dip further from 34,420 to 29,987 acres between 2002 to 2007 censuses. In the other parishes with recurring declines, St Charles Parish farmland base in operation dropped from 23,185 to 21,338a acres in 1992 to 1997 and continued the downward slump of 8,735 acres in 2002 in the face of no reported activity in 2007. At St Bernard Parish, all through1992-1997, the size of land under farm operations which showed further declines of 6,166 to 3,404 acres, rebounded to 32,060 in 2002 (Table 2).The number of farms reporting cropland availability in the study area as the table shows dropped from 1152 to 1102 in 1992 through 1997 and continued the skid in the censuses of 2002 and 2007 from 1170 to 1028. At the parish level, Lafourche and Livingston both reported more farms with cropland in the census periods of 1992, 1997, 2002 and 2007. At Lafourche parish where the number of farms with cropland stood at 319, 345, 284 and 307 (Table3 ). The pace of change in the entire study area of South Louisiana region, does not seem different from the previous variables under analysis. The number of harvested farms in the area which dropped from 847 to 801 in 1992 to 1997, fell further to 748 to 751 during the 2002 through 2007. As the analysis moved to the individual parishes, one notices a familiar classification dominated with three parishes having more harvested farmlands relative to their numbers. Of these parishes under analysis, Lafourche, Livingston and St Tammany led the others with hundreds of harvested farms. The parish of Lafourche had about l 275 to 248 farms and additional, 212 to 235 farms between 1992-1997, and 2002 through 2007. The Livingston area not only followed up with 181 to 165 farms, but the numbers went up further from 169 to 179. During the same periods, at St. Tammany parish, the harvested crop land numbers ranged from 231to 222 and 230 to 215 respectively (Table 4). The growing use of fertilizer as evidenced in the area from the Table showed the study area treated a total of 96,661 to 89,268acres of farmland adjacent to the marine ecosystem with chemicals by 1992 through 1997. The persistent treatments of land with fertilizers varied from about 91,571 to 75,203 acres. With all these numbers representing various form of declines in absolute forms, the applications did drop. Of the parishes Lafourche and St James each applied more land acreages with chemicals measuring tens of thousands than the others. Consider the 44,645 to 33,435 acreages for Lafourche parish treated with chemicals during the 1992 to 1997 census periods. These numbers dropped from 34,019 to 28,093 acreages by 2002 through 2007. The pace of fertilizer treatments for St James parish during the same period rose from 28, 652 to31,239 acreages only to drop from 30,592 to 25,850 between 2002 through 2007 (Table 5). The intense application of these chemicals poses a big threat to biodiversity in an already fragile marine ecosystem in southern Louisiana.
3.2. Percentages of Change
In terms of the percentage of change overall for the number of farms, the numbers showed a decline of-0.13 % and an increase of 5.11% during the fiscal years of 1992-1997 and 2002-2007 respectively. At the parish level, in 1992 to 2002, two counties ( Lafourche and Livingston) posted single digit percentage declines of -3.39 and -7.75% . At the same time, the remaining 6 counties of Jefferson, St Bernard, St Charles, St James, St John and St Tammany experienced gains of 6.89%, 8%,5.97%, 3.17%, 4.34%, and 6.61%. In the 2002 and 2007 periods, the parishes again were evenly split in the categories of gains and declines as evidenced in the area. Accordingly, just as the parishes of Jefferson and St Bernard emerged with double digit gains of 36.53 to 87.5%, the numbers for Lafourche, and Livingston stood at 8.64 and 5.54 percentage points. Note also that while the percentage equivalence for declines in the number of farms stayed firm in single digits of -6.45%, -7.24%, and - 8.82% at St Charles, St James, St John, the numbers for St Tammany dropped slightly -0.16% (Table 1). For the entire region, the size of farm land fell at a rate of -44.89% in 1992-1997. The figures plummeted further between 2002 to the 2007 census by -10.45 % at a level somewhat lower than the previous census period for the entire study area. The percentages of change at the Parish level in 1992 -1997 shows that 3 of the 8 posted declines – while the rest stayed on the positive side with gains. Of the changes, the trends in the counties of Jefferson, Lafourche, Livingston, St James, and St Tammany point to gains of 17.17, 1.78%, 12.23%, 5.64%, 4.18%. From these numbers, the biggest gains in double digits occurred in Jefferson and Livingston. The double digit losses in farmland area of -44.97% to -45.01% for St Bernard and St John Parishes, as the data shows outpaced the level of losses experienced by St Charles Parish estimated at -7.96%. With the exception of 97.9% gains posted by Jefferson Parish in 2002-2007, consider the double digit losses of -29.68% for Lafourche, -12.87% for Livingston, -18.08 for St James and -37.76% to -11.3 % experienced by the Parishes of St John and St Tammany(Table 2). The number of farms reporting cropland availability in the study area as the table shows dropped at a rate of -4.34%and -.12.13%.With the exception of stable percentage change for the parishes of Jefferson and St John in 1992-1996, four of the counties seemed to have experienced single and double digit declines while only two others posted single digit gains of less than 4.00 percent. The breakdown of the declines among the parishes of Lafourche, Livingston, St Bernard, and St Charles stayed in the order of -7.53%, -9.67%, -20% and 10%,. In the 2002 -2007 period, with the exception of miniscule gains of 0.37 %for the Parish of Jefferson, 7 of the 8 counties all posted visible declines in 2002 through 2007. With the double digit declines evident in the parishes of St Charles, St James, and St Tammany in the order of -22.79, -19.35, -17.02, see that the other group of areas most notably St Bernard and St John, Jefferson and Lafourche, each followed with percentage declines of -9.09 to -8.33 and -9.09 to -.7.49(Table 3). The number of farms that harvested their cropland in the entire study area of South Louisiana region between 1992 to 2007 declined by -5.43 -0.40 percentage points. The individual percentages of change for the parishes show a mix of gains and declines in 1992 to 1997 with only two parishes of St James and St John reporting double digit gains of 13.46% to 21.05% during the periods of 1992 through 1997. In the other parishes under analysis, declines in the numbers of harvested farms occurred at mostly single digit figures of -5%,-9.81, -8.83, -5.00%, -6.12% and -3.89%in the Jefferson, Lafourche, Livingston, St Bernard, St Charles, and St Tammany. In 2002 through 2007 census periods, all gains which occurred in the area were evident in the three counties of Livingston at 5.91%, Lafourche with 10.84 and St James at 6.81%. The levels of double digit declines began at -24% for Jefferson Parish, -16.66% at St Bernard, -12.12% for St Charles, -26.08% for St John, until it slowed slightly by - 6.52% at St Tammany during 2002 through 2007(Table 4). Further along the years in the study area, the applications of fertilizer drooped from -7.64% between 1992 -1997 to 17.87% during the census of 2002 through 2007. The percentage levels of change indicate, despite the notable drops of -25.1 and -45.38 in fertilizer acreage treatments which is good for the environment, the rates of use grew in six other parishes during 1992 through 1997. During these periods also, the application rates were far more notable at 863.01% in St. Bernard parish when compared to the 86.29 %- 93.91% and 31.93% increases that occurred at Jefferson, St. Charles areas and St Tammany. Moving into the next decades from 2002 through 2007, the use of fertilizer dwindled by double digits in 5 out of 8 parishes. The biggest drops in percentage points occurred at the parishes of Jefferson, St. Johns, Livingston, Lafourche, and St. James. The level of declines for these parishes between 2002 through 2007 were in the order of -71.75%, -40.33, -31.95, -17.41% to -15.5%. The level of gains in fertilizer application on farmland treatment were more at St. Bernard with 123.63% and St. Charles at 55.6 % while St. Tammany finished at 4.4%(Table5).
3.3. The Environmental Impact Analysis of The Surrounding Areas; The Estuary and Basin
With agriculture as the major land use within the area, the growing intensity of agricultural land landscape changes in the region has been glaringly felt with rapid environmental degradation of the surrounding Bayous and estuaries. In that light, some of the coastal water systems that have been impacted consists of the Bayou Corne-Grand Bayou and Bayou St. Vincent-Little Grand Bayou Watersheds located within the Barataria- Terrebonne National Estuary as well as the Bayou Grand Marais in the Mermentau Basin (Figures 2,3,4) . These watersheds have so badly deteriorated that they now pose public health risks. The information on Tables 18 and 19 provide a summary of the ecological problems in the water environments and the surrounding farm landscape[2].The breakdown of the existing land use in the Baratatia Estuary show the two watersheds consist of 23,226 acres of cropland, 46,167 acres of bottomland hardwood forest, 331 acres of pasture, and 1,870 acres of urban land. Essentially, those first two are among one of the most delicate estuaries in the nation. Accordingly the same thing is also occurring along the other adjoining watersheds along the study area where Bayou Grand Marais watershed shows similar attributes. The watershed consists of 30,975 acres of cropland; 3,777 acres of pasture; 1,332 acres of forestland; and 1,133 acres of urban land. Over the last several years, the overall ecosystem health of the Barataria-Terrebonne estuary has been declining for numerous reasons. The problems embody hydrologic changes, the reduction of sediment, habitat loss, eutrophication, pathogens, toxic substances, and changes in living resources. These problems originate from many sources including point and non-point sources, building levees, channelization, and runoff from urban, sub-urban, and agricultural areas. The concentration of runoff coming from active lands in the region threatens the quality of water in the watersheds, basins, and the Gulf of Mexico. In the Merematua basin, ecosystem health is being harmed by the incidence of erosion, pollution, and high nutrient loads from built up areas and farm sources. The other notable ecological problems of the basin consists of sheet and rill erosion from agricultural sources depositing excessive sediment into the waterways. The effects include increased turbidity, phosphorus loading, and, eventually, eutrophication or the loss of oxygen. Furthermore, surplus sediment in surface water also has a tendency to destroy biodiversity in the bottom of the sea by inducing notable alterations to the deepness and thickness of the water. While this alters the underwater hatching areas, all these pressures do affect the delicate shoreline estuaries already stretched beyond their limits and carrying capacity[2]. For more information on the declining ecology of the basins and estuary due to run offs from agriculture in the area, see Tables 14 and 15.Another dimension to the changing agricultural landscape is that due to the scale of degradation, a total of 125,452 acres of the adjoining land areas covering the coastal water ways and systems of the study area have been identified for treatment. Of all these areas 86,452 acres are located in the Barrtaoria-Terrebonne national estuary with the remaining 39,000 in the Merematu basin. Within the basins and the estuary as the tables show, there are widespread problems of water quality and quantity, as well as soil degradation and mounting threats to habitats for wildlife. With similar levels of degradation in the surrounding estuaries of the study area, it is evident that the ecology of the area has been under tremendous stress over the years due to the changes in the landscape of the region. See figures 2, 3 and 4 for further evidence of the level of ecosystem degradation occurring around the southern Louisiana region due to the changing agricultural landscape of the area. The point from these images is that they underscore the gravity of ecological decline of the basins and estuaries and landscape disturbances from farming, and the threats of fertilizer run off from farming in the study area. They are serious enough to cause long term damage to the region’s landscape and the marine environment. 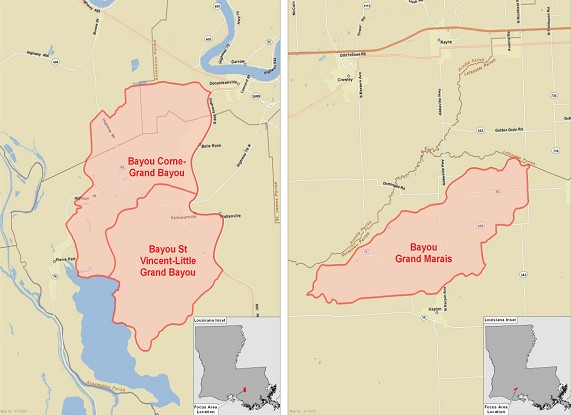 | Figure 2. Estuary and Basin in South Louisiana Ecological Decline from Farm Activities |
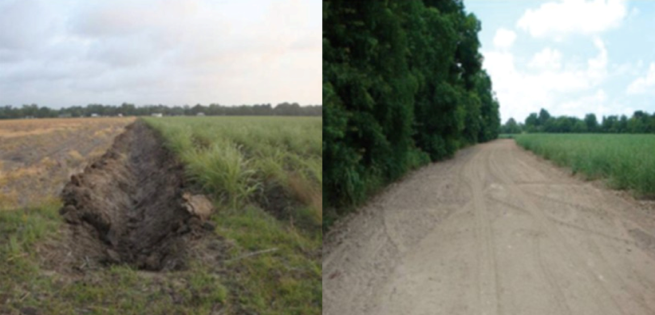 | Figure 3. The Farm Practices and Sand Erosion Threatening the Surrounding Environment in the Basins and Estuary |
| Table 14. The Environmental Conditions of Baratoria - Terrabone National Estuary |
| | Resource Concerns | Total Acres Needing Treatment | | Water Quality – Excessive Suspended Sediment and Turbidity in Surface Water and Excessive Nutrients and Organics in Surface Water | 23,226 | | Water Quantity – ReducedStorage of Water Bodies by Sediment Accumulation and Reduced Capacity of Conveyances by Sediment Deposition | 23,226 | | Soil Erosion – Classic Gully and Emphemeral Gully | 14,000 | | Soil Condition – Organic Matter Depletion | 16,000 | | Wildlife – Food and Cover | 10,000 | | Total | 86,452 |
|
|
 | Figure 4. Runoffs from rice fields carry nutrients sediment which impacts water quality |
| Table 15. The Environmental Conditions of Bayou Grand Marais - Mermentau Basin |
| | Resource Concerns | Total Acres Needing Treatment | | Water Quality – Excessive Suspended Sediment and Turbidity in Surface Water and Excessive Nutrients and Organics in Surface Water | 10,000 | | Water Quantity – Reduced Storage ofWater Bodies by Sediment Accumulation and Reduced Capacity of Conveyances by Sediment Deposition | 10,000 | | Soil Erosion – Classic Gully and Emphemeral Gully | 5,000 | | Soil Condition – Organic Matter Depletion | 4,000 | | Wildlife – Food and Cover | 10,000 | | Total | 39,000 |
|
|
3.4. Hurricane and Climate Change Related Impacts on the Landscape
After Hurricane Katrina made landfall in Louisiana on August 29, 2005, the agricultural sector of the region including those in southern Louisiana incurred enormous damages in the areas of agriculture, forestry, and fisheries industries. At the time of the initial estimates, the projected figures of the total economic impact due to losses in revenue and additional production costs were put slightly at over $1.0 billion. Figure 5 offers a highlight of the nature and extent of devastation that resulted in extensive land loss Just as Hurricane Katrina wrecked havoc, the ferocious force unleashed from Hurricane Rita, ravaged the western Gulf Coast region of Louisiana when it made landfall in 2005. Such recurrent pace of hurricane landings involving Rita triggered violent storms, high winds, heavy rains, and flooding. The resultant storm surge along the Louisiana Gulf Coast flooded areas in nearly every coastal parish in the state. The storm left in its wake extensive damages that destroyed some portions of the agricultural sector and the adjoining landscapes[4].  | Figure 5. The Impacts of Hurricane in 2005 in Southern Louisiana |
Notwithstanding these problems, when Hurricane Gustav struck, active operations in forestry and agriculture in the state suffered enormous losses due to the destruction of timber and crops. The estimated price tag of the damages resulted in hundreds of millions of dollars in losses for farmers and associated businesses.. Data on the food and fiber sector in the state indicate major losses in the neighbourhood of more than $400 million to agriculture[4]. See Table 16 for more information on the damages done to the farm landscape of the area due to Hurricane Rita in 2005. | Table 16. The Estimated Impacts of Hurricane Rita in 2005 on Agriculture in Louisiana |
| | Forestry | | Resource | Damage Costs | | Timber | $225,926,661.00 | | Christmas Trees | $1,140,000.00 | | Total Forestry | $227,066,661.00 | | Agronomic Crops | | Resource | Damage Costs | | Sugarcane (Sugar and Molasses | $141,409,357.00 | | Cotton | $38,404,584.00 | | Rice | $11,743,993.00 | | Soybeans | $5,106,183.00 | | Other Agronomic Crops | $5,172,243.00 | | Total Agronomic Crops | $201,836,360.00 | | Fruits/Nuts/Vegetables/Honey | | Resource | Damage Costs | | Vegetables | $378,741.00 | | Wholesale Nurseries | $1,436,700.00 | | Greenhouse Vegetables | $17,963.00 | | Citrus | $1,564,000.00 | | Pecans | $5,589,079.00 | | Honey Production | $595,144.00 | | Total Fruits/Nuts/Vegetables/Honey | $9,581,627.00 | | Livestock and Forage | | Resource | Damage Costs | | Poultry | $2,659,982.00 | | Cattle | $32,948,775.00 | | Dairy | $88,861.00 | | Horses | $6,500,000.00 | | Hay/Forage | $9,541,080.00 | | Total Livestock and Forage | $51,738,698.00 | | Aquaculture | | Resource | Damage Costs | | Crawfish | $38,238,652.00 | | Alligators | $9,475,002.00 | | Turtles | $623,000.00 | | Other Aquaculture | $841,370.00 | | Total Aquaculture | $49,178,024.00 | | Fisheries | | Resource | Damage Costs | | Shrimp | $18,263,996.00 | | Oysters | $2,084,787.00 | | Crabs | $3,551,338.00 | | Menhaden | $8,041,701.00 | | Commercial Finfish | $2,149,070.00 | | Total Fisheries | $34,090,892.00 | | Wildlife/Recreational | | Resource | Damage Costs | | Hunting Leases | $9,427,570.00 | | Charter Fishing | $7,155,000.00 | | Total Wildlife/Recreational | $16,582,570.00 | | Total Estimated Economic Impact | $590,074,832.00 |
|
|
3.5. Spatial Analysis
This part of the paper, provides a spatial analysis on selected variables as was done on the environmental analysis section. Accordingly, changes in the agricultural landscape in the study area herein can be explained by distinguishing the trends under the three categories’ of % decrease in red, no change in light green and percentage increases in blue. Regarding the percentage of change in the spatial distribution of number of farms as a measure of change, in the census periods of 2002 through 2007, note that in Figure 6 while biggest levels of decreases stayed firm in two parishes in red located in the western side of the study area. The parishes that experienced no change represented in green colour seemed clustered in the central and the lower areas of the map. Another dimension to the geographic aspects of the change is evident with the emergence of rates of change. Shown in the blue portion of the map, this component is associated with increases. These spatial trends stayed prominent in the north east and south east sides of the study area of south Louisiana.During the census periods of 1992 and 1997 as the maps further indicate, note the patterns of spatial dispersion of change in farms. With only one evidence of visible drop in the parishes, much of the areas identified in blue within the south and north east area of the region had a far larger concentration in space where farm ownership stayed on the rise while areas where farms changes stayed stable seemed clustered on the west and central sides of the region (Figure 7). The spatial distribution of percentage change in incomes from related sources between 2002 to 2007 still point to a growing dispersion of this trend along the south east and western portion of the map with the change evident in the central area of the map in Figure 8.Note also that all parishes listed on the map in figure 8 represent all the places that experienced change in the years under analysis. While the changes occurred at different levels, the externalities they left behind in their wake are significant enough to alter the landscape dynamics of the southern Louisiana marine environment through pollution and other forms of degradation already identified in the previous environmental impact analysis of estuaries and bayous of the region. The interesting thing about the situation is that the trends occurred in a gradual manner seemingly indicative of the spatial changes among the 8 southern Louisiana coastal parishes under analysis. Another dimension to the analysis, is that the parishes where notable landscape change occurred (such as Jefferson, Lafourche, St Bernard, St Tammany and others), are within the vicinity of one of the most fragile estuaries and basins of the country. The proximity of these areas to the water bodies and sensitive ecosystems brings to focus the threats in the face of change. With the Turbulent Gulf of Mexico ecozone nearby on the edge of the map, it is evident that the area is an ecosystem under stress. This is evident with the pace of changes on many elements such as agricultural land, number of available farms, harvested cropland, the treatments of land with fertilizers, population growth and declines. Consider also the behaviour of a whole set of socio economic indicators, from the federal transfers, sales and values of agricultural products in the market place as agents of growth and their role in straining the carrying capacity of an already fragile marine ecosystem of the region. Note also the projected levels of land loss in Figure 9. This is affecting the marine ecosystems adjacent to the study area. The spatial dispersion of the trends along the major estuary and basin of Terrabone and Baratotria Bay show that in the absence of an effective restoration plan, the disappearance of the landscape to open sea would result in the decline of coastal agricultural land use and other forms of aquaculture in the region. Just as the temporal analysis offered a dynamic snapshot of the changes among the various variables in the region, at the geospatial level, the dynamic aspects of change still holds. Because much of the variables were not static all those years in the parishes, it came as surprise that the preliminary results of the analysis point to the occurrence of change and a gradual diffusion of environmental stressors across space along the parishes and the adjacent streams and estuaries of the region.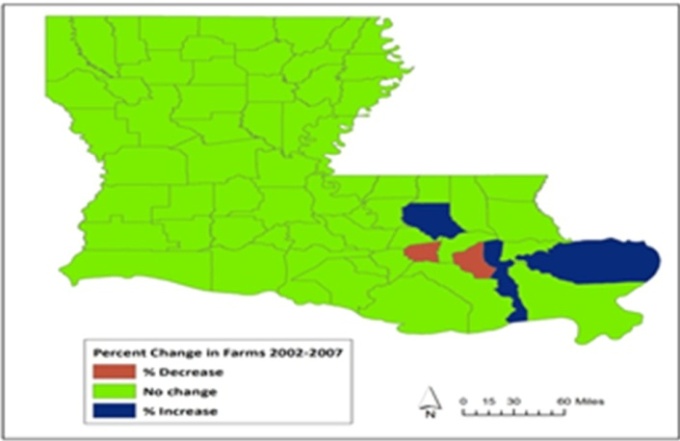 | Figure 6. Percent Change in Farms 2002-2007 |
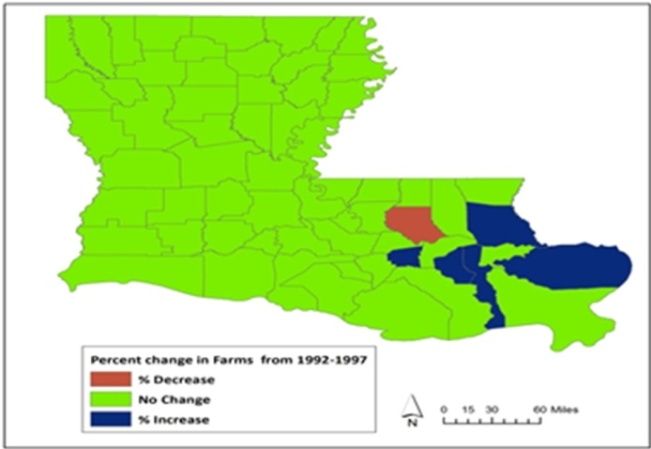 | Figure 7. Percentages in Farms from 1992-1997 |
 | Figure 8. Percent Change in Income from Farm Related Sources |
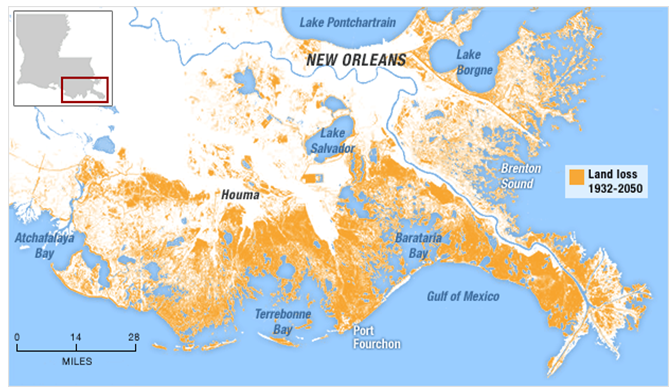 | Figure 9. The Projected Land Loss In Areas Adjacent to The Study Area |
3.6. Discussions and Results
Aside from the initiatives of federal and state agencies to mitigate the ecological impacts on the agricultural landscape, the farming landscape and the fragile estuaries and bayous known for their importance face mounting threats. These resources are at risk from the menace of pollution and recurrent loss of arable land and ecological degradation prompted by human activities. With the widespread use and discharge of pesticides, fertilizers and other chemicals and nutrient loads and sediments flow into the surface water environments such as estuaries and lakes in the area. The dangers associated with all these risk factors pose serious challenge to land managers burdened with the tedious work of mitigation in an ecosystem all already threatened by numerous stressors. While the incessant pressures from built up environments and incompatible land uses in the region and the resulting environmental change driven by a range of stressors threatens the adjoining marine ecosystems of the South Louisiana region. The mix scale analysis involving temporal-spatial techniques of descriptive statistics, connected to Geographic Information Systems (GIS), show increases in population growth, farm land loss. Additional impacts encompass the conversion of agricultural land to incompatible uses, water pollution and eroding soils from agricultural practices. Furthermore, the intensity of numerous farm types made up of rice, sugar cane, rice and dairy and the mounting investments in the farm sector of most parishes and growing trends in demographic elements of population and other socioeconomic factors are contributing to the declining quality of surface water ecosystem and degradation of wildlife habitats of the marine environment of the region. The intense farming activities resulting in the loss of arable agricultural land can be seen with the total size of land devoted to agriculture within the southern Louisiana parishes. This has resulted in the pressure on the hydrology and water environments during the censuses of 1992–2007. Apart from meagre gains in some parishes, the assessment of change during the fiscal years indicate that the use of acreages of land areas and treatment of land with fertilizers appeared widespread along some of the parishes coupled with some minor instances of limited application significant enough to impair the marine ecosystem. The same can also be said of harvested areas, total cropland, and irrigated areas. Within the same time, the population figures in the parishes stayed robust in 1997–2007, with a slight decrease in a few areas. Just as the number of farms reporting the value of agricultural products sold in the market place, tenure and ownership rose over the years. The other indicators including number of housing units, demand for building permits, income, federal transfer of payments, federal investments and host of others maintained appreciable increase as well. The impact of these trends on the benthic zone of the south Louisiana coast along the Gulf of Mexico has been compounded by recurrent strikes of hurricanes on the ecosystem and farm landscape. In the process, the continuous hazards unleashed from runoffs, polluted coastal habitats and streams have led to growing environmental problems. Considering the potential risk of economic downturn in the farm sector prompted by hurricanes and climatic variability. The dangers of aridity associated with the decreases and increases in irrigated land in some areas could be a problem when fresh water availability diminishes. Additionally, the growth in population in some parishes and the study area to some level accentuates ecological decline by impacting the hydrology of the area in terms of water quality and quantity. Considering the current assessment of water use in the region by the US Geological Surveys, the probability of water crisis should not be overlooked. Evidently, the vast capital at the disposal of the farm sector most notably the number of farms reporting farm products sold in markets, Federal transfer payments, and investments and the other benefits shaped by fiscal policy can trigger ecological stress. The larger the gains in market values of sold farm merchandise, the bigger the applications of agrochemicals, pesticides and other nutrients to enhance productivity. This trend not only endangers the carrying capacity of an already fragile coastal ecosystem in the South Louisiana region, but it creates a very tedious task for both environmental planners and decision makers. The incidence of change which is attributed to pressures from demography, economic activities and housing development resulted in more loss of agricultural land, decline in irrigated land, harvested land loss, cropland loss and increased use of fertilizers to boost farm productivity in the areas. The problem is compounded by the recurrent hazards of climatic variability factors such hurricanes coupled with the problems of stream pollution, soil erosion of various types from local farm practices. To map the location of the stressors and some key factors on the surrounding watersheds and their impacts across time and space. The paper adopts a mix scale method of temporal spatial analysis consisting of simple descriptive statistics analysis connected to GIS and spatial information systems. The design of spatial data needed for the GIS analysis required the identification of the appropriate digital county boundary lines covering the study periods of 1992, 1997, 2002 and 2007. With the emergence of GIS and its ability to locate marine environmental hotspots across time and space, analyzing the spatial diffusion of various ecological stressors and factors known to influence landscape change and ecosystem disturbance in the South Louisiana coastal region in various instances serves a meaningful rationale. This capability was quite critical during the design of data sets deemed ideal for agricultural landscape analysis and conservation in the study area. Accordingly, GIS techniques as used here provide a decision support mechanism for planers in the analysis of ecological hazards from farms and built environments of communities along the 8 coastal parishes of the South Louisiana region. Consequently, the results of the environmental analysis of the region using a set of ecological, socioeconomic and physical indicators anchored in temporal spatial assessment of GIS techniques and descriptive statistics analysis found the farm landscape and the surrounding ecology of the South Louisiana coastal region to be a marine ecosystem under immense stress in some areas. This is as result of agricultural activities and other types of development. There were also negative environmental impacts from the human activities, including a widespread stream pollution prompted by the run offs from built up areas and the oozing of agricultural chemicals into the water bodies and adjacent estuaries, bayous and watersheds. The other negative ecological externalities consist of competing land uses that involved the conversion of farmland to other uses, including housing and local infrastructure design, to meet the local needs and population growth in the parishes. As part of a concerted initiative mounted by the Federal, and local agencies to mitigate the problems encountered in the area. The different jurisdictions proposed various recovery strategies from water quality management to land and coastal habitat protection plan. These efforts comprise of the development of a Louisiana Sand Management Plan, The formulation of a Comprehensive Regional Economic Development Strategy, The Gulf of Mexico Initiative, Sustainability, Emphasis In The Use of Resources , and the design of Local Technical Assistance and Partnerships and Monitoring Activities. Going by the experience of the study area, landscape ecosystem recovery initiatives anchored in multijurisdictional level of partnerships and GIS assessments of the changing landscape induced by human activities and other factors serves a useful purpose in land management. See the Appendix A for a detailed analysis of the efforts.While the forces fuelling change do not operate in a vacuum, the data on the economic variable of government transfer payments show that the number of farms benefitting from assistance grew from 90 to 100 until it dropped from 164 to 115 in the periods of 1992, 1997, 2002 through 2007. The percentage levels of these variations stayed at 11.1% in gains and -29.87% in declines. The tally for 4 parishes (Lafourche, Livingston, St James, and St.Tammany) stayed within double digit figures of 20- 18 , 50-20, 25-14, 37-16, 20 to 28, and 13 -21 respectively. The rates of change, show the two parishes of Lafourche and Livingston each experiencing declines of -10%, and -44% while the other counties with data, posted gains estimated at both double and triple digits. The respective percentage equivalencies were 14.28% for Jefferson, 200 to 40 and 400 to 61.53 for the parishes of St Charles, St James, St John and St Tammany.In the 2002 through 2007 period, the areas that experienced the dual categories of gains and declines in the region broke almost even in 3 -4 parishes. About four parishes posted double digit declines and three maintained notable growth in the number of farms benefiting from government transfer payments. On the declining side, four parishes Lafourche and Livingston saw their numbers drop by over 50% with each of these areas experiencing between -52 to-56.75% declines. St James Parish which outpaced most areas in that category dropped by -66.66% at a level much higher than the -17.5% posted by St Tammany Parish. (Table 6). Government assistance or subsidies of these kinds have been broadly implicated in the growing incidence of landscape change. It stands as a mixed blessing in the sense that when they are too much and continuous, they encourage farmers to over produce and outstretch the available land resources with negative consequences in the marine environments of the area. Farmers experiencing some degree of buoyancy as dictated by favourable conditions in the market place are tempted to sell their land in those circumstances. This approach mortgages the ability to retain land for farming while encouraging ecological decline and the exposure to unwarranted externalities and risks. The same can be said of marginal land operations, in the absence of enough government transfer payments with financial guarantees. They are further exposed to the volatility of market forces and commodity prices which sometimes trigger foreclosure and the forfeiture of farm land to other uses that threaten the marine ecosystem. See the Appendix B for more on the factors.
4. Conclusions
To deal with the issues identified in the study area as part of the conclusions, this part of the paper offers five major recommendations for the sustainable use of the landscape and the surrounding costal environments. The suggested areas for future lines of action to boost the effective management of the landscape and surrounding ecology consist of proactive planning instead of the ad-hoc approach, regional cooperation, sustainable planning, the continuous support for the adoption of geospatial information systems and the design of regional land management information system, regular water quality monitoring along the parishes and partnerships among stakeholders. See Appendix C for details on the recommendations.Accordingly, this paper has analyzed the changing agricultural landscape of southern Louisiana and the impacts on the surrounding marine ecology using GIS. The paper outlined an overview of the issues in the literature pertaining to the region, the relevance of GIS, the current trends and the state of the ecosystem along the water bodies in the region. This was followed with the outline of the situation in the South Louisiana region and its estuaries and basins with some emphasis on the growing threats posed by ecological degradation and widespread presence of environmental stressors. Additionally, the paper identified the rise in socioeconomic activities impacting the stability of natural systems, the essence of mix scale approach, the analysis of environmental change indicators and the efforts to mitigate the problems and the factors responsible for the problems. From the data analysis, the overall farm land acreage of 302,665 for the entire area in 1992 fell to 166,797 at a rate of -44.89%. In the ensuing years, the size of farm land dropped further during 2002 to 2007 census from 319,098 to 285,722 by -10.45%. While this rate of change stood below the levels posted in the previous census periods, GIS analysis also points to growing changes in other factors located within the farm landscape of the region over the years coupled with widespread diffusion of agrochemical use across space in the parishes under analysis. This is compounded by the traces of chemicals in the fresh water ecosystem of most parishes. Aside from remediation efforts by various agencies to restore the landscape, the paper suggests the need for more analysis using GIS.Having come this far, several significant conclusions can be drawn from this study. Despite the increase from the sale of agricultural products, the use of GIS and descriptive statistics point to a mix of gains and declines in some of the environmental indicators. This trend raises the spectra of responsibilities for planners and those charged with coastal landscape management in the parishes of South Louisiana. With the emergence of GIS and its ability to locate environmental hotspots across time and space, analyzing the spatial diffusion of ecological stressors known to influence landscape disturbance in the South Louisiana region in various ways will continue to serve a useful purpose. This ability remains crucial in the design of data infrastructure best suited for agricultural landscape analysis and marine ecosystem protection. Accordingly, GIS technique as used here also provides a decision support mechanism for managers in the assessment of environmental risks prompted by human activities along the surrounding marine ecology in the 8 area parishes of South Louisiana. From the analysis on the South Louisiana region, the negative environmental impacts ravaging the agricultural landscape appear predicated on pressures from demography, the proliferation of urban development and intense farming activities, as well as externalities from in the surrounding ecology of the area. With the increase in fertilizerapplications, the threats facing water bodies, the constant decline of farmland and the exposure to pollution, the study area faces also the growing threats of human induced stressors. The absence of shared watershed management initiatives for the South Louisiana region seemed compounded due to the growing threats of stressors concentrating along the boundaries of common water bodies, and meager access to regional data for analyzing the impacts of change. The minimal emphasis on spatial analysis of the state of watershed ecosystem in the area hinders the ability of policy makers to predict the extent of degradation and the ecological costs of human activities. This can be remedied by drawing from the current advances in geospatial information systems in the management of shared waters in the region. This approach remains pertinent as parishes in the region grapple with efforts to restore their degraded water bodies. In light of these findings, the practical use of a mix scale approach involving the use of GIS in analyzing marine environmental change stands as an update to current literature on agricultural land landscape management of the South Louisiana region. The applications of Geospatial technology as demonstrated in this paper served a vital purpose in providing spatially referenced data for mapping hydrological, socioeconomic and environmental trends. This went a long way in indicating the level of changes in managed waters of the region. The paper also provides the preamble necessary in the design of spatial decision support tools for future management of agricultural landscape in the area.| Table 1. The Number of Farms |
| | Counties | # of Farms in 1997 | #of Farms in 1992 | %of Change from 1992-1997 | # of Farms in 2007 | #of Farms in 2002 | % of change from 2002-2007 | | Jefferson | 62 | 58 | 6.89 | 71 | 52 | 36.53 | | LaFourche | 398 | 412 | -3.39 | 440 | 405 | 8.64 | | Livingston | 345 | 374 | -7.75 | 476 | 451 | 5.54 | | St. Bernard | 27 | 25 | 8 | 45 | 24 | 87.5 | | St. Charles | 71 | 67 | 5.97 | 58 | 62 | -6.45 | | St. James | 65 | 63 | 3.17 | 64 | 69 | -7.24 | | St. John | 27 | 26 | 4.34 | 31 | 34 | -8.82 | | St. Tammany | 451 | 423 | 6.61 | 602 | 603 | -0.16 | | Total | 1446 | 1448 | -0.13 | 1787 | 1700 | 5.11 |
|
|
| Table 3. Total Cropland (farms) |
| | Counties | 1997 Farms | 1992 Farms | % of change from 1997-1992 | 2007 Farms | 2002 Farms | % of change from 2007-2002 | | Jefferson | 36 | 36 | No Change | 30 | 33 | -9.09 | | LaFourche | 319 | 345 | -7.53 | 284 | 307 | -7.49 | | Livingston | 252 | 279 | -9.67 | 268 | 267 | 0.374 | | St. Bernard | 20 | 25 | -20 | 20 | 22 | -9.09 | | St. Charles | 54 | 60 | -10 | 39 | 47 | -17.02 | | St. James | 62 | 60 | 3.33 | 50 | 62 | -19.35 | | St. John | 24 | 24 | No Change | 22 | 24 | -8.33 | | St. Tammany | 335 | 323 | 3.71 | 315 | 408 | -22.79 | | Total Cropland | 1102 | 1152 | -4.34 | 1028 | 1170 | -.12.13 |
|
|
| Table 4. Harvested Cropland (farms) |
| | Counties | 1997 Farms | 1992 Farms | % of change from 1992-1997 | 2007 Farms | 2002 Farms | % of change from 2002-2007 | | Jefferson | 19 | 20 | -5 | 19 | 25 | -24 | | LaFourche | 248 | 275 | -9.81 | 235 | 212 | 10.84 | | Livingston | 165 | 181 | -8.83 | 179 | 169 | 5.91 | | St. Bernard | 19 | 20 | -5 | 10 | 12 | -16.66 | | St. Charles | 46 | 49 | -6.12 | 29 | 33 | -12.12 | | St. James | 59 | 52 | 13.46 | 47 | 44 | 6.81 | | St. John | 23 | 19 | 21.05 | 17 | 23 | -26.08 | | St. Tammany | 222 | 231 | -3.89 | 215 | 230 | -6.52 | | Total | 801 | 847 | -5.43 | 751 | 748 | -0.40 |
|
|
| Table 5. Fertilizers and Chemicals Applied (commercial fertilizer, lime and soil conditioners) *acres treated* |
| | Counties | Acres treated in 1997 | Acres treated in 1992 | % of change from 1992-1997 | Acres treated in 2007 | Acres treated in 2002 | % of change from 2002-2007 | | Jefferson | 598 | 321 | 86.29 | 135 | 478 | -71.75 | | LaFourche | 33,435 | 44 645 | -25.1 | 28,093 | 34,019 | -17.41 | | Livingston | 7,061 | 6, 964 | 1.39 | 6,911 | 10,156 | -31.95 | | St. Bernard | 703 | 73 | 863.01 | 123 | 55 | 123.63 | | St. Charles | 3,124 | 1 611 | 93.91 | 2,250 | 1,446 | 55.6 | | St. James | 31,239 | 28 652 | 9.02 | 25,850 | 30,592 | -15.5 | | St. John | 4,156 | 7 610 | -45.38 | 4,851 | 8,130 | -40.33 | | St. Tammany | 8,952 | 6 785 | 31.93 | 6,990 | 6,695 | 4.4 | | Total | 89,268 | 96,661 | -7.64 | 75,203 | 91,571 | -17.87 |
|
|
| Table 6. Government Transfer Payments (total received) |
| | Counties | Farms 1997 | Farms 1992 | % of change from 1992-1997 | Farms 2007 | Farms 2002 | % of change from 2002-2007 | | Jefferson | 8 | 7 | 14.28 | 11 | 4 | 175 | | LaFourche | 18 | 20 | -10 | 24 | 50 | -52 | | Livingston | 14 | 25 | -44 | 16 | 37 | -56.75 | | St. Bernard | 3 | 3 | No Change | 7 | 1 | 600 | | St. Charles | 3 | 1 | 200 | 7 | No Data | N/A | | St. James | 28 | 20 | 40 | 9 | 27 | -66.66 | | St. John | 5 | 1 | 400 | 8 | 5 | 60 | | St. Tammany | 21 | 13 | 61.53 | 33 | 40 | -17.5 | | Total | 100 | 90 | 11.1 | 115 | 164 | -29.87 |
|
|
| | Counties | 1997 | 1992 | % of change from 1992-1997 | 2007 | 2002 | % of change from 2002-2007 | | Jefferson | 459.207 | 457.963 | 0.271 | 440.339 | 451.248 | -2.41 | | LaFourche | 88.65 | 86.354 | 2.65 | 92.715 | 90.45 | 2.5 | | Livingston | 84.364 | 73.264 | 15.15 | 117.148 | 98.387 | 19.06 | | St. Bernard | 68.204 | 67.068 | 1.69 | 33.439 | 66.283 | -49.55 | | St. Charles | 47.023 | 43.835 | 7.27 | 51.92 | 48.893 | 6.19 | | St. James | 20.952 | 20.748 | 0.983 | 21.242 | 20.952 | 0.72 | | St. John | 42.222 | 41.151 | 2.6 | 48.077 | 44.079 | 9.07 | | St. Tammany | 181.426 | 154.407 | 17.49 | 225.917 | 200.772 | 12.52 | | Total | 992.048 | 944.790 | -5.00 | 1030.797 | 1021.202 | 0.93 |
|
|
| Table 8. Pastureland and Rangeland Fertilized (farms) |
| | Counties | 1997 Farms | 1992 Farms | % of change from 1992-1997 | 2007 Farms | 2002 Farms | % of change from 2002-2007 | | Jefferson | 16 | 12 | 33.33 | 4 | 6 | -33.33 | | LaFourche | 79 | 84 | -5.9 | 96 | 43 | 123.25 | | Livingston | 135 | 117 | 15.38 | 193 | 180 | 7.22 | | St. Bernard | 3 | 2 | 50 | No Data | 2 | N/A | | St. Charles | 15 | 14 | 7.14 | 6 | 6 | 233.33 | | St. James | 6 | 6 | No Change | 7 | 4 | 75 | | St. John | 3 | 7 | -57.14 | 3 | 5 | -40 | | St. Tammany | 214 | 98 | 118.36 | 229 | 170 | 34.7 | | Total | 471 | 340 | 38.52 | 340 | 416 | -18.26 |
|
|
| Table 9. Louisiana: Market Value of Agricultural Products |
| | Counties | 1997 Farms | 1992 Farms | % of change from 1997-1992 | 2007 Farms | 2002 Farms | % of change from 2007-2002 | |
| Jefferson | 62 | 58 | 6.89 | 71 | 52 | 36.53 | | LaFourche | 398 | 412 | -3.39 | 440 | 405 | 8.64 | | Livingston | 345 | 374 | -7.75 | 476 | 451 | 5.54 | | St. Bernard | 27 | 25 | 8 | 45 | 24 | 87.5 | | St. Charles | 71 | 67 | 5.97 | 58 | 62 | -6.45 | | St. James | 65 | 63 | 3.17 | 64 | 69 | -7.24 | | St. John | 27 | 26 | 3.84 | 31 | 34 | -8.82 | | St. Tammany | 451 | 423 | 6.61 | 602 | 603 | -0.16 | | Total | 1446 | 1448 | -0.13 | 1185 | 1700 | -30.29 |
|
|
| Table 10. Estimated Market Value of Land and Buildings |
| | Counties | 1997 Farms | 1992 Farms | % of change from 1997-1992 | 2007 Farms | 2002 Farms | % of change from 2007-2002 | | Jefferson | 62 | 58 | 6.89 | 71 | 53 | 33.96 | | LaFourche | 400 | 413 | -3.14 | 440 | 403 | 9.18 | | Livingston | 345 | 374 | -7.75 | 476 | 448 | 6.25 | | St. Bernard | 27 | 25 | 8 | 45 | 23 | 95.65 | | St. Charles | 71 | 67 | 5.97 | 58 | 63 | -7.93 | | St. James | 65 | 63 | 3.17 | 64 | 70 | -8.57 | | St. John | 27 | 26 | 3.84 | 31 | 33 | -6.06 | | St. Tammany | 454 | 422 | 7.58 | 602 | 603 | -0.16 | | Total | 1451 | 1448 | 0.20 | 1787 | 1093 | 63.49 |
|
|
| Table 11. Louisiana: Tenure of Operator (Full Owners) |
| | Counties | # of Farms 1997 | #of Farms 1992 | %of change from 1992-1997 | #of Farms 2007 | #of Farms 2002 | %of change from 2002-2007 | | Jefferson | 42 | 38 | 10.52 | 41 | 37 | 10.81 | | LaFourche | 139 | 131 | 6.1 | 198 | 182 | 8.79 | | Livingston | 238 | 254 | -6.29 | 348 | 322 | 8.07 | | St. Bernard | 20 | 19 | 5.26 | 11 | 20 | -45 | | St. Charles | 10 | 16 | -37.5 | 15 | 18 | -16.66 | | St. James | 16 | 13 | 23.07 | 21 | 19 | 10.52 | | St. John | 13 | 14 | -7.14 | 17 | 15 | 13.33 | | St. Tammany | 340 | 336 | 1.19 | 497 | 483 | 2.89 | | Total | 818 | 821 | -0.36 | 1148 | 1096 | 4.74 |
|
|
Appendix A. The Efforts to Deal With the Problems
This portion of the paper momentarily notes the present initiatives in place to alleviate the problems therein identified. 1) The Development of a Louisiana Sand Management Plan (LASMP) Seeing the extent of problems confronting the region in terms silting and the buildup of sediments and erosion, an initiative captioned “ Louisiana Sand Management Plan (LASMP) has been designed through the state’s office of Coastal Protection and Restoration. Part of it includes the instillation of storm shields to ensure safety by minimizing damages to the farm landscape adjacent to the study area.2) The Formulation of a Comprehensive Regional Economic Development Strategy Being a place where the agricultural landscape has some vulnerability to the recurrent hazards impacting the economy and the agricultural market place. Many parishes in southern Louisiana teamed up to design a Comprehensive Economic Development Strategy during the fiscal year 2010 to contain future problems. The strategy seemed grounded in city planning, environmental recovery, and ecological hazard impacts on different domains including agricultural land base as well.3) The Gulf Mexico Initiative (GoMI)In the aftermath of numerous ecological upheavals on the landscape, The Gulf of Mexico Initiative has been also been designed to assist farm land producers in four southern states including Louisiana to enhance the quality of water so as to actualize sustainable productivity in the farming sector. In light of that, the United States Department of Agriculture’s Natural Resources Conservation Service (NRCS) unit is spearheading a novel water and wildlife conservation initiative in the Gulf Coast region of the country that covers the study area parishes. 4) Sustainability Emphasis in the Use of ResourcesKnowing that the pace of degradation ravaging much of the coastal environments’ of the study area stems from unsustainable practices, The NRCS Gulf of Mexico imitative would aid farmers inject sustainable farming and wildlife area management systems to boost farm efficiency. Another notable emphasis centers on the eradication of nutrient entrapment and flow in order to minimize sediment flow into unwanted areas. The proponents of the program expect the initiative to minimize the present misuse and wastage of water resources coupled with the stoppage of saltwater intrusion into fragile habitats providing refuge to countless endangered species. 5) Local Technical Assistance and Partnerships Realizing the current threats facing the estuary, the Barataria-Terrebonne National Estuary Program (BTNEP) was instituted as a joint venture involving Federal and State agencies, the business sector and industrial interests , environmental NGOs and renowned experts in science and technology as well as those in the fishing and agricultural operations. At the same time, The Louisiana Department of Agriculture and Forestry Office of Soil and Water Conservation would offer technical aid to those enrolled in the projects by using field and extension officers.6) Monitoring ActivitiesConsidering the recurrent problems of declining quality and the linkages to the changing agricultural landscape, The Louisiana Department of Environmental Quality has shown a commitment to regular monitoring of coastal water lines in the areas adjacent to the program localities in the search for chemical nutrients, suspended sediments and pathogens. For their own part, the Lower Delta Soil and Water Conservation Districts and the Louisiana Cooperative Extension Service will organize a series of seminars for farming operations to encourage greater acceptance of precision farming, and optional techniques for dealing with the leftovers from sugarcane crop farming.
Appendix B: Factors Responsible for the Change
Another twist to the changing agricultural landscape of the area is that population numbers stayed on the rise much of the time at the parish level and the overall region. Aside from the -5.00 % decline in population between 1992-1997, the number of residents rose by 0.53%. The population figures fell from 944.790 to 992.048 in 1992-1997 only to hit the million mark of 1,021.202 to 1,030.797 during the census of 2002 through and 2007. From the data, relative to the residents in the parishes, Jefferson and St Tammany had more population than the others. See that in the Jefferson area, the population numbers went from 457.963 - 459.207, and continued at 451.248 to 440.339. At the St Tammany area, the population figures of 154.407 grew to181.426 in 1992 to 1997 and continued on the same path with 200.772 to 225.917 residents in 2002 to 2007 (Table 7). With the recurrent gains in population evident in the parishes across the board during the 1992, to 1997 period, the double digit levels of increases emerged at the rates of 15.15% to 17.49 percent in the counties of Livingston and St Tammany and continued at the similar margins of 19.06 -15.52% between 2002 to 2007 (Table 7). The amount of people in any given period impacts the stability and functional ability of any landscape, and the south Louisiana marine ecosystem is not an exception. Being the shadow ecology and sink of the immediate vicinities, people depend on it for a variety of things from fodder, flora, and fauna. The problem arises when resources such as farm land, and water are over used to meet the needs of incompatible land uses such as the design of roads, bridges and homes. The other factors responsible for the changing problems in the landscape can be seen with the number of farms containing fertilized rangeland and pasture land. In the South Louisiana area, the overall numbers of fertilized land farms treated with chemicals for the study area grew from 340 to 471, the number faded from 416 farms to 340. The percentage of change for the entire area grew to 38.52% in 1992-1997 and fell to -18.26% in the study period under analysis. The largest concentration of pasture land farms treated with chemicals from the data appeared more in the parishes of Livingston and Tammany. The presence of more chemically treated pastureland in both parishes is evident in Livingston where the numbers grew from 117 to135 in 1992-1997, 180 to 193 during 2002 through 2007. In the Parrish of Tammany, pastureland and rangeland under fertilizer applications also jumped from 98 -214, 170 to 229 in the period under analysis. On the percentage of change, while more farms in the parishes practiced fertilizer treatment of pasturelands in the area, the declines in these practices were more prominent in the two parishes of Lafourche and St John. The rates of change in the two areas showed fertilizer use fell by -5.9 to -57.14 in the censuses of 1992 -1997. During the same period, when double and triple digit levels of increases (valued at 118.36 %, 50%, 33.33% -15.38%) in the fertilizer treatment of range and pasture pastureland stood firm in 4 parishes (St Tammany, St Bernard, St Jefferson and Livingston). The farms involved in these practices at St. Charles during the same period, stood at 7.14% (Table 8). The implication of these trends is that they serve as conduits of environmental degradation associated with the decline of water quality and stream ecosystem degradation. In essence, they pose a threat to biodiversity and their habitats in marine environments.Furthermore, while farms reporting market value of products sold dropped -0.13% to -30.29%. Farms reporting estimated market value of land and building grew from 0.20%to 63.49. Farms reporting that have full ownership of land initially fell - 0.36 % and latter grew to 4.74. Farms reporting full ownership of harvested cropland dropped much of the time from -8.69% to -1.01%. Harvested cropland farms fell to -5.43% and peaked up at 0.40%, Farms reporting irrigation use grew from 169.30% to 737% (Tables 9-11, 2). Another factor responsible for changing agricultural landscape of the area stems from the proliferation of housing infrastructure in the study area for the timing population. The intensity of these levels of developments are quite significant enough to spur changes in the availability of farmland. To understand the role of socio-economic elements of housing indicators one need not look further than the housing variables listed on the table from housing units to persons per household. Relative to the actual attributes of these areas in terms of the number of farms, population and size of arms. It comes as no surprise that of the overall housing units of 2,211,000 in 2010 and the total households of 1,854,753 in the region in 2006- 2010, the individual totals for Jefferson parish stayed higher than the areas. Given that Jefferson has more population, fewer farms and farmland than the high agricultural areas like Lafourche and Livingston, the high concentration of people in Jefferson may have the capacity to influence the presence of new residents in the other areas thereby putting more pressure on available land. This is made possible with the growing number of permits for new homes made possible by the emphasis on new developments in the local land use plans (Table 12). In this setting, also see that the median value of houses in the eight parishes of the south Louisiana region from Jefferson to St Tammany are valued at $130,000-$201,800 and close to the national average. With such value attached to land, the infatuations and benefits from land speculations can induce land sales and the conversion to other land uses. Another important element centers on the availability of capital indicators such as per capita income, median house hold income, retail sales per capita, and federal spending in the areas. All these indicators are catalysts for development that drive up the use of farmland for incompatible uses. The overall amount of $56,27,548 and the average household income of $50,758 dollars by South Eastern standards remain high enough to influence the use of farmland in the region. Note also that the home ownership rates for each of the parishes exceeded the 50 percent mark which is significant enough to impact the use of land in the area (Table 13). | Table 12. Socioeconomic Variables Associated with Housing and Change in South Louisiana |
| | Counties | Housing units, 2010 | Homeownership rate, 2006-2010 | Housing units in multi-unit structures, percent, 2006-2010 | Median value of owner-occupied housing units, 2006-2010 | Households, 2006-2010 | Persons per household, 2006-2010 | | Jefferson | 1,964,981 | 68.2% | 17.8% | $130,000 | 1,641,165 | 2.62 | | LaFourche | 38,582 | 77.0% | 9.1% | $115,500 | 34,108 | 2.74 | | Livingston | 50,170 | 80.4% | 5.1% | $142,400 | 42,962 | 2.85 | | St. Benard | 16,794 | 65.7% | 16.2% | $132,400 | 10,295 | 2.68 | | St.Charles | 19,896 | 81.6% | 10.2% | $170,200 | 18,460 | 2.81 | | St. James | 8,455 | 83.8% | 7.6% | $116,600 | 7,455 | 2.95 | | St.John | 17,510 | 77.9% | 8.8% | $146,700 | 15,772 | 2.91 | | St. Tammany | 95,412 | 80.4% | 11.0% | $201,800 | 84,536 | 2.68 |
|
|
| Table 13. Socioeconomic Variables Associated with Housing and Change in South Louisiana |
| | Counties | Per capita money income in past 12 months (2010 dollars) 2006-2010 | Median household income 2006-2010 | Retail sales per capita, 2007 | Building permits, 2010 | Federal spending, 2009 | | Jefferson | $23,094 | $43,445 | $12,921 | 11,343 | 52,638,645 | | LaFourche | $22,898 | $47,492 | $9,878 | 204 | 626,106 | | Livingston | $23,372 | $54,708 | $7,893 | 812 | 516,405 | | St. Bernard | $19,448 | $39,200 | $8,726 | 24 | 352,585 | | St. Charles | $25,728 | $60,961 | $7,492 | 91 | 315,478 | | St. James | $22,509 | $51,725 | $7,669 | 40 | 174,032 | | St. John | $20,842 | $47,666 | $9,492 | 52 | 286,584 | | St. Tammany | $29,282 | $60,866 | $15,382 | 578 | 1,364,710 |
|
|
Appendix C: Recommendations
To deal with the issues identified in the study area, the paper offers five major recommendations for the sustainable use of the landscape. The suggested areas for future lines of action ranged from the need to change the adhoc nature of federal assistance to improved monitoring of water quality and the environment. 1) Change the Adhoc Nature of Federal Assistance To Flooded FarmsGoing by its geography and the geophysical characteristics, the frequency of natural disasters in the areas under analysis are so enormous that they sometimes overwhelm local resources. This puts the already vulnerable landscape and fragile ecosystems at more risk. In light of that, the federal assistances earmarked for parishes in the South Louisiana region should be organized in a manner that anticipates the occurrence of the eventual risks. This can be attained through coordinated advanced warning systems, drills and contingency measures with full readiness in dealing with the eventualities rather than the usual adhoc approaches. Such reactionary responses create more problems when emergency workers charged with the recovery of flooded farm lands lack ready made plans to deal with the problems in affected areas. Because these risks can erode the stability of the agricultural landscape, the paper recommends that federal emergency be increased to help farmers so that degraded landscapes can be restored in a timely fashion and put back to production.2) Continue Regional Cooperation and Stake holder Partnerships Should be EncouragedThe environmental problems encountered along the changing agricultural landscapes of south Louisiana parishes were not limited to one area. Considering the lethal nature of farm externalities such as nutrient flow from rice field, and chemical runoffs from sugar cane plantations and their impacts on the surrounding coastal waters, and ground water and the quality of the environment, it is suggested that the parishes of southern Louisiana form a regional association to combat such environmental problems. The idea behind it is that it would be unfair for a parish at the downstream to bear all the problems attributed to nutrient flow and runoffs known to originate from the other parishes. Regional cooperation in clean ups and recovery efforts would go a long way in minimizing the problem. This can be strengthened through partnerships among the local soil and water conservation districts, farm producers, agri-businesses and environmental NGOs.3) Support the Regular Use of Geospatial Information Systems The analysis in the study area tracked the common issues in land loss and pollution, population growth, growing use of fertilizers, rises in socioeconomic indicators of income, building permits, market value of traded farm products, and irrigated land. Others include changes in harvested cropland, and the threats posed to habitats of endangered flora and fauna. The scale of pressures mounted on the surrounding estuary and basins, and the ecosystem in the parishes reaffirmed the essence of regular spatial inventorying of the sources and the applications of GIS as a decision support system for mangers in the region. Access to the latest advances in spatial information systems as well as climate risk information offers a sizable advantage to those who have it and hinders the readiness of those who lack it in tackling the problems facing the region. The paper recommends that managers support the applications and procurement of these devices for sustainable resource analysis. 4) Design a Regional Land Information Management System For the Parishes At the onset of the project comprehensive information on the land information and related elements at the parish level in the study area was lacking. Such a constraint limits the efforts of the decision makers to track the variations in land use within the different parishes on the landscape collectively. Knowing full well that most managers in the nine parishes lack effective monitoring devices, the paper suggests the design of a trans-boundary or regional land management devices to assist managers and local and federal organization so that they can effectively manage and plan for the use of the resources located on the southern Louisiana landscape. 5) Improve Water Quality Monitoring and the state of the Environment In the last several years, the surrounding coastal environments adjacent to the South Louisiana parishes have acted as a sink for the much of the externalities originating from human activities and farming in the region, In the process, the southern Louisiana estuary and basins have been encountering ecological decline emanating from farming and the built up environments. The problems include the flow of pollutants and contaminated materials in the form of nutrients, fertilizers and chemicals, the loss of farm land, irrigated land decline, and harvested cropland loss. This pushes the ecosystem beyond limits with grave consequences. Accordingly, the paper suggests that adequate measures be put in place in the region so as to mitigate the reoccurrence of these` ecological issues.
References
| [1] | Merem Edmund, Joan Wesley, Yaw Twumasi, Chandra Richardson, Dafine Forster 2012 a Geospatila analysis of the Changing Agricultural Landscape of Southern Louisiana Water Quality Conference NWQC In Portland Oregon. May 2-5 |
| [2] | United States Department of Agriculture. (2012).” Various Years Census Data: County Highlights” USDA NASS. D.C: Washington |
| [3] | United States Department of Agriculture (2011). “Gulf of Mexico Initiative: Louisiana, Mermentau Basin and Barataria-Terrebonne National Estuary” USDA-NRCS . D.C: Washington |
| [4] | Guidry Kurt (2005 October 5). Assessing of Damage to Louisiana Agricultural and Forestry , and Fisheries Sector. By Hurricane Rita. LSU AG Center, Research and Extension , Baton Rouge LA |
| [5] | Merem, E.C. Y.A Twumasi and C.Richardson ( January 2012). The Use of Geospatial Information Systems In The Analysis of Pollution Trends in Southern Mississippi Region. American Journal of Environmental Science and Engineering 1-1-14-29, |
| [6] | United States Geological Survey USGS 2007. Water Use In Louisiana, Water Resources Special Report No. 16 2007 and Various Years. Louisiana Department of Transportation and 7. Development. Baton Rouge LA |
| [7] | Merem, E.C., Y.A Twumasi, C.Richardson, and D Forster (2012 March b ) Using GIS and Climate Risk Information Systems to Analyze the Vulnerability of Coastal Counties in Louisiana and Mississippi. Resources and Environment 1-1-1-18, 2012 |
| [8] | Merem, E.C., Y.A Twumasi, C.Richardson, and D Forster 2012 Using GIS and Climate Risk Information Systems to Analyze the Vulnerability of Coastal Areas In The South East. In Proeeding Of The University Florida Climate Change Conference, In Orlando. May 2011 |
| [9] | Mack Taylor (2012). Changing Agricultural Landscape of North Central Louisiana, 1945-2007. Paper Presented at The AAG Annual Meeting |
| [10] | Delaune, RD. (2008 October). Non point Source of Nutrients and Herbicides Associate With Sugarcane Production and its impacts on Louisiana Coastal water Quality. Journal of Environmental Quality. 37:6:2275-2285 |
| [11] | Southwick, LM . ((2002 July 17). “Potential Influence of Sugarcane Cultivation On Estuarine Water Quality of Louisiana’s Gulf Coast" Journal of Agricultural Food Chemistry. 50:15:4393-9 |
| [12] | Merem, E.C. and Y.A Twumasi. (2005 December). “GIS Based Analysis of Growth Management and Environmental Decline of Central Mississippi Region. Geographic Information Sciences 11:2:130-137 |
| [13] | Merem, E.C. and Y.A Twumasi. (2005 December). “GIS Based Analysis of Growth Management and Environmental Decline of The Central Mississippi Region. Annals of GIS 11:2: 01:130- 138. |
| [14] | Merem, E.C. and Y.A Twumasi. (2005). GIS Applications In Land Management: The Loss of High Quality Land to Land Development In Central Mississippi From 1987-2002. The International Journal of Environmental Research and Public Health, 2:2:234-244 |
| [15] | Merem Edmund 2005 Environmental Accounting For The Changing Agricultural Land Value In Canada. The Case Ottawa South central . Edwin Mellen Press |
| [16] | Merem, E.C. and Y.A Twumasi. (2006).GIS and Remote Sensing Applications In The Assessment of Change Within a Coastal Environment In The Niger Delta Region of Nigeria. The International Journal of Environmental Health and Public Health., 3:1:98-106 |
| [17] | Merem, E.C. and Y.A Twumasi (2008 March).Geospatial Information Systems Analysis of Regional Environmental Change Along The Savannah River Basin of Georgia; International Journal of Environmental Research and Public Health. 5: 1:281-294 |
| [18] | Merem, E.C. and Y.A Twumasi. (2008 December 31st ). Using Spatial Information Technologies as Monitoring Devices In International Watershed Conservation along the Senegal River Basin of West Africa The International Journal of Environmental Research and Public Health, 5:5: 464-476 |
| [19] | Merem, E.C. and Y.A Twumasi (2008 February). “Using Geospatial Information Technology In Natural Resources Management: The Case of Urban Land Management In West Africa. Sensors 8:607-619 |
| [20] | Merem, E.C. Y.A Twumasi, J. Wesley, C Richardson and B Robinson . (2011 June 23rd). The Applications of GIS in the Analysis of the Impacts of Human Activities on South Texas Watersheds International Journal of Environmental Research and Public Health 8(6),2418-2446 |
| [21] | Merem, E..C. J. Wesley, C. Richardson, D.Forster, C Romano and J. Williams (2011 December ) “Using Geospatial Information Systems in Analyzing Urbanization Impacts on Stream Southern Habitats in Mississippi Coastal Ecosystem”. Journal of Environmental Science and Engineering 5:12-1624-1641 |
| [22] | Merem E.C (2011 May) “Geospatial Information Analysis of Land Uses Impacts in Southern Alabama”. Journal of Environmental Monitoring and Restoration (JEMREST )7:01-25. |
| [23] | Merem, E.C. and Y.A Twumasi (2011 December) Relationships between Climate Parameters and Forest Vegetation At and Near Digya National Park, Ghana The British Journal of Environment and Climate Change 1:4:2011-2115 |
| [24] | Merem Edmund 2005 Environmental Accounting For The Changing Agricultural Land Value In Canada. The Case Ottawa South central . Edwin Mellen Press |
| [25] | Merem Edmund, Joan Wesley, Yaw Twumasi, Chandra Richardson, Dafine Forster 2012 Geospatial analysis of the Changing Agricultural Landscape of Northern Mississippi. Paper Presented At AEHS conference In Sandiego California March 19 -24 |
| [26] | Abraham Kenneth (2005). The Dynamic of Landscape Change and Snow Geese in Mid-continent North America. Global Cell Biology.11.841-855 |
| [27] | Caffey RH (2003). Coastal Louisiana and South Florida; A comparative Wetland Inventory. National Sea Grant Library. American Wetlands. LSU AG Center Baton Rouge LA |
| [28] | Dokka, Roy.2005 Subsidence in Southern Louisiana and Its Impacts On Water and Waste Water Operations Department of Civil and Environmental Engineering and Center For Geo- Informatics., LSU, Baton Rouge |
| [29] | Eacles, Dianne (2002) , Assessing Wetland Functional Condition Change in Agricultural Landscapes USDA NRCS. Washington DC |
| [30] | Hite, James . (2011 August). Land Use Change, Resource Competition and Conflict; Discussion. Journal of Applied Agricultural Economics. 33:2:307-309 |
| [31] | Jackson Louise (2009) Potential for Adaptation to Climate Change in an Agricultural landscape in the Central Valley of California –Final Report, California Energy Commission. UCLA Davis |
| [32] | Wallace, Barbra. (2011 April). Assessment of Historical, Social, and Economic Impacts of OCS Development on Gulf Coast Communities . US Department of The Interior , New Orleans, April, 2011 Tetra Law Inc |
| [33] | Twilley Robert (2007). Gulf Coast Wetland Sustainability in Climate Change. Pew Center for Climate Change |
| [34] | Zhu H Nianhe, Doyle Thomas (2008). Gulf Coastal Forests In Changing Environment, Southern University Agricultural Research and Extension, Baton Rouge LA |
 Abstract
 Reference
 Full-Text PDF
 Full-text HTML